


Chapter 28.24
RAINFALL
Sections:
28.24.030 Comparison to NOAA Atlas 14.
28.24.040 Rainfall analysis – Rainfall depth – Duration – Frequency.
28.24.060 Rainfall analysis – Mean annual precipitation and storm events.
28.24.070 Depth-area reduction factors.
28.24.080 Intensity-duration-frequency curves for rational method.
28.24.010 Introduction.
Presented in this chapter are design rainfall data for the mean annual, minor, and major storm events. These data are used to determine storm runoff peak flows and volumes in conjunction with the runoff models described in Chapter 28.28 GJMC. All hydrologic analyses within the jurisdiction of this manual shall utilize the rainfall data presented herein for calculating storm runoff.
(Res. 40-08 (§ 601), 3-19-08)
28.24.020 Data sources.
Rainfall data is presented for three areas within Mesa County, the Grand Valley, as approximately defined by the area below 5,000 feet in elevation, area outside the Grand Valley, and the Leach Creek/Horizon Drive watersheds.
(a) Rainfall Data – Grand Valley Area. The rainfall data for the Grand Valley was obtained from the Henz Meteorological Services report prepared for Mesa County (Henz, 1992), which included a detailed analysis of the gage at Walker Field. Tables, figures, and equations are provided for point rainfall, intensity, and storm distributions for various storm recurrence intervals.
(b) Rainfall Data – Outside Grand Valley. For the area outside of the Grand Valley, rainfall data published by the National Oceanic and Atmospheric Administration (NOAA) in the NOAA Atlas 2, “Precipitation – Frequency Atlas of the Western United States, Volume III – Colorado” (NOAA, 1973) is recommended to develop point rainfall values, storm intensities, and distributions for the remainder of Mesa County. Procedures to obtain and interpret the data are provided herein.
(c) Rainfall Data – Both Areas. In the case where a watershed includes both areas (or areas outside of Mesa County), it is recommended that both sets of rainfall data be used to generate peak runoff rates and volumes, depending on which area the sub-watershed lies within. In addition, if point rainfall values from NOAA Atlas 2 vary throughout the watershed by more than 10 percent, the rainfall values used for analysis should also vary depending on where the sub-watershed lies.
(d) Rainfall Data – Leach Creek/Horizon Drive Watershed. For projects within the Leach Creek/Horizon Drive watershed (see Figure 28.24.020), the depth-duration-frequency data approved by FEMA (FEMA October 1, 2002) are recommended because these data were used for floodplain analysis and for design purposes. However, since the FEMA-approved data did not include all durations and frequencies, and since the Henz data are similar, the Henz data was used to supplement the FEMA data.
(e) Mean Annual Precipitation. Mean annual precipitation and mean annual storm events for design of water quality BMPs were obtained from Driscoll (Driscoll et al., November 1989). Analysis of Storm Event Characteristics for Selected Rainfall Gages Throughout the United States, EPA 8919148B 1100). These values are based on recording gage number 3488 and can be used throughout Mesa County.
(f) Probable Maximum Precipitation. In cases where probable maximum precipitation analyses are required, methodology outlined in a publication by NOAA and the USACE entitled “Hydrometeorological Report No. 49, Probable Maximum Precipitation Estimates, Colorado River and Great Basin Drainages” (NOAA and USACE, 1977) is recommended.
Figure 28.24.020: Leach Creek/Horizon Drive Watersheds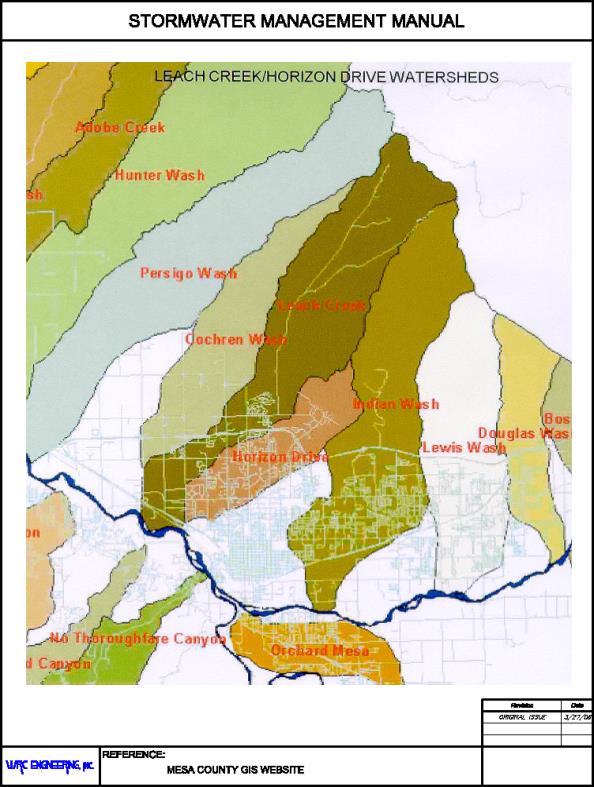
(Res. 40-08 (§ 601.1), 3-19-08)
28.24.030 Comparison to NOAA Atlas 14.
The National Weather Service (NWS) has updated the precipitation-frequency atlas for the semiarid, southwestern region of the United States (including the Mesa County area) from NOAA Atlas 2 to NOAA Atlas 14. A comparison was made for the 100- and two-year storms for durations of six- and 24-hour between NOAA Atlas 2 and NOAA Atlas 14.
The comparison shows that NOAA Atlas 14 is generally lower than NOAA Atlas 2 (i.e., from four to 16 percent in the Grand Valley and from zero to 46 percent in the mountains). NOAA Atlas 14 does appear to be more consistent with the data developed by Henz for the Grand Valley area. However, since NOAA Atlas 14 has not been accepted by the Colorado Water Conservation Board, precipitation values for areas outside of the Grand Valley were not obtained from NOAA Atlas 14, but were obtained from NOAA Atlas 2. When preparing Watershed Master Plans, the County will evaluate whether NOAA Atlas 14 values are more appropriate and may decide to use NOAA Atlas 14. For new developments and redevelopment, rainfall/runoff relationships shall be in accordance with GJMC 28.24.020.
(Res. 40-08 (§ 601.2), 3-19-08)
28.24.040 Rainfall analysis – Rainfall depth – Duration – Frequency.
For areas within the Grand Valley, point precipitation values are provided in Table 28.24.040(a) for various recurrence interval storms. These data were used to develop intensity-duration-frequency values and are used in developing storm distributions.
|
Storm Duration |
Precipitation Depth (inches) |
|||||
|---|---|---|---|---|---|---|
|
2-year Recurrence |
5-year Recurrence |
10-year Recurrence |
25-year Recurrence |
50-year Recurrence |
100-year Recurrence |
|
|
5-min |
0.10 |
0.14 |
0.18 |
0.25 |
0.31 |
0.39 |
|
10-min |
0.15 |
0.22 |
0.28 |
0.38 |
0.48 |
0.60 |
|
15-min |
0.19 |
0.28 |
0.36 |
0.48 |
0.61 |
0.76 |
|
30-min |
0.27 |
0.39 |
0.50 |
0.67 |
0.85 |
1.06 |
|
1-hr |
0.34 |
0.49 |
0.63 |
0.85 |
1.07 |
1.34 |
|
2-hr |
0.42 |
0.58 |
0.72 |
0.94 |
1.15 |
1.40 |
|
3-hr |
0.47 |
0.63 |
0.77 |
0.99 |
1.19 |
1.44 |
|
6-hr |
0.55 |
0.73 |
0.87 |
1.10 |
1.31 |
1.56 |
|
12-hr |
0.55 |
0.83 |
0.98 |
1.22 |
1.44 |
1.69 |
|
24-hr |
0.70 |
0.93 |
1.12 |
1.42 |
1.69 |
2.01 |
For the area outside of the Grand Valley, the NOAA Atlas 2 Rainfall Depth-Duration-Frequency Maps are reproduced for the Mesa County area in Figures 28.24.040(a) through (l). Maps are presented for the six- and 24-hour durations for the two-, five-, 10-, 25-, 50-, and 100-year recurrence intervals. Depending on the location of the project, point rainfall values are read from these figures, converted to other storm durations, and used to generate intensity-duration-frequency curves and design storms, following procedures described below.
For the areas within the Leach Creek/Horizon Drive watershed, point precipitation values are provided in Table 28.24.040(b) for various frequencies and durations.
|
Storm Duration |
Precipitation Depth (inches) |
|||||
|---|---|---|---|---|---|---|
|
2-year Recurrence |
5-year Recurrence |
10-year Recurrence |
25-year Recurrence |
50-year Recurrence |
100-year Recurrence |
|
|
5-min |
0.10 |
0.14 |
0.18 |
0.25 |
0.31 |
0.39 |
|
10-min |
0.15 |
0.22 |
0.28 |
0.38 |
0.48 |
0.60 |
|
15-min |
0.19 |
0.28 |
0.36 |
0.48 |
0.61 |
0.76 |
|
30-min |
0.27 |
0.39 |
0.50 |
0.67 |
0.85 |
1.06 |
|
1-hr |
0.29 |
0.41 |
0.52 |
0.85 |
0.86 |
1.07 |
|
2-hr |
0.42 |
0.58 |
0.72 |
0.94 |
1.15 |
1.40 |
|
3-hr |
0.46 |
0.63 |
0.78 |
0.99 |
1.24 |
1.52 |
|
6-hr |
0.55 |
0.72 |
0.86 |
1.10 |
1.28 |
1.52 |
|
12-hr |
0.67 |
0.85 |
0.99 |
1.22 |
1.39 |
1.61 |
|
24-hr |
0.79 |
1.01 |
1.19 |
1.42 |
1.71 |
1.99 |
NOTE: The italicized values are the actual FEMA-approved data. The remaining data was obtained from Table 28.24.040(a).
Figure 28.24.040(a): Rainfall Depth-Duration-Frequency: 2-Year, 6-Hour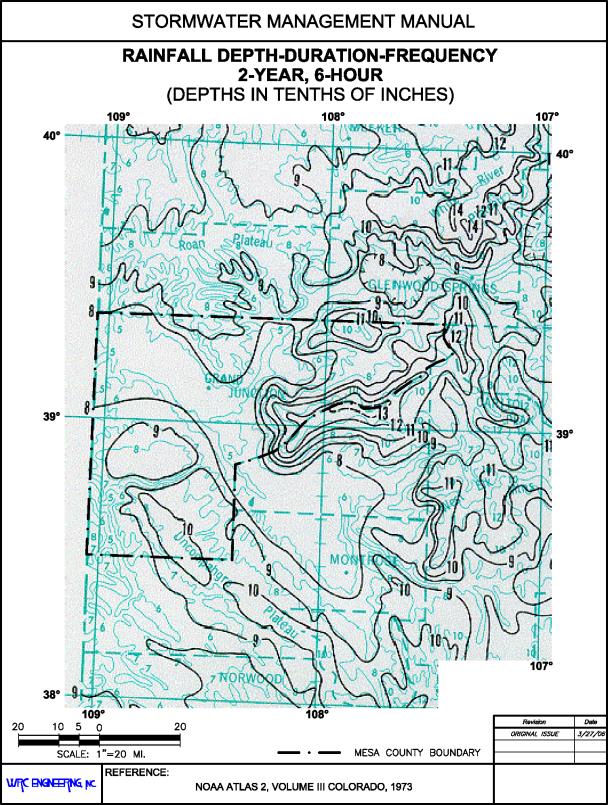
Figure 28.24.040(b): Rainfall Depth-Duration-Frequency: 5-Year, 6-Hour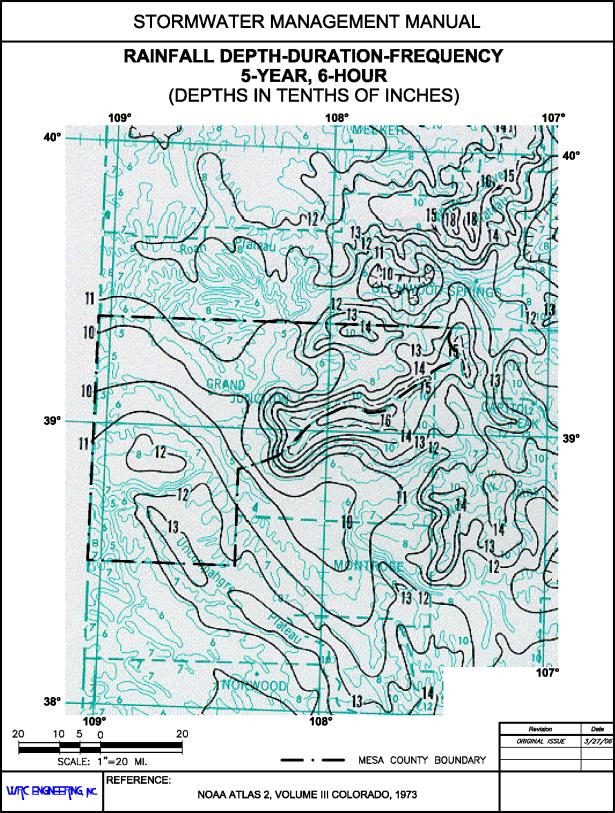
Figure 28.24.040(c): Rainfall Depth-Duration-Frequency: 10-Year, 6-Hour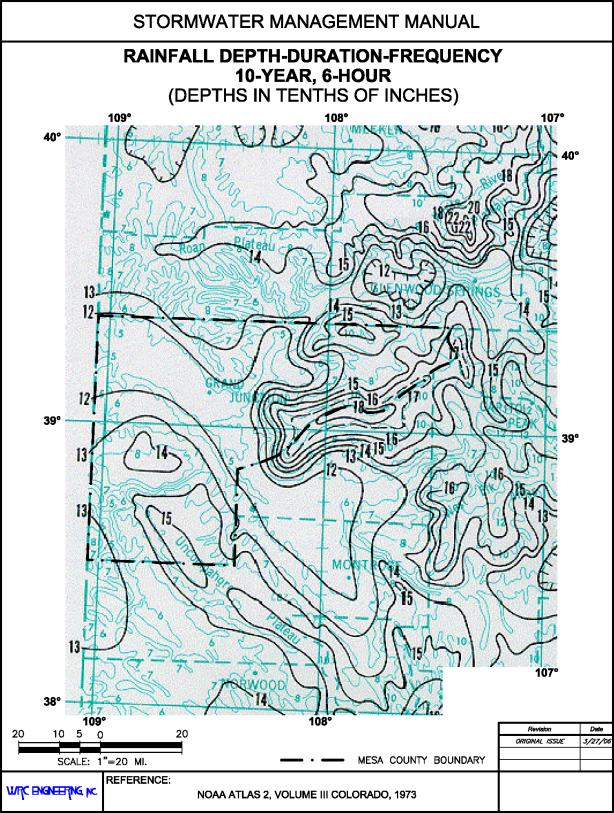
Figure 28.24.040(d): Rainfall Depth-Duration-Frequency: 25-Year, 6-Hour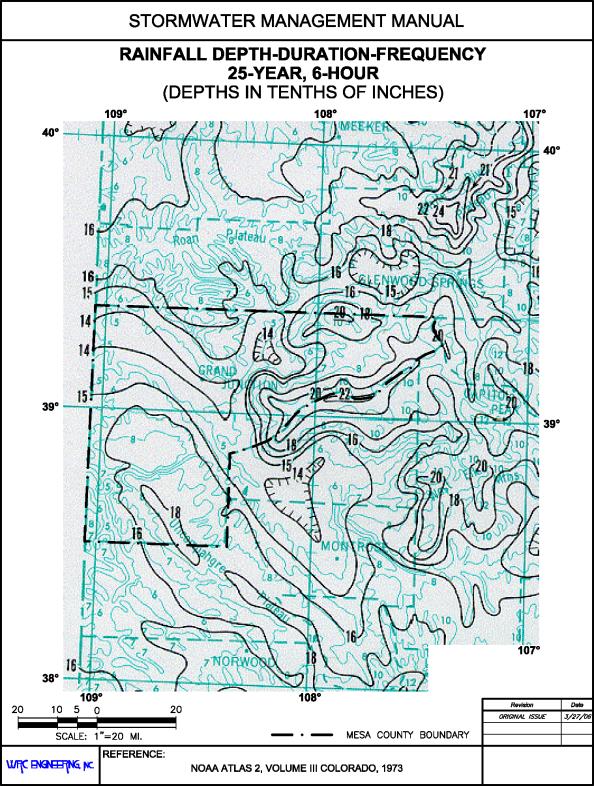
Figure 28.24.040(e): Rainfall Depth-Duration-Frequency: 50-Year, 6-Hour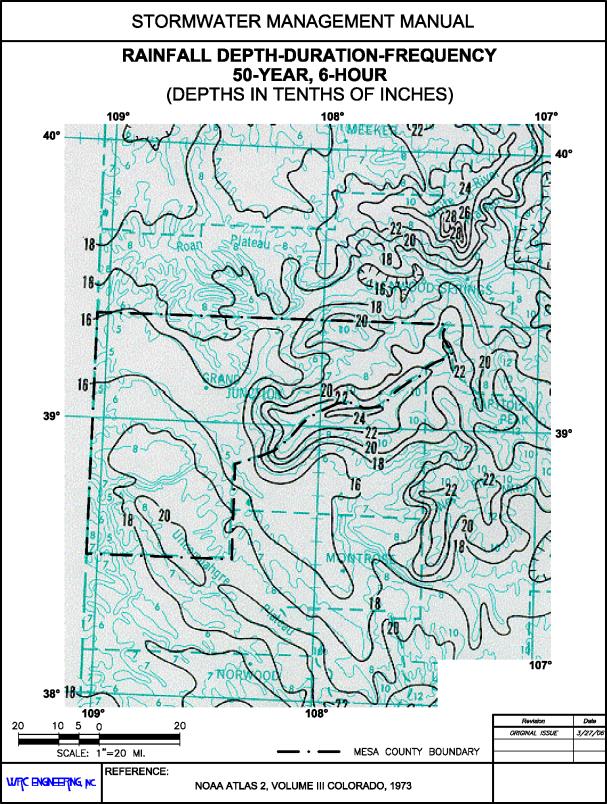
Figure 28.24.040(f): Rainfall Depth-Duration-Frequency: 100-Year, 6-Hour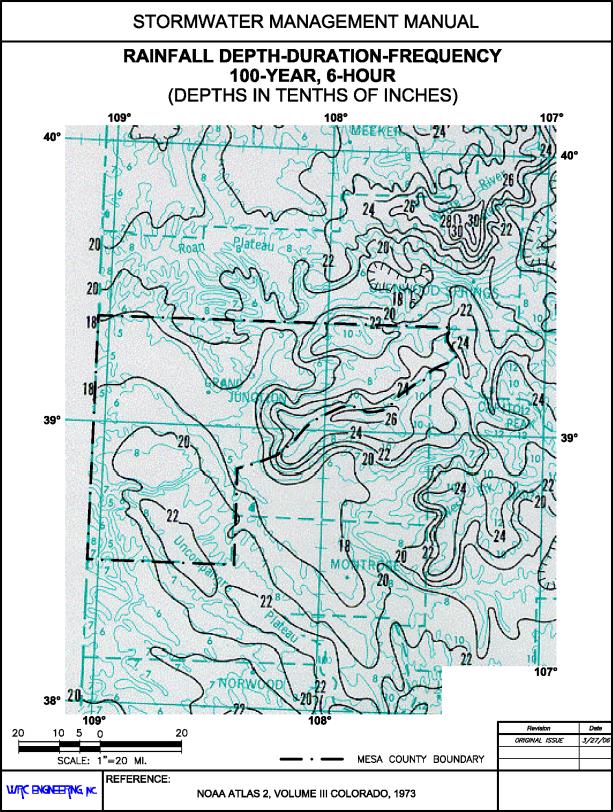
Figure 28.24.040(g): Rainfall Depth-Duration-Frequency: 2-Year, 24-Hour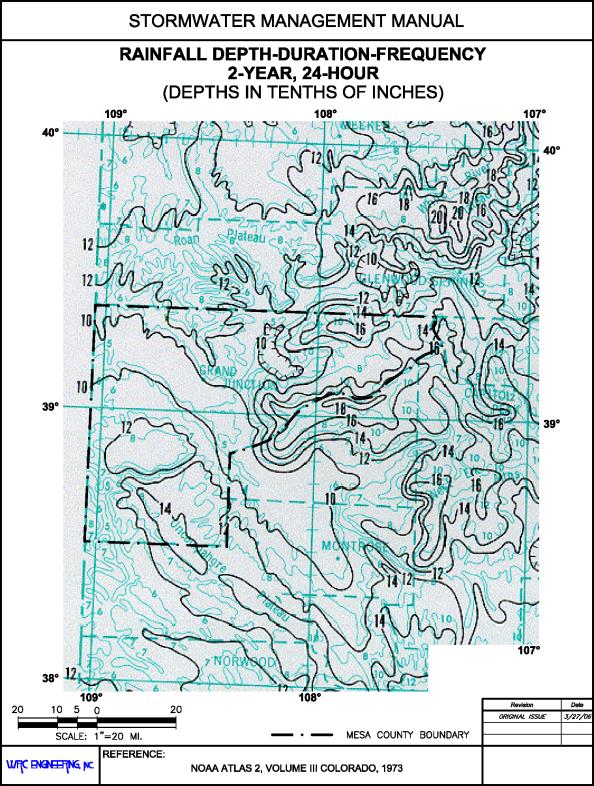
Figure 28.24.040(h): Rainfall Depth-Duration-Frequency: 5-Year, 24-Hour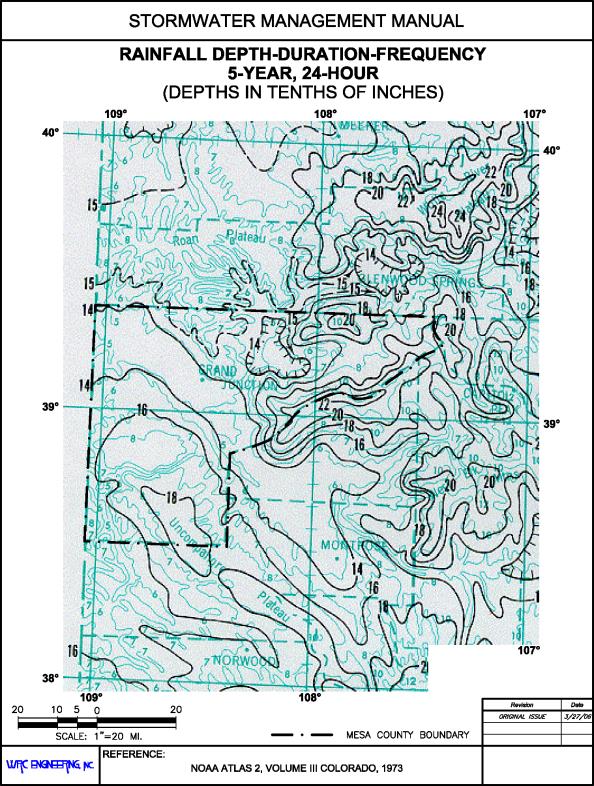
Figure 28.24.040(i): Rainfall Depth-Duration-Frequency: 10-Year, 24-Hour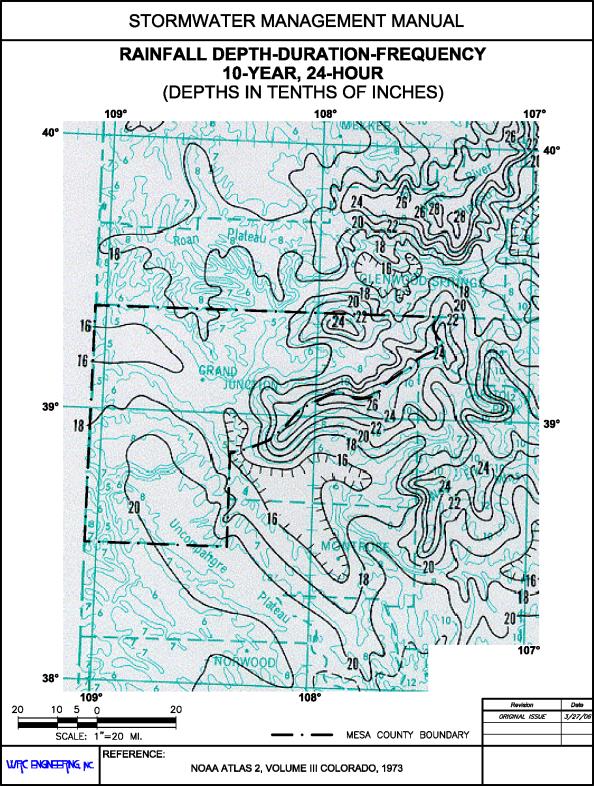
Figure 28.24.040(j): Rainfall Depth-Duration-Frequency: 25-Year, 24-Hour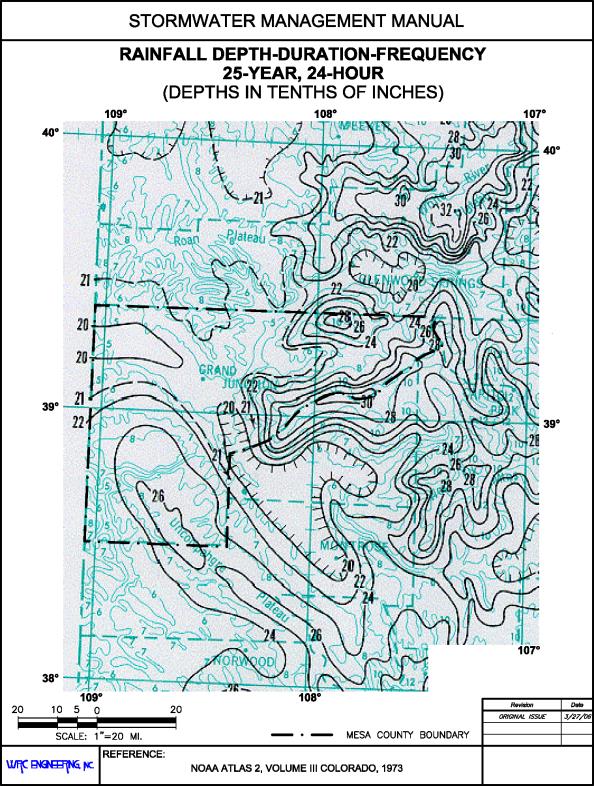
Figure 28.24.040(k): Rainfall Depth-Duration-Frequency: 50-Year, 24-Hour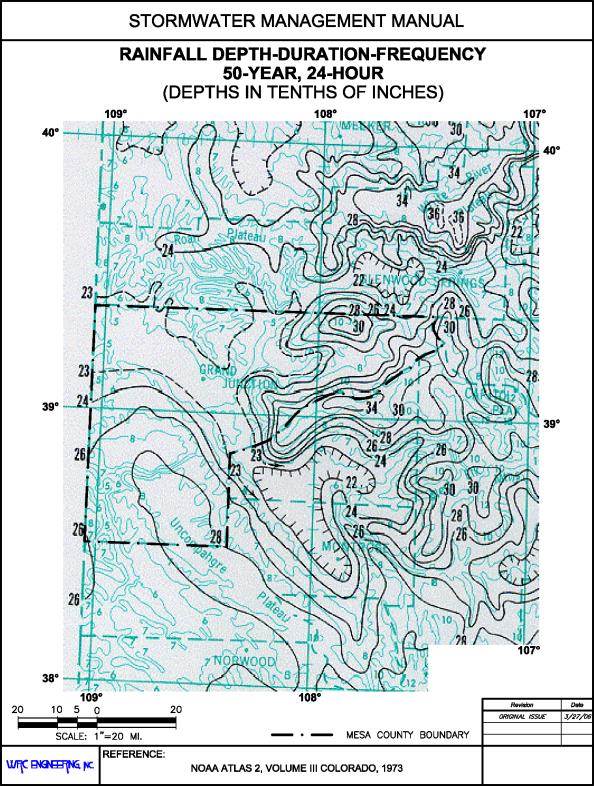
Figure 28.24.040(l): Rainfall Depth-Duration-Frequency: 100-Year, 24-Hour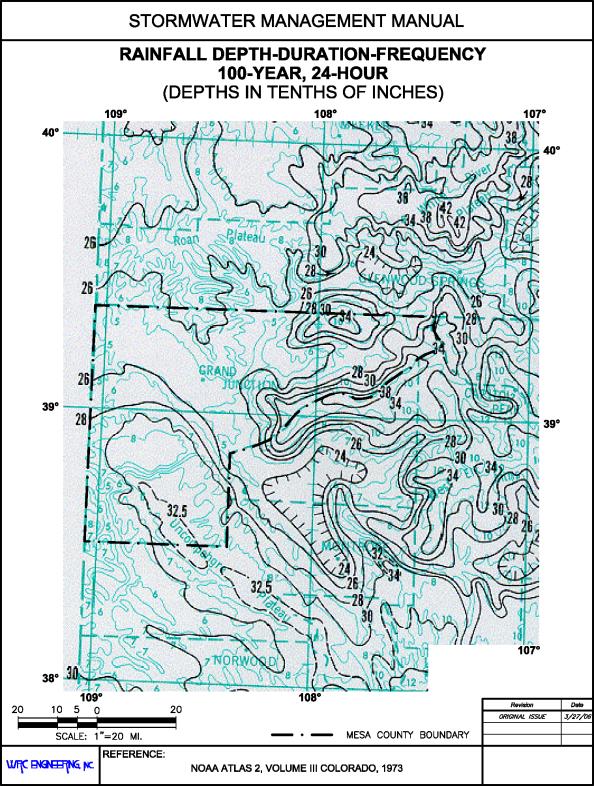
(Res. 40-08 (§ 602.1), 3-19-08)
28.24.050 Rainfall analysis – Rainfall depths for durations from one to six hours and less than one hour.
For areas within Grand Valley, point rainfall values for different storm durations are obtained from Table 28.24.040(a).
For areas outside the Grand Valley, the rainfall values are determined using procedures recommended in NOAA Atlas 2 and summarized below:
(a) Step 1. Read and record the point rainfall values for the six- and the 24-hour durations obtained from Figures 28.24.040(a) through (l) for the two- and 100-year recurrence intervals at the desired location(s) within Mesa County.
(b) Step 2. Calculate the two-year, one-hour and 100-year, one-hour rainfall amounts using the following equations:
|
Y2 = 0.011 + 0.942 [ (x1) (x1 / x2) ] |
(28.24-1) |
|
Y100 = 0.494 + 0.755 [ (x3) (x3 / x4) ] |
(28.24-2) |
Where:
|
Y2 = 2-yr, 1-hr estimated value (in) |
|
Y100 = 100-yr, 1-hr estimated value (in) |
|
x1 = 2-yr, 6-hr value (in) |
|
x2 = 2-yr, 24-hr value (in) |
|
x3 = 100-yr, 6-hr value from (in) |
|
x4 = 100-yr, 24-hr value from (in) |
(c) Step 3. Plot the two- and 100-year, one-hour rainfall (Y2 and Y100) values on Figure 28.24.050 and draw a straight line connecting these points. The one-hour point rainfall values for the five-, 10‑, 25-, and 50-year storm events are then read from the graph.
(d) Step 4. Calculate the two- and three-hour duration rainfall for the various recurrence intervals using the following equations:
|
P2-hr = 0.341 P6-hr + 0.659 P1-hr |
(28.24-3) |
|
P3-hr = 0.569 P6-hr + 0.431 P1-hr |
(28.24-4) |
Where:
|
P 2-hr = 2-hr ‘x’-yr estimated value (in) |
|
P 3-hr = 3-hr ‘x’-yr estimated value (in) |
|
P 1-hr = 1-hr ‘x’-yr previously determined (in) |
|
P 6-hr = 6-hr ‘x’-yr previously determined (in) |
(e) Step 5. Calculate the point rainfall values for durations less than one hour by multiplying the one-hour precipitation depths by the factors listed in Table 28.24.050:
|
Duration (min) |
5 |
10 |
15 |
30 |
60 |
|
Ratio to 1 hour |
0.29 |
0.45 |
0.57 |
0.79 |
1.00 |
The results from the steps above will result in a table of point rainfall values for the project area, similar to Table 28.24.040(a). These data can then be adjusted for the size of the watershed if needed (see GJMC 28.24.070) and used to develop intensity-duration-frequency curves (see GJMC 28.24.080) design storm (see GJMC 28.24.090).
For areas within the Leach Creek/Horizon Drive watershed, point rainfall values for different storm durations are obtained from Table 28.24.040(b).
Figure 28.24.050: Precipitation Depth Versus Return Period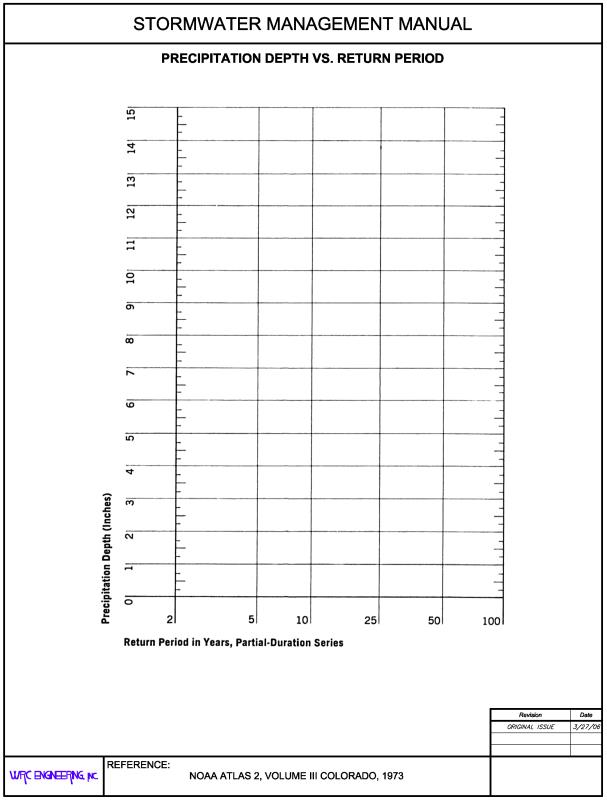
(Res. 40-08 (§ 602.2), 3-19-08)
28.24.060 Rainfall analysis – Mean annual precipitation and storm events.
For analysis and design of water quality BMPs, the mean annual precipitation and storm events are used, which are summarized below:
|
|
|
Average |
Coefficient of Variation |
|---|---|---|---|
|
Annual Statistics |
|
|
|
|
|
No. of Storms |
25 |
0.27 |
|
|
Precipitation (in/year) |
6.76 |
0.35 |
|
Independent Storm Events |
|
|
|
|
|
Duration (hr) |
9.4 |
0.73 |
|
|
Intensity (in/hr) |
0.044 |
1.15 |
|
|
Volume (in) |
0.28 |
0.70 |
|
|
Interval (hr) |
370 |
1.21 |
Note that the coefficient of variation is defined as the ratio of the standard deviation to the mean.
(Res. 40-08 (§ 602.3), 3-19-08)
28.24.070 Depth-area reduction factors.
The area adjustment to the point rainfall values described below applies to both the Grand Valley area and areas outside of the Grand Valley. In general, watersheds of less than 10 square miles do not require adjustment.
The NOAA Atlas 2 precipitation depths are related to rainfall frequency at an isolated point. Storms, however, cause rainfall to occur over extensive areas simultaneously, with more intense rainfall typically occurring near the center of the storm. Standard precipitation analysis methods require adjusting point precipitation depths downward to estimate the average depth of rainfall over the entire storm area. This is normally performed using depth-area reduction curves relating to a point precipitation reduction factor to storm area and duration.
The depth-area reduction factors used for rainfall analysis in the Mesa County area are provided in Figure 28.24.070.
For areas greater than 200 square miles, the ability of the thunderstorm generating mechanisms (i.e., available moisture, strong convective currents, etc.) to sustain a thunderstorm much greater than 200 square miles in diameter is greatly reduced. Therefore, only a portion of an entire drainage basin could be subject to precipitation from the thunderstorm event. Analysis of this effect on runoff peaks and volumes is complicated by the necessity to determine the “storm centering” which produces the greatest peak flow and/or volume at the selected design point. In order to obtain a consistent method of analysis for these areas, the designer shall consult with the director to determine the appropriate method of analysis and design rainfall area reduction factors for the specific location and basin under study.
Figure 28.24.070: Depth-Area Curves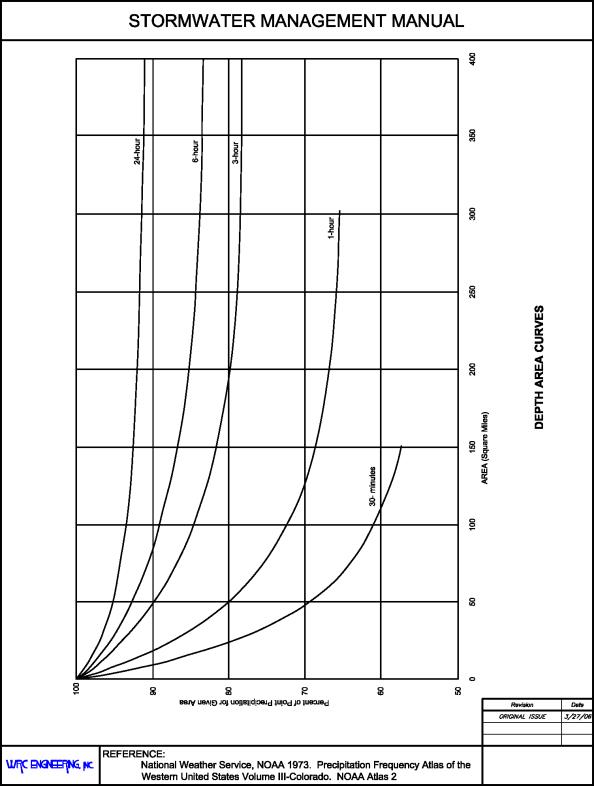
(Res. 40-08 (§ 603), 3-19-08)
28.24.080 Intensity-duration-frequency curves for rational method.
For areas within the Grand Valley Area, rainfall intensities as a function of storm duration and recurrence interval are provided in Table 28.24.080 and Figure 28.24.080. These data were derived from the investigation by Henz Meteorological Services (Henz 1992).
|
Storm Duration |
Precipitation Intensity – Grand Valley Area (inches/hour) |
|||||
|---|---|---|---|---|---|---|
|
2-Year Recurrence |
5-Year Recurrence |
10-Year Recurrence |
25-Year Recurrence |
50-Year Recurrence |
100-Year Recurrence |
|
|
5 |
1.20 |
1.68 |
2.16 |
3.00 |
3.72 |
4.68 |
|
10 |
0.90 |
1.32 |
1.68 |
2.28 |
2.88 |
3.60 |
|
15 |
0.76 |
1.12 |
1.44 |
1.92 |
2.44 |
3.04 |
|
30 |
0.54 |
0.78 |
1.00 |
1.34 |
1.70 |
2.12 |
|
60 |
0.34 |
0.49 |
0.63 |
0.85 |
1.07 |
1.34 |
Intensity values for any time of concentration up to 60 minutes can also be determined from the following equation (Froehlich 1995):
|
Ix |
= |
a*P1/(10+Tc)b |
Where:
|
Ix |
= |
Intensity for recurrence interval “x,” in/hour |
|
P1 |
= |
Point rainfall value for one-hour duration (see Table 28.24.040(a)) (inches) |
|
Tc |
= |
Time of concentration, minutes |
|
a, b |
= |
coefficients, a = 28.9, b = 0.786 for all of Mesa County |
Using the coefficients above, this equation will generally match the values in Table 28.24.040(a) to within two percent. Whereas the coefficients have not been verified for areas outside the Grand Valley, since the equation is based on the same ratios provided in Table 28.24.040(b), the results will be comparable.
For areas outside of the Grand Valley, first determine the two- and 24-hour point rainfall values for the desired storm recurrence intervals, then determine the one-hour point rainfall value, as described in GJMC 28.24.050. Finally, use the above equation to compute the intensity at any time of concentration and for all storm recurrence intervals.
For areas within the Leach Creek/Horizon Drive watershed, determine the two- and 24-hour point rainfall from Table 28.24.040(b), and then follow the procedures described above.
Figure 28.24.080: Intensity-Duration-Frequency Curves – Grand Valley Area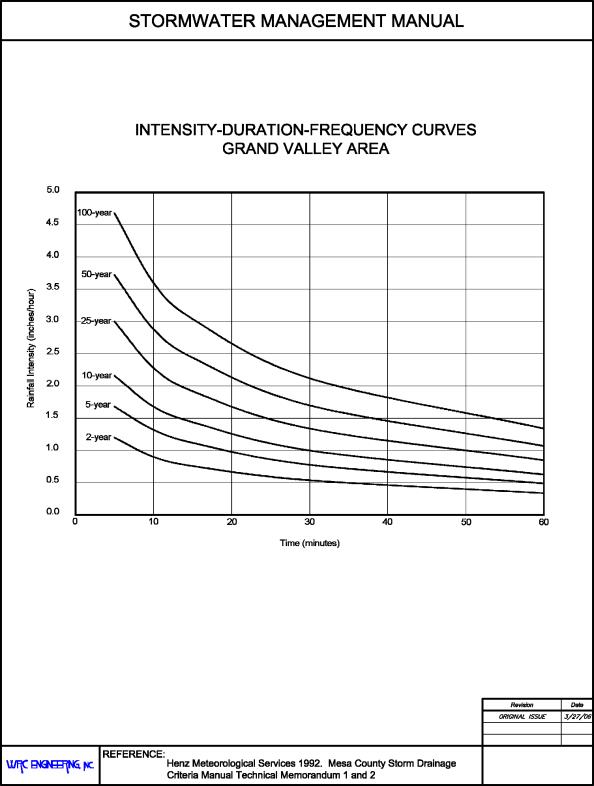
(Res. 40-08 (§ 604), 3-19-08)
28.24.090 Design storms.
For hydrograph analysis, the recommended minimum design storm duration is three-hour (Henz 1992). Approximately 90 percent of the three-hour total rainfall is distributed within the second hour of the storm, in accordance with recommendations of Henz (Henz 1992). The remaining 10 percent of the storm total is divided equally between the first and third hour.
An example of this distribution is provided in Table 28.24.090 and on Figure 28.24.090, which also compares the recommended design storm to the NRCS two- and six-hour distributions. As can be seen from the figure, the recommended storm is more severe in that 90 percent of the total precipitation occurs in a one-hour period compared to 80 percent for the NRCS two-hour and a little more than 50 percent for the NRCS six-hour event.
|
Duration (minutes) |
Cumulative Proportion of 3‑Hour Precipitation |
Duration (minutes) |
Cumulative Proportion of 3‑Hour Precipitation |
Duration (minutes) |
Cumulative Proportion of 3‑Hour Precipitation |
|---|---|---|---|---|---|
|
5 |
0.004 |
65 |
0.089 |
125 |
0.960 |
|
10 |
0.007 |
70 |
0.199 |
130 |
0.964 |
|
15 |
0.011 |
75 |
0.391 |
135 |
0.967 |
|
20 |
0.015 |
80 |
0.546 |
140 |
0.971 |
|
25 |
0.018 |
85 |
0.642 |
145 |
0.974 |
|
30 |
0.022 |
90 |
0.728 |
150 |
0.978 |
|
35 |
0.026 |
95 |
0.792 |
155 |
0.982 |
|
40 |
0.029 |
100 |
0.847 |
160 |
0.985 |
|
45 |
0.033 |
105 |
0.892 |
165 |
0.989 |
|
50 |
0.036 |
110 |
0.929 |
170 |
0.993 |
|
55 |
0.040 |
115 |
0.947 |
175 |
0.996 |
|
60 |
0.044 |
120 |
0.956 |
180 |
1.000 |
Figure 28.24.090: Design Storm Distribution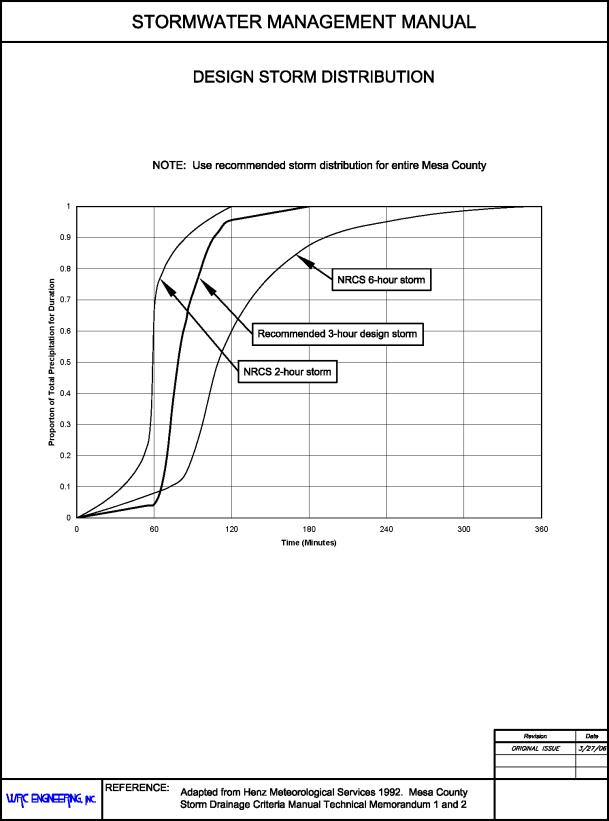
(Res. 40-08 (§ 605), 3-19-08)