


Chapter 31.12
WIRELESS MASTER PLAN
Sections:
Article I. The Telecommunications Industry
31.12.040 Wireless handset evolution.
31.12.050 Satellite technologies.
31.12.060 Transmission equipment.
31.12.070 Equipment cabinet and feed lines.
31.12.080 Antennas and antenna arrays.
31.12.090 Transmission equipment, towers and base stations.
31.12.100 Concealment options.
31.12.110 Wireless infrastructure.
31.12.120 Antenna network capacity.
Article II. Master Plan Development
31.12.150 Existing transmission equipment, stakeholders and inventory.
31.12.160 Existing antenna locations.
31.12.170 Search area within proposed coverage areas.
31.12.190 Tower height and antenna mounting elevation considerations.
31.12.210 Theoretical composite coverage from existing antenna locations.
31.12.220 Network capacity, wireless network planning and future tower site projections.
31.12.230 Estimation of future antenna sites.
Article III. Study Areas
31.12.250 PWSF inventory, analysis and mapping by study area.
31.12.260 City of Grand Junction characteristics.
31.12.270 City of Grand Junction theoretical root mean square maps.
31.12.280 Persigo 201 Boundary existing antenna locations.
31.12.290 Persigo 201 Boundary composite maps.
31.12.300 Persigo 201 Boundary propagation mapping.
31.12.310 Persigo 201 Boundary estimation of future antenna sites.
31.12.320 Public properties as fill-in sites for network gaps.
31.12.330 Lower Valley characteristics.
31.12.340 Lower Valley theoretical root mean square maps.
31.12.350 Lower Valley existing antenna locations.
31.12.360 Lower Valley composite maps.
31.12.370 Lower Valley estimation of future antenna sites.
31.12.380 Palisade characteristics.
31.12.390 Palisade theoretical root mean square maps.
31.12.400 Palisade existing antenna locations.
31.12.410 Palisade composite maps.
31.12.420 Palisade estimation of future antenna sites.
31.12.430 DeBeque characteristics.
31.12.440 DeBeque theoretical root mean square maps.
31.12.450 DeBeque existing antenna locations.
31.12.460 DeBeque composite maps.
31.12.470 DeBeque estimation of future antenna sites.
31.12.480 Glade Park characteristics.
31.12.490 Glade Park theoretical root mean square maps.
31.12.500 Glade Park existing antenna locations.
31.12.510 Glade Park composite maps.
31.12.520 Glade Park estimation of future antenna sites.
31.12.530 Gateway characteristics.
31.12.540 Gateway theoretical root mean square maps.
31.12.550 Gateway existing antenna locations.
31.12.560 Gateway composite maps.
31.12.570 Gateway estimation of future antenna sites.
31.12.580 Whitewater characteristics.
31.12.590 Whitewater theoretical root mean square maps.
31.12.600 Whitewater existing antenna locations.
31.12.610 Whitewater composite maps.
31.12.620 Whitewater estimation of future antenna sites.
31.12.630 Town of Collbran characteristics.
31.12.640 Town of Collbran theoretical root mean square maps.
31.12.650 Town of Collbran existing antenna locations.
31.12.660 Town of Collbran composite maps.
31.12.670 Town of Collbran estimation of future antenna sites.
31.12.680 Mesa County Study Area C – Overview.
31.12.690 Estimation of future antenna sites: Inset 1.
31.12.700 Estimation of future antenna sites: Inset 2.
31.12.710 Estimation of future antenna sites: Inset 3.
31.12.720 Estimation of future antenna sites: Inset 4.
31.12.740 Grand Junction/Persigo 201 study area.
31.12.760 Ongoing goals and objectives to maximize the benefits of the master plan.
Appendix Wireless Infrastructure Inventory.
31.12.010 Acknowledgements.
The following individuals played an important role in the development of this plan. Gratitude also is extended to the citizens, wireless industry and other stakeholders who participated in the public hearings and other special meetings.
|
Grand Junction Regional Communications Center |
|
|
John Camper, Chair and Chief of Police, Grand Junction |
|
|
Matt Lewis, Sheriff, Mesa County |
|
|
Ken Watkins, Fire Chief, Grand Junction |
|
|
Judy Macy, Chief of Police, Fruita |
|
|
Deb Funston, Chief of Police, Palisade |
|
|
Mick Lockwood, Fire Chief, Plateau Valley Fire District |
|
|
|
|
|
City of Grand Junction |
Mesa County |
|
City Council |
Board of County Commissioners |
|
Phyllis Norris, Mayor |
Rose Pugliese, Chair |
|
Marty Chazen, Mayor Pro Tem |
John Justman |
|
Barbara Traylor Smith |
Scott McInnis |
|
Bennett Boeschenstein |
|
|
Duncan McArthur |
Planning Commission |
|
Chris Kennedy |
John “Rusty” Price, Chairperson |
|
Rick Taggart |
Robert Erbisch |
|
|
Christi Flynn |
|
Planning Commission |
David Hartmann |
|
Christian Reece, Chair |
Phillip Jones |
|
Jon Buschhorn |
Joseph Moreng |
|
Kathy Deppe |
Chip Page |
|
Ebe Eslami |
George Skiff |
|
Keith Ehlers |
Bill Somerville |
|
George Gatseos |
Ron Wriston |
|
Aaron Miller |
|
|
Steve Tolle |
County Administrator |
|
William Wade |
Frank Whidden |
|
|
|
|
City Manager |
|
|
Tim Moore |
|
|
|
|
|
|
|
|
Project Team |
Project Team |
|
|
|
|
City of Grand Junction |
Mesa County |
|
Jim Finlayson, IT Director |
Rick Corsi, IT Applications Manager |
|
David Thornton, Principal Planner |
Troy Flick, IT Manager |
|
Scott Hockins, Special Projects Manager |
Kaye Simonson, Lead Planner |
|
Steve Smith, GIS Analyst |
|
|
|
CityScape Consulting Team |
|
Grand Junction Regional Communication Center |
Susan Rabold, Project Manger |
|
Paula Creasy, GJRCC Project Manager |
Elizabeth Smith, Government Relations Manager |
|
|
Jon Edwards, P.E. Principal Engineer |
|
|
Anna Tapp, GIS Mapping |
|
|
|
(Ord. 4703, 6-1-16)
31.12.020 Preface.
(a) Purpose. The following is an excerpt from the Request For Proposal (RFP-3890-14-NJ):
In May of 2014, the Grand Junction City Council adopted a three to five years Economic Development Plan (EDP) for the purpose of creating a clear plan of action for improving business conditions and attracting and retaining employers. Section 1.4 of the EDP focuses on providing technology infrastructure that enables and supports private investment. Expanding broadband capabilities and improving wireless and/or cell coverage to underserved areas are key objectives of the EDP. The City has determined that the development of a Wireless Telecommunications Master Plan (WTMP) for eventual inclusion in the City’s Comprehensive Plan would be a positive step toward accomplishing those objectives.
A request for proposal (RFP) was issued by the City of Grand Junction and Mesa County which specifies several geographic study areas of interest for the WTMP.
The goal of the WTMP is to facilitate the creation of an optimized wireless telecommunications environment that is efficient, capable, and meets the long-term forecasted user requirements of the businesses, residents and visitors in the City of Grand Junction and Mesa County.
CityScape Consultants, Inc. (CityScape) was awarded the contract to develop a WTMP (hereafter referred to as a Wireless Master Plan or WMP) for the City of Grand Junction (City), Mesa County (County) and the Grand Junction Regional Communication Center (GJRCC). The WMP will serve as a general planning tool for the City, County and GJRCC. CityScape works exclusively for public agencies to address these identified concerns. CityScape specializes in developing land use strategies to control the proliferation of wireless infrastructure, affording the maximum control for local governments, while maintaining compliance with State statutes, the Telecommunications Act of 1996, Middle Class Tax Relief and Job Creation Act of 2012 and subsequent federal regulations.
The WMP is intended to balance the goals of providing good wireless network services throughout the defined study areas while minimizing the visual impacts of the telecommunications infrastructure. It is an illustrative planning tool and guide for developing planning policies for future wireless communications infrastructure. The WMP includes a framework for maximizing network coverage while minimizing the future number of new telecommunication facilities; and suggestions for design standards that will guide decisions about the siting of future communication facilities.
The WMP provides a short history on wireless telecommunications technology, an overview on network deployment practices, an inventory of existing wireless infrastructure throughout the City and County, theoretical propagation mapping, 10-year projection maps of potential future network deployment patterns and recommendations for meeting future network deployment objectives over the next 10 to 15 years.
(b) WMP Study Areas and Tasks. There are nine geographic regions identified as study areas:
• The City of Grand Junction (the 201 Service Boundary was used to approximate the boundaries of the City because of the irregular boundary created by noncontiguous annexations of property into the City limits)
• Study Area A: City of Fruita (Lower Valley), Town of Palisade, Town of DeBeque
• Study Area B: Glade Park, Gateway, Whitewater, Town of Collbran
• Study Area C: Corridors (Interstate 70 and Highway 50)
The scope of services includes the following six tasks:
• Task A: Preliminary research and data assessments.
• Task B: Infrastructure assessments; kick-off meeting; and theoretical root mean square (RMS) mapping.
• Task C: Theoretical propagation mapping based on participant responses at kick-off meeting.
• Task D: Design and development of draft master plan; draft ordinance review and amendment recommendations; and technical meeting.
• Task E: Public meetings and presentations of draft documents.
• Task F: Final documents.
(Ord. 4703, 6-1-16)
Article I. The Telecommunications Industry
31.12.030 Introduction.
Telecommunications is the transmission and/or reception of radio signals, whether it is in the form of voice communications, data, digital images, sound bites or other information, via wires or space on radio frequencies, using satellites, microwaves, or other electromagnetic systems. Telecommunications includes the transmission of voice, video, data, broadband, wireless and satellite technologies and others.
Traditional landline telephone service utilized an extensive network of copper lines to transmit and receive a phone call between parties. As the communications industry evolved, modified copper wire circuit or T-carrier (T-1) lines were developed to add capacity, bandwidth and speed to the standard copper wire line. However, copper-based technology, in any form, is insufficient to support the ever increasing service demands. With today’s technology, the only methods available to achieve the necessary bandwidth and speed for data transfer is to utilize fiber optic or microwave technology for backhaul. Backhaul is the network interconnection that links individual network nodes together through the core network backbone. The lack of fiber or microwave currently is a limiting factor for true high-speed telecommunications.
Wireless telephony, also known as wireless communications, includes mobile phones, pagers, and two-way enhanced radio systems. It relies on the combination of landlines, cable and an extensive network of elevated antennas – most typically found on communication towers to transmit voice and data information. The evolution of this technology has progressed through advances referred to as first, second, third and fourth generations (1G through 4G) of wireless deployment. Fifth generation (5G) wireless is expected to exponentially expand wireless network capacity by incorporating new transmission technologies and a wide range of frequency spectrum between 600 megahertz (MHz) and 24 gigahertz (GHz). Advanced technologies with 5G will result in much quicker download speeds for smartphones and other smart devices, and machine-to-machine (M2M) data transmission between automotive vehicles and between pieces of equipment in industries such as transportation and logistics, home health care, manufacturing and public safety.
(Ord. 4703, 6-1-16)
31.12.040 Wireless handset evolution.
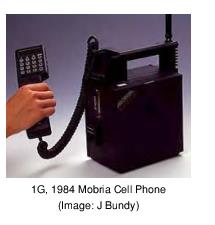 During the early 1980s, the first generation, consisting of 850 megahertz (MHz) band cellular systems, was launched nationwide. The 1G portable cell phones were boxy in shape and operated much like a small AM or FM radio station. The 850 MHz frequency (i.e., low band) allows the radio signal from the antenna on the tower to travel beyond five miles, depending on topography and line-of-sight conditions between the towers. Customers using a cell phone knew when they traveled outside of the service area because they would hear a static sound on the phone similar to the sound of a weak AM or FM radio station. The signal either faded or remained crackling until the subscriber was within range of another facility.
Originally, the 850 MHz band only supported an analog radio signal. By 2010, 1G had been phased out of network design in most urban markets, but still serves as a platform of initial coverage in remote and undeveloped areas – including large areas identified in Study Area B of Mesa County.
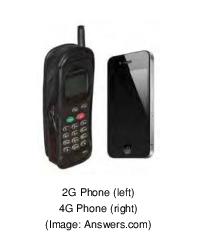
The 1990s marked the deployment of second generation technologies, consisting of the 1,900 MHz band (i.e., high band) Personal Communication Systems (PCS) and Enhanced Specialized Mobile Radio (ESMR) commonly referred to as Nextel, that operated in the 800 MHz band. Nextel and 2G cellular wireless technology was developed primarily to allow for simultaneous phone calls over a digital signal, on both 850 and 1,900 MHz, that were audibly clearer than those made with an analog signal. The handsets were much smaller than the 1G cellular phones and the first handsets provided low speed data services such as paging and limited text messaging through the handheld unit. However, 2G had some network functionality trade-offs. The technology offered a static free signal but with a higher rate of disconnects or dropped calls. The network solution to reduce the number and frequency of dropped calls required significantly more base stations and towers for several reasons: First, the propagation signal in the high band does not travel as far as the low band signal. Thus, the number of required facilities almost tripled just to provide basic 2G coverage in the same geographic area as a 1G service area. Second, the industry was reluctant to share tower space with a competitor and many service providers resisted co-locating on the same tower. And third, subscriber base and usage grew rapidly so the industry needed more sites to improve network coverage demands by their customers.
 Third generation (3G) wireless was launched in the early 2000s and offered improved mobile download speeds and increased penetration of signal strength for indoor environments. This technology also permits multimedia messaging (MMS) which increased the character limit on text messaging, allowed photo transfer and provided elementary video conferencing.
Fourth generation (4G) wireless handsets were introduced in 2010 and offered a wide variety of new tools and services that provided access to email, news, music and videos. Newer technologies incorporated better cameras for still photos and video, global positioning services (GPS), Internet commerce, and millions of downloadable applications for just about any use.
Advancing technologies in 2015 resulted in new smartphones and tablets that support video streaming and remote access to Internet-based cloud data storage both of which require large amounts of bandwidth. Service providers continue to upgrade existing networks by: 1) adding additional base stations and towers to improve and increase network capacity; 2) purchasing additional licenses in the 700, 1,700 – 1,800, and 2,100 – 2,400 MHz frequencies; 3) upgrading equipment at the towers and base stations and adding more antennas and feed lines; and 4) adding remote radio heads (RRH) on towers to increase signal strength and capacity.
One of 4Gs greatest advancements is the transition to Long Term Evolution (LTE) services as the global cellular network operating standard. Network operating platforms nationally and internationally were fractured during the implementation of 3G networks because of the adoption of Time Division Multiple Access (TDMA) and Code Division Multiple Access (CDMA) as competing operating platforms. The universal LTE and LTE-Advanced platforms will promote efficient use of spectrum, faster download speeds and continued use of smart devices across the United States and throughout the world. The need for additional 4G infrastructure is significant nationwide and the continued deployment of new towers and base stations will be necessary as the industry transitions to fifth generation (5G) networks sometime around 2019-2020.
In summary, 1G and 2G provided the initial launch of personal wireless service. Third generation improved data transfer with the addition of MMS, 4G increased speeds and capacity and 5G deployments will focus on implementation of full broadband service. Fourth generation network technology (the platform for smartphones) emphasized improving network capacity and maximizing the use of bandwidth for faster and more efficient transfers of data. Fifth generation standards are in the design phase and will be implemented when gigahertz spectrum is available and backhaul systems utilizing fiber optic networks are available. The improved network speeds and bandwidth of 5G are anticipated to be sufficient to compete directly with computer networks with average Internet download speeds at or above the 100 Megabits per second (Mbps) range. Fifth and sixth generation (5G and 6G) advancements over the next 30 years will allow all forms of communications and entertainment to be streamed resulting in the eventual elimination of digital subscriber lines (DSL) and cable/satellite TV; and will provide the underlying communication technology that will allow vehicles to drive themselves. Like all previous generations, 5G and 6G will require more wireless infrastructure.
(Ord. 4703, 6-1-16)
31.12.050 Satellite technologies.
The growth of satellite usage has surpassed the highest expectations of only a few years ago. The reason is simply lower cost. Previously, relaying information, data, and other related materials was cumbersome and required many relay stations in very specific locations and in relatively close proximity. Initially satellite use was expensive because of the limited amount of airtime that was available. Satellite airtime has become more affordable with the deployment of additional satellites, increased competition and advanced technologies that allow more usage of the same amount of bandwidth. In addition, satellite service providers are in the early stages of increasing the number of localized networks which will contribute to the already rapid growth.
Several licensees of satellite services such as Sirius XM Radio and a number of satellite telephone service providers successfully petitioned the Federal Communications Commission (FCC) to allow deployment of additional land-based supplemental transmission relay stations so that they can compete more aggressively with existing ground-based services and overcome the obstacles typical to satellite technology. Subscribers found the delay, fade and signal dropout between interactive devices to be unacceptable. Sirius XM Radio has been successful in obtaining ground-based supplemental transmitter rights and has become one of the alternative subscribers of ground-based transmitter networks.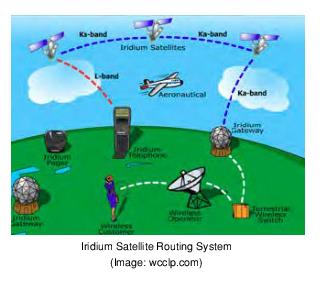
(Ord. 4703, 6-1-16)
31.12.060 Transmission equipment.
(a) On May 18, 2015, the Federal Communication Commission (FCC) announced and published notice of “The Wireless Infrastructure Report and Order”, which defines transmission equipment to be:
any equipment used in connection with any Commission-authorized wireless transmission, licensed or unlicensed, terrestrial or satellite including commercial mobile, private mobile, broadcast, and public safety services, as well as fixed wireless services such as microwave backhaul or fixed broadband.
(b) Wireless transmission equipment is comprised of four main apparatus:
(1) An electronic equipment cabinet;
(2) Feed lines;
(3) Antenna or antenna array; and
(4) An antenna support facility such as a tower or base station.
(Ord. 4703, 6-1-16)
31.12.070 Equipment cabinet and feed lines.
Electronic equipment used to transmit and receive the radio signals from the antenna is installed within an equipment facility including, but not limited to, cabinets, shelters, pedestals or other similar enclosures. Copper coaxial cable (coax) or fiber optic (fiber) feed lines are used to connect the antenna with the ground-based equipment. The equipment cabinets and feed lines shown in Figure 1 are typical for service providers operating in the high band frequencies and ground space requirement for this equipment is around 10 square feet.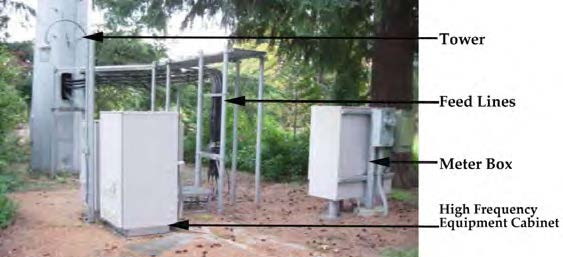
Figure 1: Example of High Band Wireless Infrastructure Ground Equipment
The electronics equipment used with low band systems generates substantial heat, so the shelters which house the ground equipment are much larger and generally need a minimum of 400 square feet. The only noise that would typically be generated in the vicinity of any tower or base station would be from an air conditioner or a backup generator that automatically starts in the event of a power failure. Figure 2 shows a typical configuration for low band ground equipment.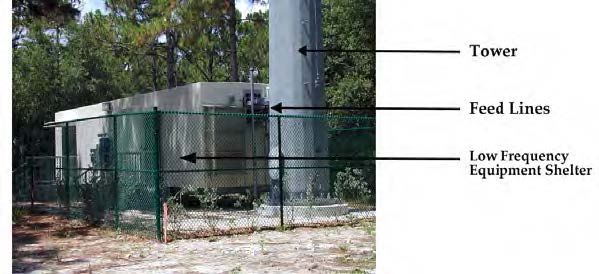
Figure 2: Example of Low Band Wireless Infrastructure Ground Equipment
(Ord. 4703, 6-1-16)
31.12.080 Antennas and antenna arrays.
Antennas are used for both transmitting and receiving signals. Examples as shown in Figure 3 include: a single omni-directional (whip) antenna that can be used to transmit and/or receive two-way radio, ESMR, cellular, Personal Communications Service (PCS), or Specialized Mobile Radio (SMR) signals. A sectionalized panel antenna array can be used for transmitting and receiving cellular, digital or ESMR wireless telecommunication signals. Each antenna or antenna array is connected to the ground equipment cabinet via a feed line.
Microwave dish antennas and fiber optics cable are used for backhaul. Backhaul is used by service providers to send the signal received by the antenna to the supporting network and vice versa. Point-to-point microwave antennas are used to provide backhaul capabilities over greater distances than are possible between the primary antennas on towers and base stations. Microwave is frequently used as backhaul throughout Mesa County to connect the towers in the urban areas like Grand Junction to towers in remote locations such as Gateway and Palisade Point.
Most service providers are now mounting a power amplifier unit on the tower close to the antenna. The top mounted amplifiers (TMA) and remote radio units (RRU) provide greater efficiencies and better service in both transmitting and receiving modes. However, these improvements come at the cost of higher visual impacts caused by the increased amount of tower-mounted equipment mounted high on the towers.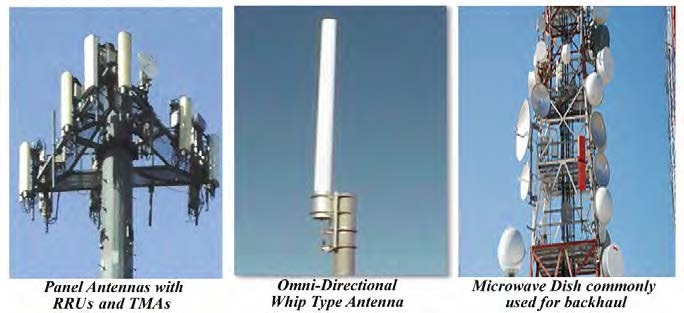
Figure 3: Examples of Panel, Directional and Microwave Antennas
(Ord. 4703, 6-1-16)
31.12.090 Transmission equipment, towers and base stations.
Antennas can be mounted on a variety of structures referred to as wireless towers or base stations. As defined in the FCC Report and Order, a wireless tower is “a structure built for the sole or primary purpose of supporting any Commission-licensed or authorized antennas and their associated facilities”. Examples of nonconcealed towers are monopoles, lattice and guy towers and shown in Figure 4.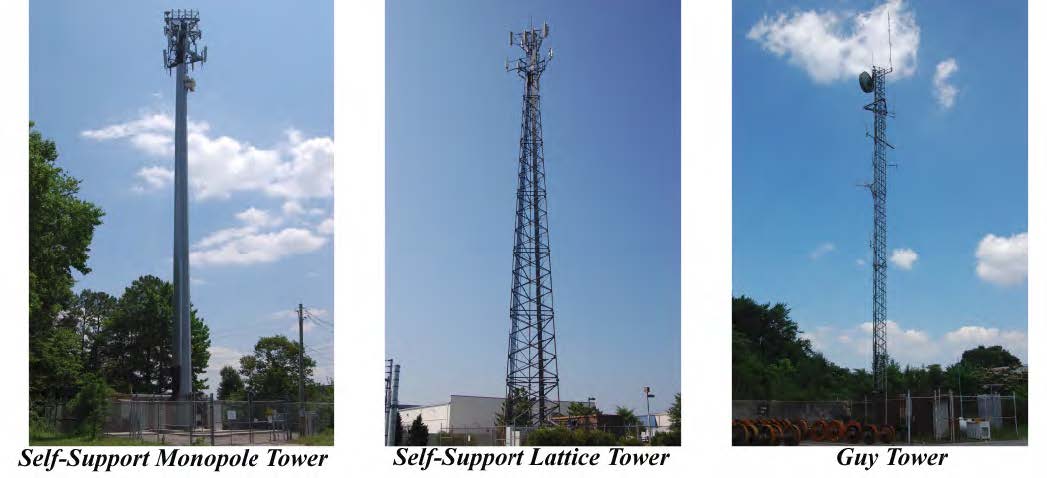
Figure 4: Examples of Nonconcealed Antenna Support Facilities
As defined in the FCC Report and Order, a base station is “equipment and non-tower supporting structure at a fixed location that enable Commission-licensed or authorized wireless communications between user equipment and a communications network”. Examples of base stations are buildings, water tanks, tall signage and light poles; provided, that (1) the structure is structurally capable of supporting the antenna and the feed lines; and (2) there is sufficient ground space to accommodate the base station and accessory equipment used in operating the network. Examples of nonconcealed base stations are shown in Figure 5.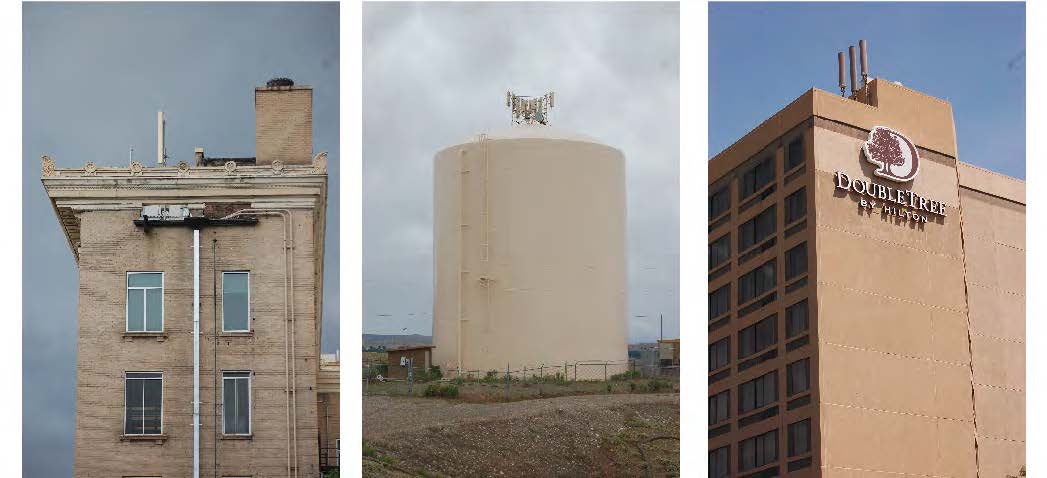
Figure 5: Examples of Nonconcealed Base Stations
(Ord. 4703, 6-1-16)
31.12.100 Concealment options.
Base stations and towers can be concealed. Antenna concealment techniques include faux dormers and chimneys, elevator shafts encasing the antenna feed lines and equipment cabinet, and painted antenna and feed lines to match the color of a building or structure. Example of base station concealment techniques are shown in Figure 6.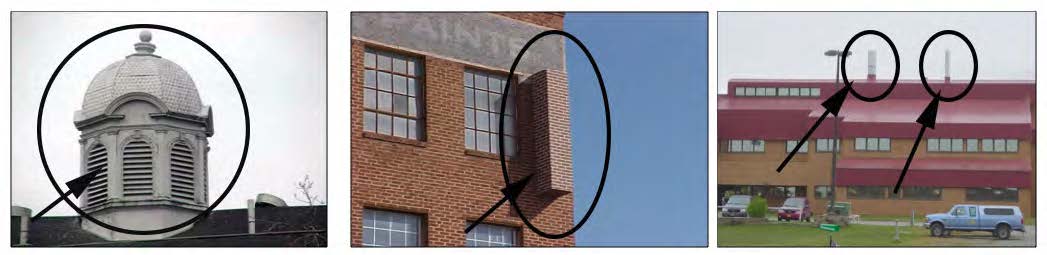
Figure 6: Examples of Antenna Concealment Techniques
A concealed tower is not readily identifiable as a wireless facility. In slick sticks, banners and flagpoles and three-legged poles the antennas are covered by fiberglass shields; and on faux trees the monopole and antennas are painted and surrounded by faux branches. Partially concealed towers include modified braces and brackets on the lattice towers and painted monopoles. Dual purpose towers include light stanchions and poles added within an existing utility tower. Figure 7 provides examples of this type of concealed infrastructure.
CityScape conducted a WMP kick-off meeting on June 30, 2015, and participants were asked for feedback on their preference for different types of infrastructure. Participants voted on the type of infrastructure they preferred to see in both rural and urban areas. The kick-off meeting presentation was made available on the City and County’s web sites and citizenry who could not attend the meeting could vote on infrastructure preferences online.
The results of the voting are shown in Table 1. In both the urban and rural areas the monopole was chosen as the most preferred nonconcealed tower type; concealed base stations are preferred over nonconcealed equipment and the use of utility poles is preferred over building a new free standing tower. Concealed dual purpose types of towers are preferred in the urban areas and slick sticks, faux trees and tower wrapping is preferred for the rural and undeveloped study areas.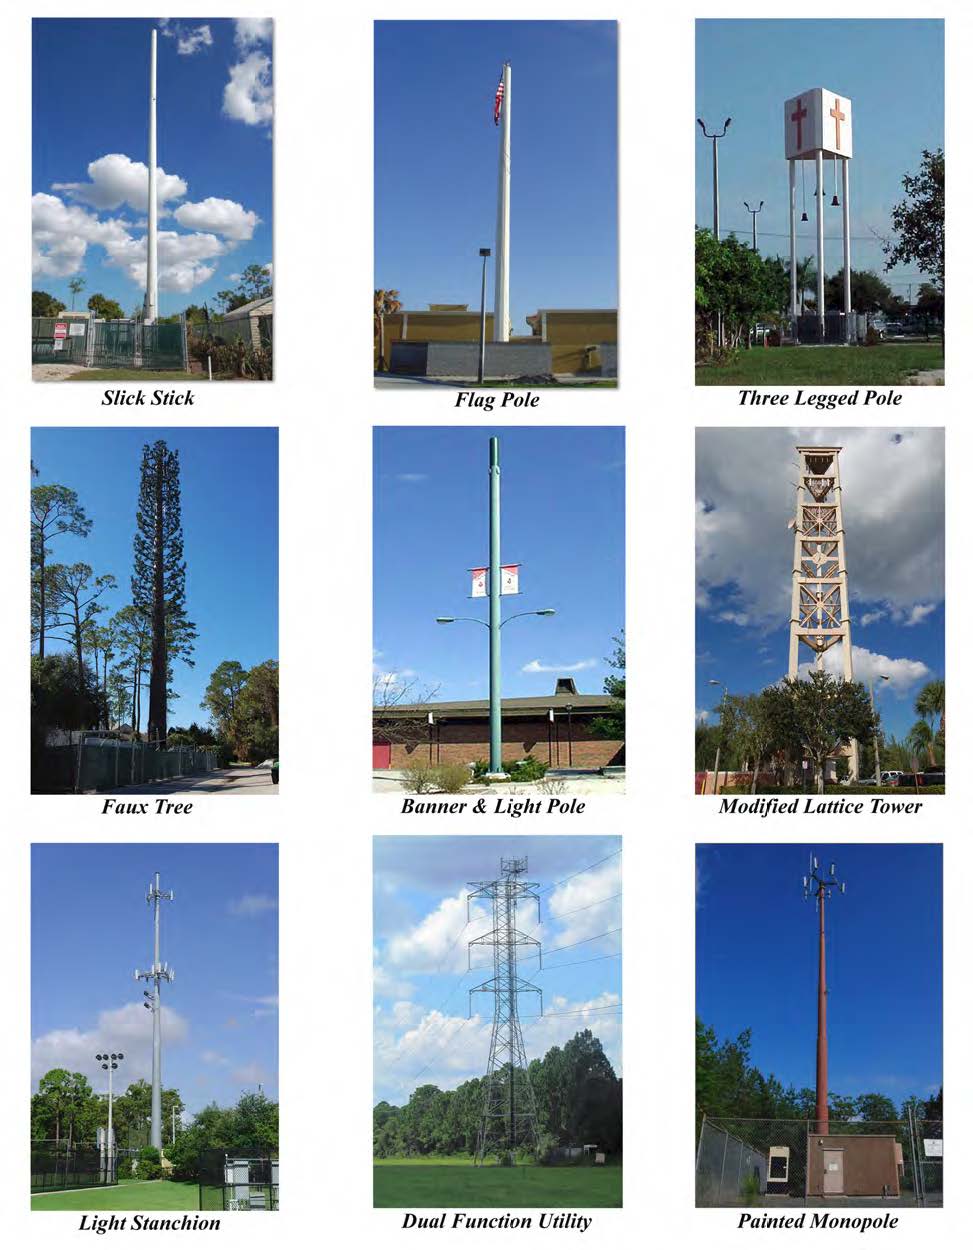
Figure 7: Examples of Concealed, Partially Concealed and Dual Purpose Towers
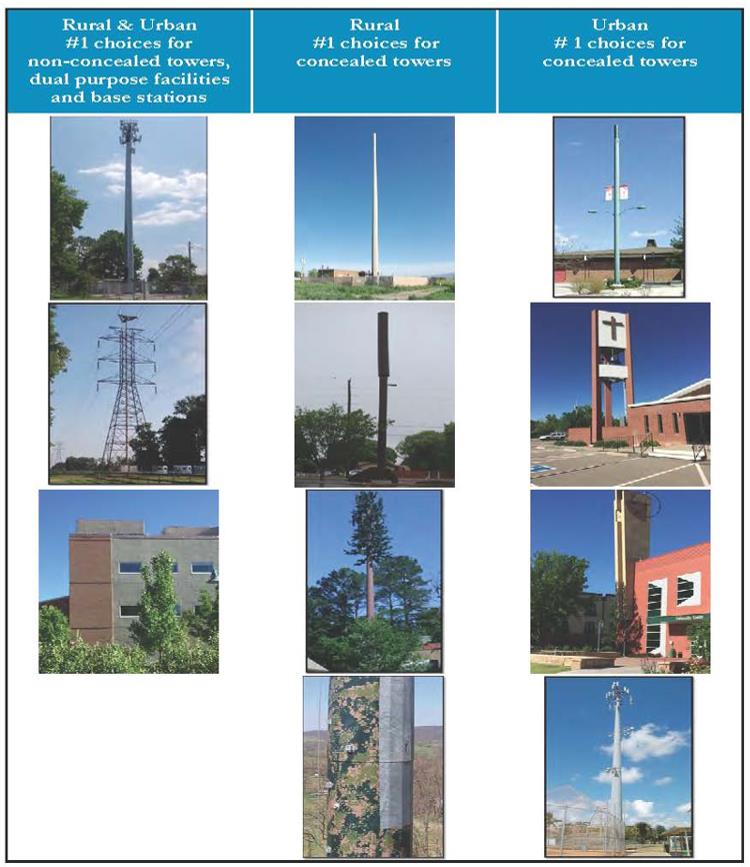
Table 1: Preferences of Types of Infrastructure
(Ord. 4703, 6-1-16)
31.12.110 Wireless infrastructure.
To design the wireless networks, radio frequency (RF) engineers overlay hexagonal cells representing circles on a map to create a grid system. These hexagons represent an area equal to the proposed tower or base station coverage area. The center of the hexagon pinpoints the theoretical “perfect location” for a tower or base station (antenna support facility). Next, coverage predictions are added from the tower or base station within the hexagon. The propagation pattern is generally circular and the size of the coverage area is affected by many variables such as antenna mounting elevation, topography, land cover, and size of the immediate subscriber base. The illustration shows a smaller coverage area in green and the largest coverage area in purple. The difference in coverage areas could be caused by the antenna mounting elevations at each site (i.e., a lower antenna mounting elevation on the tower in the green circle and a higher mounting elevation on the tower in the purple shaded circle; or differences in cell type (macro, micro, pico, distributed antenna system (DAS etc.) network capacity or topography. The grid system models are unique to each service provider and maintained by each individual wireless provider’s engineering department.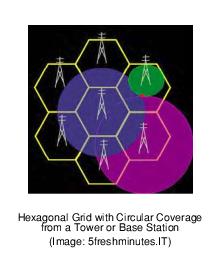
(Ord. 4703, 6-1-16)
31.12.120 Antenna network capacity.
The number of towers and/or base station sites located in a network grid not only determines the extent of geographic area covered, but also determines the number of subscribers (customers) the system can support at any given time. Each provider is different, but a given provider can only process or turn over a certain number of calls per minute and only a certain number of calls can occur simultaneously. These limits on service availability are referred to as network capacity. As local wireless customers, tourists and other users of applications increase, so does the need for network capacity. When the network capacity reaches its limit, a customer will usually experience a degradation of service such as a dropped call, a delayed text message or prolonged timeframe to access the results of an application request.
As the wireless network reaches design network capacity, it causes the service coverage area to shrink, further impacting wireless service objectives. Network capacity can be increased several ways. The service provider can shift channels from an adjacent site, or the provider can add additional towers and base stations with additional infrastructure.
A tower added to provide additional capacity in an area that already has network coverage is referred to as a “capacity tower.” A capacity tower or base station provides additional calling resources that enhance the network’s ability to serve more wireless phone customers within a specific geographic area. An assumption behind the capacity tower or base station concept is that an area already has plenty of radio signal propagation from existing coverage towers or base stations and the signals are clear. Too many calls sent or received through the existing towers or base stations result in “no service” indicators for subscribers who attempt to place a call.
According to a CTIA-The Wireless Association® indices report dated June 2014, the number of wireless devices deployed now exceeds the population of the United States. This does not mean that every person has a cell phone; rather, many people will have more than one wireless device. For example, many people have both a smartphone and a tablet. Subscriber density for 3G and 4G coverage areas determines how far apart towers and base stations can be without impacting service. Current network design standards, based on local wireless penetration rates and usage, say that each site should handle between 1,750 and 2,500 devices. As the number of wireless devices increases in a given service area and as the amount of high bandwidth applications (i.e., streaming video) usage increases, coverage areas shrink and the number of subscribers must also be reduced by service providers to avoid overloading their systems.
Wireless broadband is the transmission of high-speed wireless data over the same medium that was previously only intended for voice communications. It is not limited to smartphones and tablets. It can also be for computers, laptops and other wireless devices. The FCC recently revised the definition of “broadband” to mean Internet access with download speeds of at least 25 Mbps and upload speeds of at least three Mbps. Because of this revised standard there are few wireless service providers that can effectively meet these speeds today. Many wireless broadband providers today do not meet this revised standard. For purposes of this discussion, the term “broadband” will also encompass current technologies that do not quite meet the new standard today. The 3G and 4G wireless deployments added the capability of wireless data networks, now including the 700 and 2,400 MHz frequencies, but many service providers are using their designated voice channels for broadband.
Wireless services are in a rapidly changing industry. Newer wireless handsets (smartphones) can communicate via voice (phone) and via the Internet using Voice over Long Term Evolution (VoLTE). Some service providers such as Clearwire and other smaller regional companies provide wireless data/Internet, but not traditional voice service to its subscriber base as an alternative.
The infrastructure for wireless broadband is similar to that used for wireless phone service: a separate elevated antenna for each service provider. The area covered by one antenna shrinks in order to maintain an acceptable download speed for customers in the area resulting in the need for more wireless infrastructure to cover the same geographic area. For example, the number of tower sites needed to cover an area of approximately five square miles in Mesa County depending on the network technology used and during maximum usage periods is:
|
• |
1G – Analog (1 site) |
|
• |
2G – Digital TDMA (3 sites) |
|
• |
3G – CDMA/Email/MMS (5 sites) |
|
• |
4G – Smartphones/LTE/AWS (8 sites) |
(Ord. 4703, 6-1-16)
31.12.130 Conclusions.
Wireless handsets used for personal wireless services have changed significantly from the initial launch of cellular phones in the 1980s. The traditional infrastructure that serves as the network backbone for these handsets has not changed nearly as much from a visual perspective. The wireless networks still need elevated antennas that are above tree lines, rooftops and any manmade or natural obstructions to transmit and receive communication signals between wired and wireless devices. Moisture contained within foliage absorbs and refracts the signal and creates an unpredictable propagation variable. This will always be a factor when designing wireless systems as the propagation characteristics do not change within the current transmission standard. Wireless antennas can function below the tree line but not at the same performance level when compared to antennas placed above the tree line at the same location. For this reason, the industry will continue to prefer placement of their antenna arrays above the tree line or in a favorable location with few manmade obstructions to achieve optimal propagation from the infrastructure and maximize their investment in the communities they are servicing. The antenna sizes used have changed minimally over the years. Recent inclusion of remote radio heads and tower-mounted amplifiers on the antenna mounting structure will generally result in larger and more complex antenna arrays as compared to the earlier 2G and 3G installations.
The structures on which the antennas are mounted have changed very little, other than generally becoming shorter. The monopole and lattice towers remain the most widely used tower infrastructure nationwide. Concealment techniques continue to be used to mitigate the visual impact of towers in areas identified by local governments as a concern.
Mergers and acquisitions (such as Cingular and AT&T, Sprint and Nextel, T-Mobile and MetroPCS) bring about a temporary downsizing and consolidation of infrastructure by combining electronic resources at existing sites and by enabling the reuse of the same frequencies more efficiently. Overall the industry will continue to need more infrastructure for the transition to 5G and beyond.
(Ord. 4703, 6-1-16)
Article II. Master Plan Development
31.12.140 WMP design process.
The WMP evaluates wireless coverage throughout the nine study areas by:
• Identifying, assessing, cataloguing and mapping exiting transmission equipment; and
• Designing an engineered search radii template and applying it over the jurisdictional boundary of the City and County to evaluate theoretical build-out conditions; and
• Forecasting future infrastructure needs based on the status of the existing deployments’ population trends and gaps in network coverage.
(Ord. 4703, 6-1-16)
31.12.150 Existing transmission equipment, stakeholders and inventory.
Prior to the granting of the cellular licenses in 1980 for the first phase of deployment, the United States was divided into 51 regions by Rand McNally and Company. These regions are described as Metropolitan Trading Areas (MTA). The spectrum auction conducted by the Federal Government for the 1,900 MHz bands for 2G (PCS) further divided the United States into 493 geographic areas called Basic Trading Areas (BTA). Mesa County (including all incorporated and unincorporated areas) is located in the “Denver” MTA (a.k.a. MTA 22) and the “Grand Junction, CO” BTA (a.k.a. BTA 168). Service providers acquire the rights to deploy their networks by service area and range of spectrum frequency.
Per Section 704 of the Telecommunications Act of 1996, all service providers will require uninterrupted and continuous handoff service throughout the City and County. There are 11 known service providers that will each want to compete for the subscriber base in and around the City of Grand Junction and Mesa County. Each of these wireless voice and data providers will need towers and/or elevated antenna mounting locations to improve network coverage and capacity that will result in an ongoing need to deploy more infrastructure, especially in areas of greater residential density.
The following service providers have purchased licenses to serve all incorporated and unincorporated areas of Mesa County in the lower frequency ranges of 700 – 900 MHz: AT&T; Access 700, LLC, Dish, T-Mobile, Union Telephone (Union Cellular) and Verizon Wireless. Personal Communications Services (PCS) licensees and service providers for wireless phone and broadband operating in the higher frequencies of 1,700 – 2,700 MHz bands include: AT&T Wireless, Atlantic Wireless, Cleartalk, Clearwire Spectrum Holdings III, LLC, Commnet Wireless, LLC, Leaco Rural Telephone Cooperative, Inc., Sprint, T-Mobile and Verizon Wireless.
Most network service providers do not own the antenna mounting structure on which they attach their equipment. Tower companies typically construct and own the monopole, lattice or guyed towers and lease space on the towers to service providers. A service provider may also contract with a tower builder to construct a tower in a particular location and once the facility is constructed lease space on the newly constructed tower from the tower owner. Throughout Mesa County there are a number of tower companies who own and lease their vertical real estate to the service providers including American Tower Corporation (ATC), Crown Castle International (CCI), The Leasing Company, SBA and others.
(Ord. 4703, 6-1-16)
31.12.160 Existing antenna locations.
(a) Tasks A and B of the scope of services include research to gather antenna and tower location data in order to develop initial transmission equipment location base maps. The City and County GIS Departments provided some existing facility locations to CityScape. Additional infrastructure locations were obtained by CityScape from tower owners and various databases including the FCC’s database. Once the sites were mapped, each site was individually assessed and validated for:
(1) Physical location of existing telecommunications facilities currently within the defined study areas;
(2) Type of infrastructure;
(3) Ownership of the infrastructure; and
(4) Potential for future provider equipment co-location on the existing structures.
(b) The assessment included an in-person visit to each of the transmission equipment locations. While there are many types of antennas used for a variety of communication purposes throughout the defined study areas (dispatch, wifi hot spots, broadcast etc.), CityScape generally only included infrastructure sites in the inventory that met the following criteria:
(1) Towers and base stations that currently support wireless and/or cell coverage and broadband infrastructure as referenced in the EDP;
(i) Personal wireless service facilities (PWSF) meaning any staffed or unstaffed location for the transmission and/or reception of radio frequency signals or other wireless communications, including commercial mobile services, unlicensed wireless services, wireless broadband services, and common carrier wireless exchange access services as defined in the Telecommunications Act of 1996, and usually consisting of an antenna or group of antennas, transmission cables, feed lines, equipment cabinets or shelters, and may include a tower. The following developments shall be deemed a PWSF: new, replacement, or existing towers, public towers, replacement towers, co-location on existing towers, base station attached concealed and nonconcealed antenna, concealed towers, and nonconcealed towers (monopoles, lattice and guyed);
(2) Towers and base stations with microwave dish antenna because of their potential to promote co-location;
(3) Broadcast towers because of their potential to promote co-location; and
(4) Towers in remote locations because of their potential to either promote co-location or to be reconstructed to accommodate future co-locations.
(c) The wireless infrastructure assessment identified 142 existing transmission equipment sites that meet the prescribed criteria within the nine study areas. Also included in the assessment are 10 sites within a 1.5 mile perimeter of the County boundary. These locations were included because their signals may affect service within the defined study area. Fifteen sites contain multiple towers so the number of towers exceeds the total number of sites.
(d) Table 2 provides a summary of the total number of types of antenna mounting structures found throughout the study areas and Table 3 identifies the ownership of the infrastructure as of January 2016.
|
TYPE OF INFRASTRUCTURE |
TOTAL |
|---|---|
|
Lattice Tower |
69 |
|
Guyed Tower (includes 2 guyed monopoles) |
47 |
|
Base Station (rooftop or water tank) |
16 |
|
Monopole Tower |
14 |
|
Concealed |
6 |
|
Self Support |
5 |
|
Wood Pole |
4 |
|
Approved But Not Constructed |
4 |
|
TOTAL |
165 |
|
INFRASTRUCTURE OWNER |
TOTAL |
|---|---|
|
Others (independent tower owners and/or local businesses) |
46 |
|
Other Government Agencies (City, County, State, BLM, DOI) |
17 |
|
Broadcast Companies |
20 |
|
SBA |
19 |
|
Unknown |
19 |
|
American Tower Corporation |
7 |
|
Crown Castle International |
5 |
|
Verizon Wireless |
5 |
|
The Leasing Company |
3 |
|
AT&T |
2 |
|
TOTAL |
142 |
(Ord. 4703, 6-1-16)
31.12.170 Search area within proposed coverage areas.
Wireless location search rings are usually calculated to be circles approximately one-quarter of the radius of the proposed cell. In practice it is fairly simple to determine whether the calculated search ring radius is reasonable. The distance from the closest existing site is determined then halved and a handoff overlap of about 20 percent is added. One fourth of this distance is the search ring radius. Generally, in areas where signal coverage is the objective, taller towers allow the antenna to service a larger geographic coverage area and provide more potential for equipment co-locations by other service providers. Shorter tower heights limit the geographic coverage area and reduce the number of possible co-locations resulting in a greater number of towers required within each search ring.
The search area or search ring for new wireless infrastructure is part of a package provided to a site search consultant who looks for property that can be leased to accommodate the required wireless antenna and related infrastructure, whether that be a new tower, a rooftop or other existing structure. From an engineering perspective, any location within the search ring is considered to be acceptable to the provider after considerations are made for terrain and sometimes population distribution. The relative location of the selected property to the ideal location within the search ring will dictate the required antenna height.
(Ord. 4703, 6-1-16)
31.12.180 Search area radii.
Search ring calculations for the low and high band frequencies are shown in Tables 4 and 5. The tables utilize the “Okumura-Hata” propagation path loss formula for low band, and the “COST-231” formula for high band. Maximum coverage radii for typical in-vehicle coverage is calculated for various tower heights, reduced by 20 percent to account for a reasonable handoff zone, then divided by four to obtain a search ring radius for each tower height. For example, according to the information in the following tables, a low band antenna mounted at the 100-foot elevation would have a search ring radius of 0.72 miles, and a radius of 0.36 miles for high band antennas.
|
ANTENNA MOUNTING HEIGHT |
50' |
100' |
115' |
150' |
|---|---|---|---|---|
|
Radius, miles |
2.53 |
3.6 |
3.88 |
3.91 |
|
Allow for handoff |
2.03 |
2.88 |
3.1 |
3.6 |
|
Search ring, miles |
0.51 |
0.72 |
0.78 |
0.9 |
|
ANTENNA MOUNTING HEIGHT |
50' |
100' |
115' |
150' |
|---|---|---|---|---|
|
Radius, miles |
1.33 |
1.82 |
1.95 |
2.32 |
|
Allow for handoff |
1.07 |
1.46 |
1.56 |
1.79 |
|
Search ring, miles |
0.27 |
0.36 |
0.39 |
0.45 |
*Tables 4 and 5 represent theoretical predictions and each facility will vary somewhat from these estimates.
(Ord. 4703, 6-1-16)
31.12.190 Tower height and antenna mounting elevation considerations.
Taller structures (towers, rooftops, and water tanks) may offer more opportunity for co-location which could theoretically decrease the number of additional towers and antennas required in an area, but capacity issues may overcome the advantage of the taller structure. Each potential structure must be subjected to a radio frequency (RF) engineering review to determine the extent to which height will increase co-location opportunities. In geographic areas where there is a large wireless phone subscriber base or terrain concerns, build-out plans may require lower antenna mounting elevations. Antennas located at higher points on the support facility are more common in rural areas. In some cases, wireless providers limit the antenna placement height in more populous geographic areas because they need multiple antennas installed at differing heights on a single tower to target specific locations or to reduce the potential for interference with other equipment on the structure.
CityScape is often asked to estimate how many towers and base stations it will take to cover a particular geographic area. Because of the number of factors that might affect the coverage for a given service provider, CityScape uses theoretical root mean square (RMS) maps to help the client visualize the number of antenna locations that may be necessary to provide wireless communications coverage for a given geographic study area. This hypothetical network identifies the minimum number of tower or base station locations required for one service provider to provide complete coverage without any considerations for terrain, vegetative cover or subscriber base.
One of the key variables affecting the theoretical coverage analysis is the assumed height of the antenna on the tower or structure. CityScape reviewed the existing tower inventory and applicable height regulations for the City and County and determined the average tower height of the towers used for wireless telecommunications purposes to be around 118 feet. Therefore, the antenna mounting elevation of 118 feet was chosen for the development of the theoretical RMS coverage maps.
According to the Okumura-Hata propagation path loss formula coverage for low frequency (i.e, 800 MHz), a reasonable coverage area for an antenna mounted for cellular deployment at 118 feet on flat terrain is about 3.88 miles from the antenna. Referring to the “COST-231” formula for 1,900 MHz a reasonable coverage area for an antenna mounted at 118 feet for a high band site on flat terrain is approximately 1.95 miles. The coverage reduction from 3.88 miles to 1.95 miles reflects the variable change from low to high band frequency.
Figures containing the theoretical maps for both low and high band frequencies, for each study area, can be found in Article III of this chapter, Study Areas.
(Ord. 4703, 6-1-16)
31.12.200 Inventory mapping.
Mapping the existing antenna sites creates a base map from which observations and analysis can be derived relative to current and future deployment patterns. Generally, most of the wireless infrastructure in Mesa County is located within and around the more urban study areas, particularly the City of Grand Junction, Lower Valley, Palisade, DeBeque and the I-70 corridor. Whitewater is the only rural study area with a larger concentration of infrastructure because of the Highway 50 corridor and the larger subscriber base in that area. Minimal or no wireless network coverage was found for the undeveloped areas within the County’s zoning jurisdiction.
Maps of the existing and proposed tower infrastructure and a site data table are provided in Article III of this chapter, Study Areas, for each individual study area. A complete listing including photographs of the verified infrastructure is provided in the January 16, 2016, inventory document.
(Ord. 4703, 6-1-16)
31.12.210 Theoretical composite coverage from existing antenna locations.
The next step in the network evaluation process is to examine the coverage from all known antenna locations to identify gaps in network coverage. For the purposes of this WMP, CityScape has chosen to use theoretical composite propagation modeling.
Propagation modeling is a process that uses mapping techniques to illustrate the expected level of cellular coverage theoretically provided from one or more antenna sites, based on reliable service factor most of the time. Relative signal strength is displayed in color bands to illustrate the anticipated coverage provided by each antenna. Signal strength, in this application, is a term used to approximate the level of operability and quality of service of a wireless device. The stronger the signal at the mobile device the better functionality it will have. A reduced signal lessens the quality of the call or data usage and can result in dropped calls, lack of or slow connectivity or frozen video. Distance between the mobile device and facility, intervening obstructions such as trees or buildings, and whether or not the subscriber is indoors or outside are all significant factors that affect signal strength and quality of service.
The level of propagation signal strength is shown for low band services in yellow and high band services in blue. These colors represent a generally acceptable and reliable signal level for indoor use for both low and high bands of service. Indoor usage is used as the lowest acceptable service threshold due to the signal loss that occurs from building penetration when compared to in-vehicle or outdoor pedestrian usage. Generally, the closer the mobile device is to the antenna, the more reliable and acceptable the service. The further the mobile device is from the antenna, and the closer it is to the edge of coverage, the more prone it is to service degradation when cellular usage on the tower becomes saturated or environmental conditions vary.
Theoretical composite propagation maps include terrain, vegetative cover, and current population density variables in the coverage calculations. The antenna mounting elevation is assumed to be at the highest mounting elevation of towers and base stations where the heights are known and at the average height of 118 feet for structures of unknown height. The resulting composite maps are included in the analysis provided in Article III of this chapter, Study Areas.
(Ord. 4703, 6-1-16)
31.12.220 Network capacity, wireless network planning and future tower site projections.
Service providers use base population estimates and subscriber data to design their network, to decide how many antennas are needed and to determine how far apart antennas should be located. Depending on the number of wireless subscribers connected to a given antenna (i.e., the local wireless penetration rate) and each device’s usage, a given site has the capacity to provide service to between 1,750 and 2,500 devices. As the number of wireless devices increases and/or usage increases (particularly for more data intensive applications like social media, music and video streaming), the geographic area covered by the antenna decreases and the number of subscribers served by the facility must be reduced into order to avoid overloading the system and impacting data transfer speeds. Based on the expected increases to both subscriber rates and usage over the next 10 years, the current facility design model of 1,750 to 2,500 devices per site will shrink to between 500 to 1,200 devices per site, depending on the provider, services offered, and the number of overall subscribers. Because of this shrinkage, the number of towers and base stations needed to provide coverage to the same geographic area will increase dramatically over the 10-year period covered by this study.
The shrinkage in propagation signal pattern resulting from projected technology changes, increases in subscribers, and the usage demand caused by new applications is shown in a second set of composite maps included in Article III of this chapter, Study Areas. These maps illustrate how the network coverage patterns for a single high frequency service provider are expected to shrink over the next 10 to 15 years.
The resulting areas with no service, gaps in service, and average/acceptable service are also areas of particular planning interest in the coming years. Comparing the current coverage maps with the 10-year projection in undeveloped areas shows minimal change in future demand. However, comparing maps in more urban areas shows that coverage gaps will become larger if the network infrastructure is not expanded. The resulting geographic areas with marginal to no service are of particular planning concern over the next 10 to 15 years.
(Ord. 4703, 6-1-16)
31.12.230 Estimation of future antenna sites.
CityScape has estimated, by study area, the number of sites that may be needed for planning purposes over the next 10 to 15 years. The estimates are based on calculations taking into account expected changes in population density, subscriber base and usage, daily transient movement through the given study area and how many calls a tower or base station may simultaneously serve at any given time. The projections include coverage, capacity, and broadband network objectives and take into account the variables of terrain, population and proposed maximum infrastructure height variables. The projection model includes all known existing antenna support structure locations (towers, rooftops, tanks and broadcast towers) for maximum co-location efficiency that reduces the number of new towers required within a given geographic area. These projection maps are also provided in Article III of this chapter, Study Areas.
While the launch date of 5G is unknown, it will happen within the next 10 years and will provide true high-speed data transfer rates in excess of today’s broadband download standard of 25 Mbps. With wireless broadband speeds available on 5G networks, most all types of communications (from voice to computer data) and entertainment (from cable/satellite TV and radio to first run motion pictures) will be available over wireless systems. Few new sites will be built to provide new coverage but to resolve over-capacity issues in an area currently served. Since 5G networks will utilize frequencies much higher than today’s 4G networks, coverage areas will be more compressed around the antenna source. Most new towers will be built to place antennas close enough to the end user to deliver the high frequency and high bandwidth speeds needed to meet broadband demands.
Construction of the new sites needed to keep up with advancing technologies and customer demand is not expected to happen evenly throughout the study area. However, over the next 10 to 15 years the cities and County should anticipate that up to 40 new tower or base station sites will be needed. The more populated areas will likely see the development of “small cell” sites. Small cells are individual “nodes” that typically consist of concealed antennas located relatively close together on shorter tower or support structures. For example, small cells can be added to existing light posts and placed every few hundred feet, or may be concealed on shorter buildings. There are many options for small cell design that allow this infrastructure to be connected to form a “mini network” that can handle the high capacity required in the more urban areas.
The cities and County can easily anticipate five to eight co-locations, upgrades or antenna modifications (in any combination) per year over the next 10 years based on expected changes in population density, subscriber base and usage, transient movement through the City and County and how many calls a tower or base station can simultaneously serve at any given time.
(Ord. 4703, 6-1-16)
Article III. Study Areas
31.12.240 Study areas.
(a) The City of Grand Junction and Mesa County, on behalf of the Grand Junction Regional Communication Center (GJRCC), entered into an agreement with CityScape Consultants in May, 2015 to develop a Countywide WMP. CityScape used a three-step process to evaluate wireless coverage and develop a plan.
(1) Identify, assess, catalogue and map existing transmission equipment; and
(2) Design an engineered search radii template and apply it over the jurisdictional boundary of the cities and County to evaluate theoretical build-out conditions; and
(3) Forecast future infrastructure needs based on the status of the existing deployments, population trends, and network coverage gaps.
(b) Nine study areas were identified across the County and detailed analysis was completed for each area creating, in effect, nine mini WMPs which are presented in this article. The nine study areas are shown in Figure 8 and defined and grouped as follows:
(1) Study Area A includes the population centers and surrounding areas of the County:
(i) City of Grand Junction/Persigo 201 Boundary (City of Grand Junction, Appleton, Horizon, Northwest, Orchard Mesa, Pear Park and Redlands);
(ii) Lower Valley (City of Fruita, Fruita Buffer, Loma, Mack, and Lower Valley);
(iii) Palisade (Town of Palisade, Clifton, Palisade Buffer/East OM);
(iv) DeBeque.
(2) Study Area B includes four large, mostly unincorporated areas that receive significant tourists and local traffic:
(i) Glade Park;
(ii) Gateway;
(iii) Whitewater;
(iv) Collbran (Collbran, Plateau Valley, Mesa, Powderhorn).
(3) Study Area C includes the major highway corridors:
(i) I-70 Highways;
(ii) Highway 50;
(iii) Highway 330;
(iv) Highway 65;
(v) Highway 141;
(vi) Unaweep/Uncompahgre.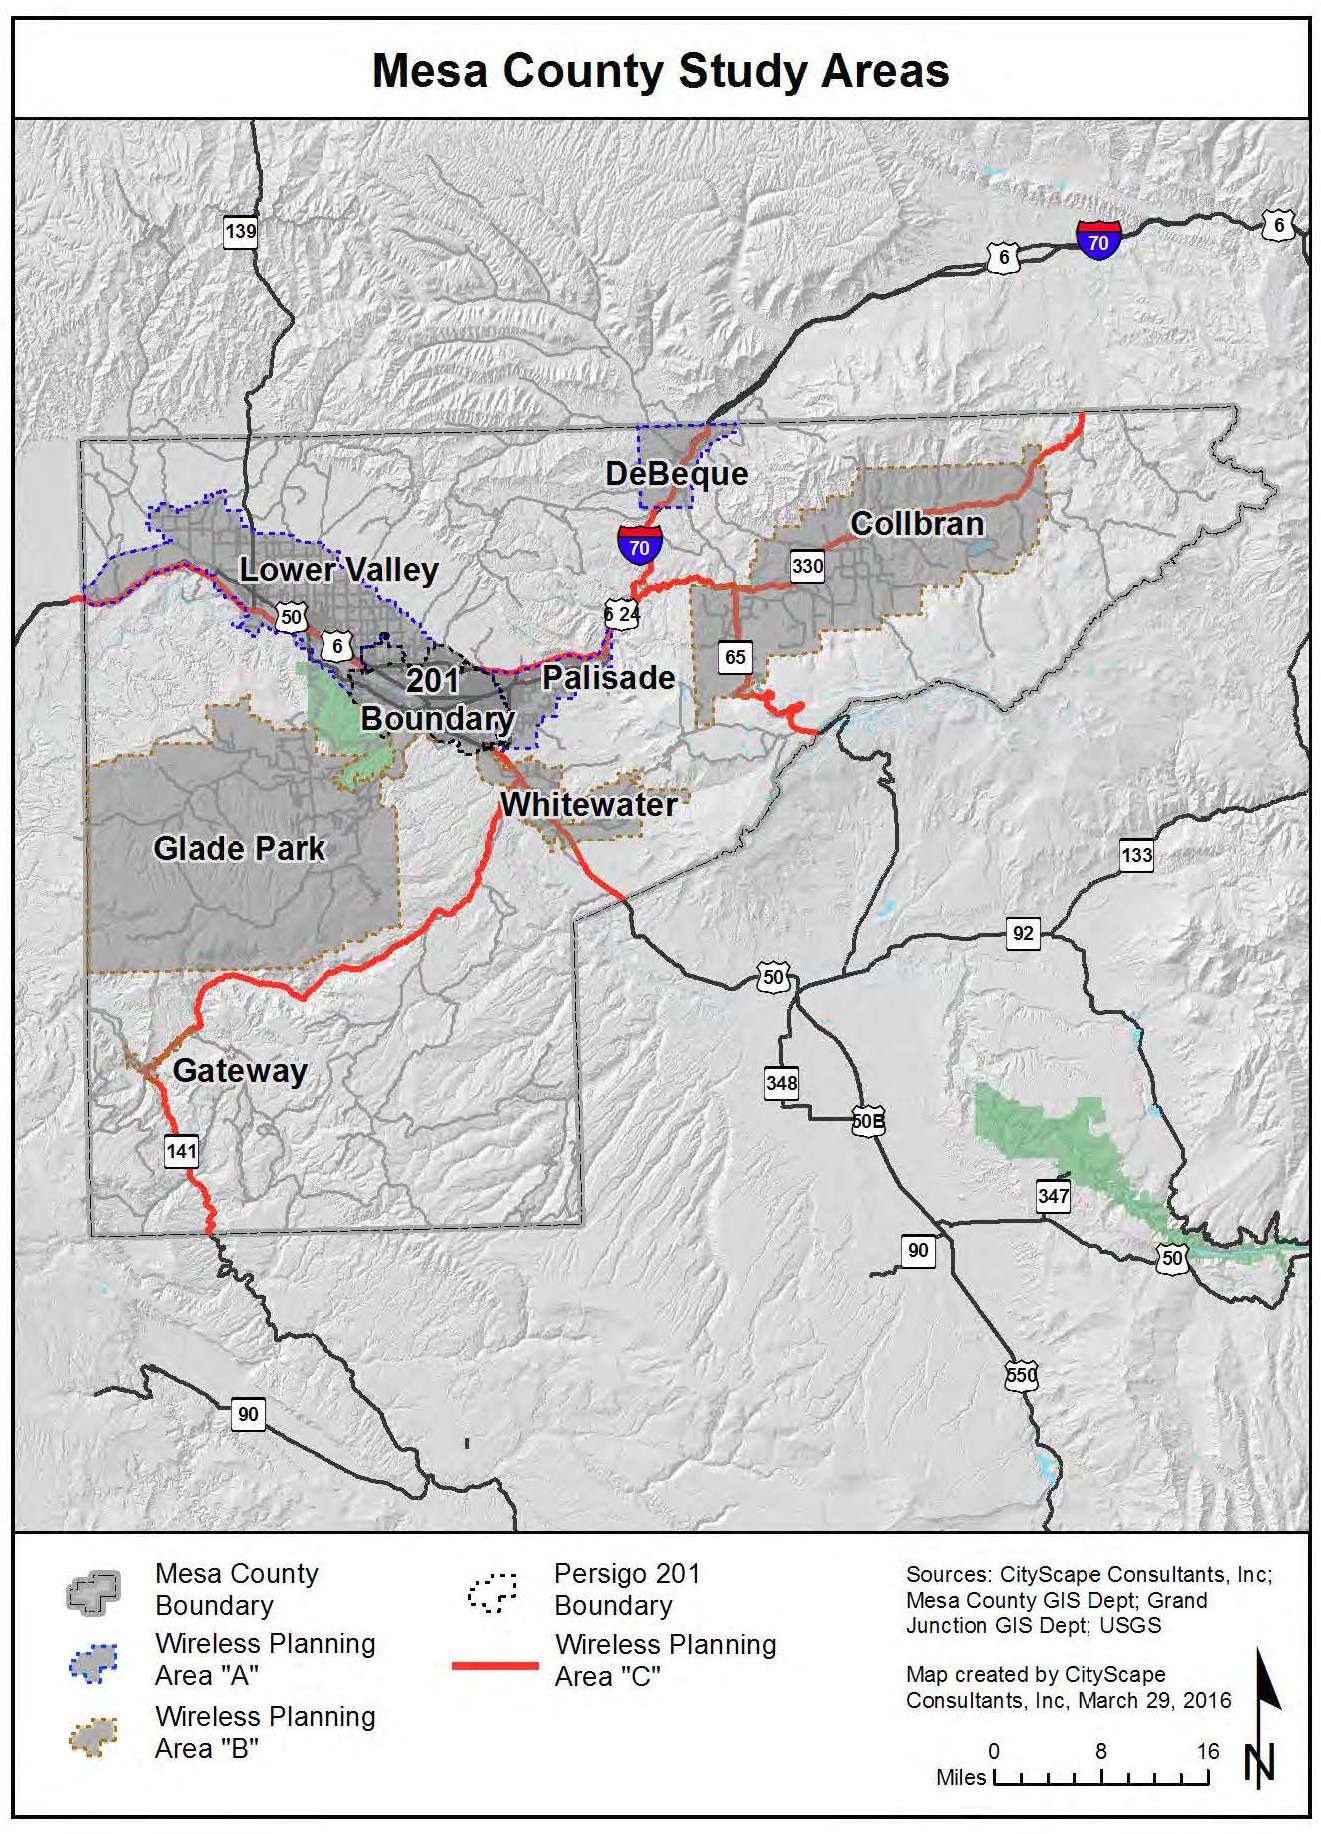
Figure 8: Study Areas
(Ord. 4703, 6-1-16)
31.12.250 PWSF inventory, analysis and mapping by study area.
Countywide, CityScape identified 142 existing transmission equipment sites and 165 towers or base stations that either currently support PWSF installations (i.e., cellular services) or have the potential for supporting PWSF in the future. Some sites have more than one facility. The Wireless Infrastructure Inventory is included as an appendix to the Master Plan. CityScape recommends that the inventory be updated as facilities are added or modified.
Most of the current wireless infrastructure is located within and around the more urban areas of the County; Grand Junction, Palisade, Fruita and the Interstate corridor have the largest concentrations of infrastructure because of the larger subscriber bases in those areas. The more rural and undeveloped areas have minimal or no infrastructure. Table 6 identifies the number of sites that are located within each study area, plus sites within 1.5 miles outside (out) of the study area that may also provide coverage. The “Projected Fill-In” column indicates the number of additional sites that would be needed in each study area to provide best-case coverage, while the “Estimated Build-Out” column shows the number of sites that are more realistically predicted to be built.
|
Study Area |
Existing Sites |
Projected Fill-In (10-15 Years) |
Estimated Build-Out (Including Public Safety) |
|
|---|---|---|---|---|
|
In |
Out |
|||
|
City of Grand Junction/201 Boundary |
50 |
5 |
11 – 18 |
11 – 18 |
|
Lower Valley |
10 |
11 |
7 |
4 |
|
Palisade |
4 |
8 |
6 |
6 |
|
DeBeque |
2 |
0 |
3 |
1 – 3 |
|
Glade Park |
0 |
29 |
9 |
1 – 4 |
|
Gateway |
0 |
3 |
3 |
1 |
|
Whitewater |
5 |
1 |
4 |
2 – 4 |
|
Collbran |
4 |
39 |
15 |
2 – 4 |
The current infrastructure inventory and theoretical coverage mapping is provided for each study area in this article. Theoretical composite propagation modeling was used to determine the potential coverage of all existing antenna locations. Then, Geographic Information Systems (GIS) mapping techniques were used to factor in terrain, vegetative cover, and population density to create a more realistic coverage model. Next, CityScape used current and projected population data through 2030 (from the 2010 U.S. Census; Colorado State Demography Office; Regional Transportation Planning Office; and Mesa County) to illustrate the impact that future growth would have on network coverage. Finally, by adding in projected changes related to technology improvements and population growth, CityScape was able to estimate future infrastructure needs for each study area over the next 10 to 15 years. The following pages include the “mini master plans” for each study area.
(Ord. 4703, 6-1-16)
31.12.260 City of Grand Junction characteristics.
(a) Urban.
(b) 63.79 square miles.
(c) 2010 population estimate 102,277.
(d) 2030 population estimate 137,145.
(Ord. 4703, 6-1-16)
31.12.270 City of Grand Junction theoretical root mean square maps.
Given the checkerboard effect on the city limits created when noncontiguous properties are annexed from the County into the City of Grand Junction, the Persigo 201 Boundary area was selected as the study area that best reflects the geographic area for the City. Throughout this document, the Persigo 201 Boundary is used interchangeably with the City of Grand Junction to identify the area generally corresponding to the City of Grand Junction.
Figures 9 and 10 represent a theoretical build-out of equally distributed antennas, mounted at a tower height of 118 feet, in a perfect radio frequency environment for a single service provider that excludes topographic, vegetative cover and population density considerations. The black dot within each larger circle indicates the ideal antenna location. The smaller circle within the larger circle represents the acceptable search ring for locating the tower and antennas.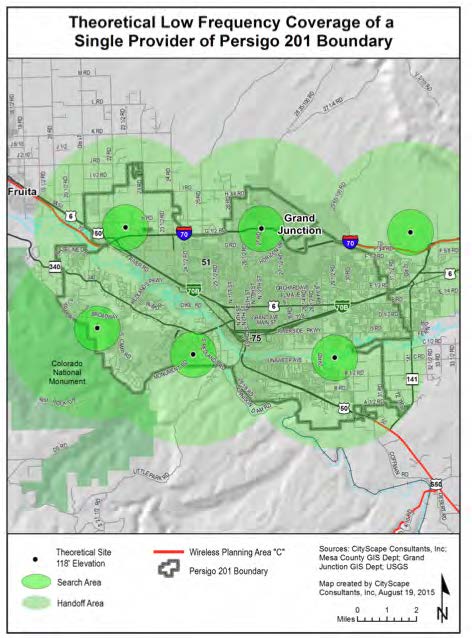
Figure 9: Theoretical Low Frequency Coverage
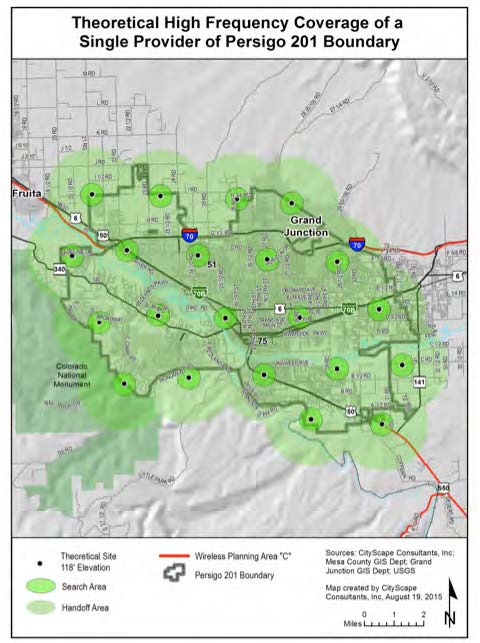
Figure 10: Theoretical High Frequency Coverage
Figure 9 illustrates that six towers or base stations equally distributed throughout the 201 Boundary would provide complete low frequency coverage to the defined study area. Figure 10 illustrates that 21 locations would be needed to provide complete high frequency coverage to the same geographic area.
(Ord. 4703, 6-1-16)
31.12.280 Persigo 201 Boundary existing antenna locations.
Most of the 50 wireless transmission equipment sites considered as part of the 201 Boundary study area are located south of I-70 and north of I-70B and Highway 6. This corresponds with where most of the commercial and industrial land use zones are located. Individual and small clusters of towers and base stations are located outside the triangular boundary created by the interstate and highway network in areas of larger residential land use zones and generally at higher ground elevations. Five of the sites are located just outside the 201 Boundary and are included in the study area because their signal affects coverage within the 201 Boundary. Two sites contain both a tower and a base station which explains why the number of towers is two greater than the number of sites.
|
Existing Total Number of Towers |
In |
Out |
Existing Total Number of Base Stations |
In |
Out |
|---|---|---|---|---|---|
|
Eligible Tower with PWSF |
17 |
3 |
Eligible Base Station with PWSF |
2 |
0 |
|
Noneligible Tower with PWSF |
2 |
1 |
Noneligible Base Station with PWSF |
3 |
0 |
|
Eligible Tower with no PWSF |
3 |
0 |
Eligible Base Station with no PWSF |
1 |
0 |
|
Noneligible Tower with no PWSF |
11 |
0 |
Noneligible Base Station with no PWSF |
9 |
0 |
|
Proposed Eligible Tower |
2 |
1 |
Proposed Eligible Base Station |
0 |
0 |
|
Total |
35 |
5 |
Total |
15 |
0 |
|
Site numbers in the 201 Boundary: 40 – 48, 50 – 59, 61 – 76, 78 – 85, 126, 127, 129 |
|||||
|
Site numbers within 1.5 mile perimeter of the 201 Boundary: 60, 77, 86, 87, 128 |
|||||
Figure 11 identifies the location of the sites listed in Table 7 above and are represented as follows:
|
• |
Black dot – Eligible towers or base stations with PWSF which have been approved through a prescribed process by the underlying zoning district. |
|
• |
Red dot – Noneligible towers or base stations (meaning infrastructure built without prior approval for construction by the underlying zoning agency). |
|
• |
Orange dot – Tower or base station that has either been approved and not yet built; or is undergoing review at the time of this publication. |
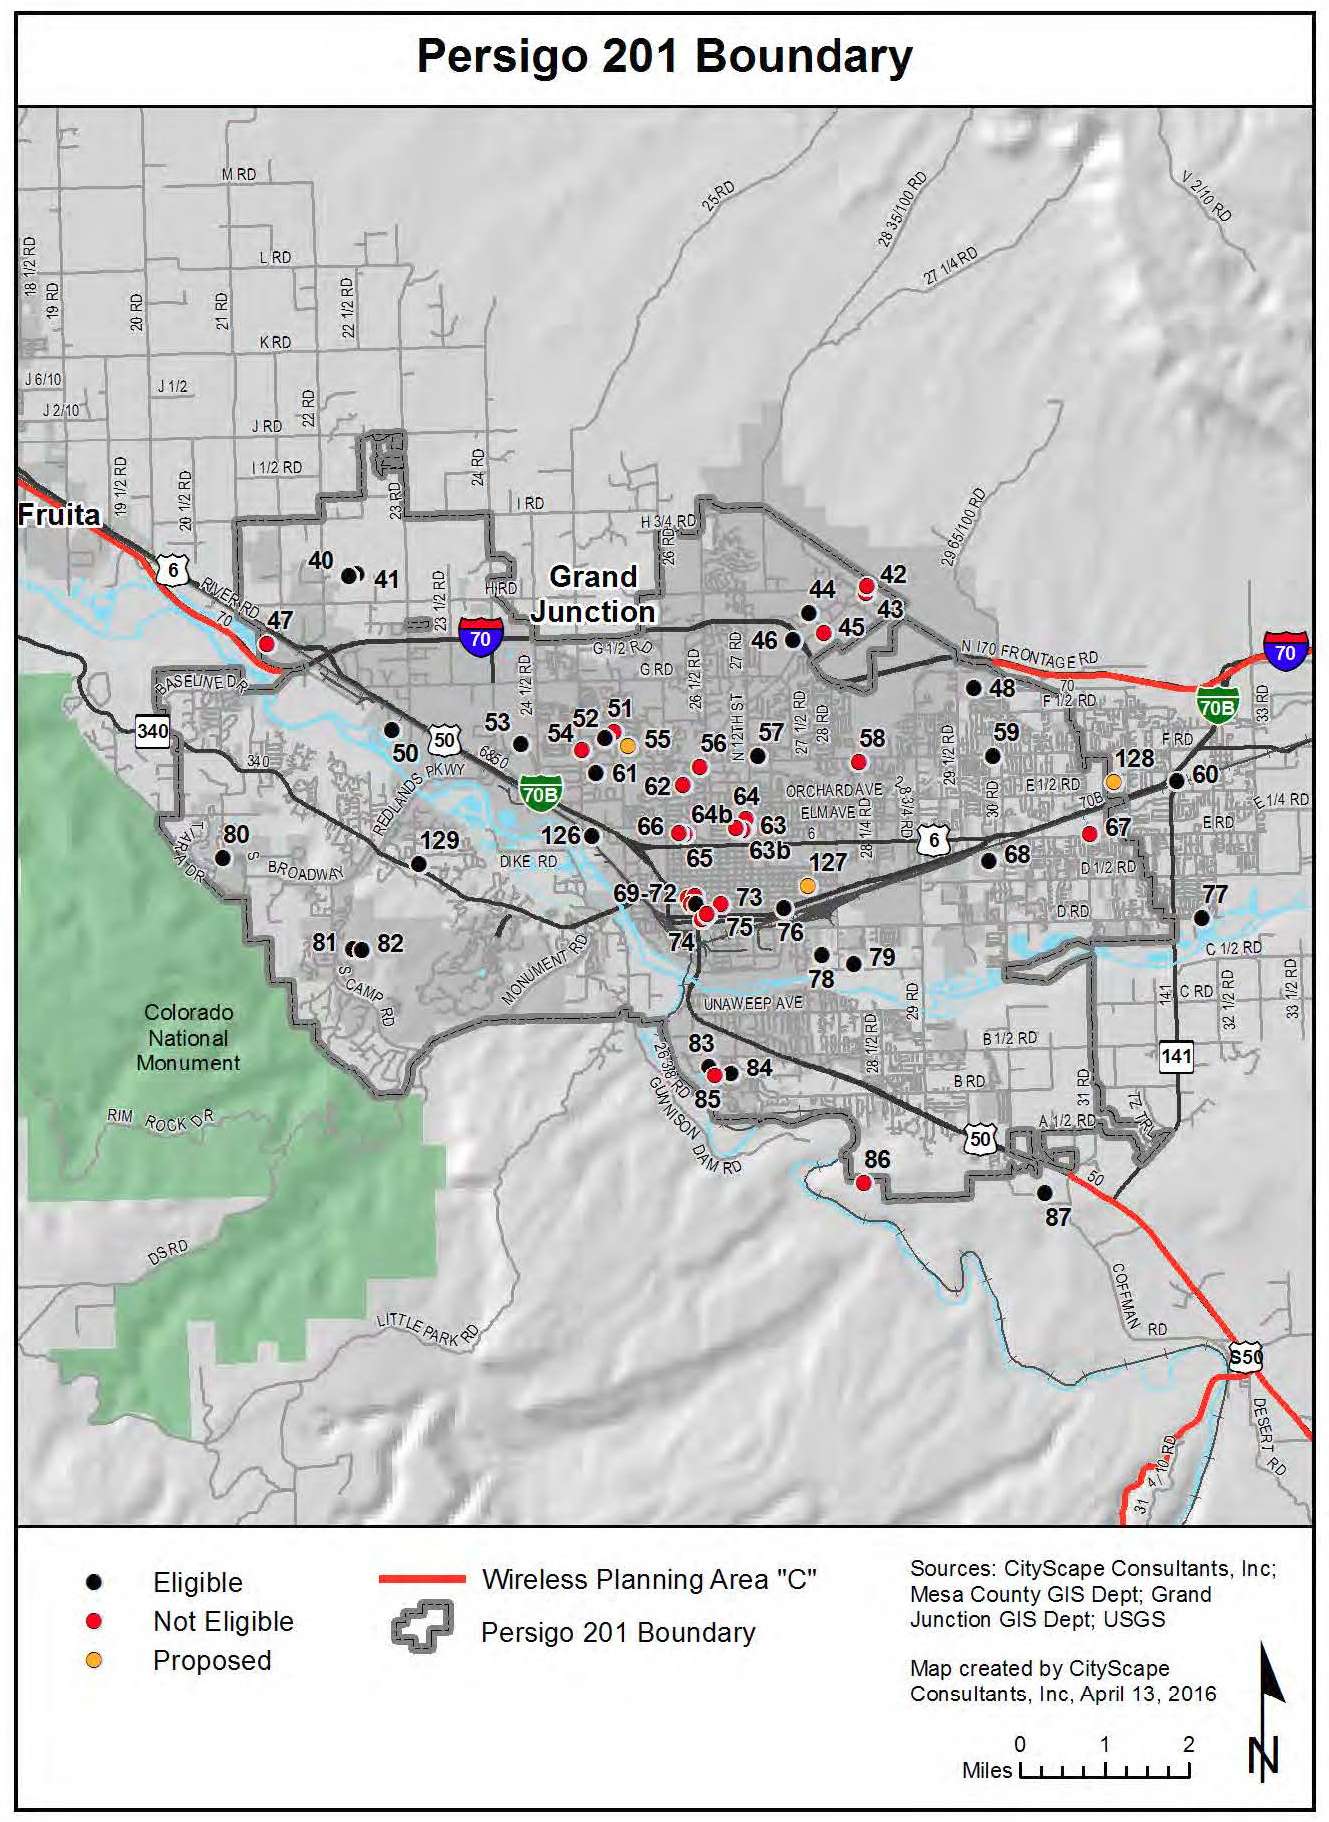
Figure 11: Existing Antenna Locations
(Ord. 4703, 6-1-16)
31.12.290 Persigo 201 Boundary composite maps.
The service area coverage based on propagation signal strength modeling is shown for both low band frequency in yellow and high band frequency in blue on the following composite maps. The highlighted areas represent where a generally reliable signal level should be available for indoor use for both low and high bands of service.
Indoor usage is the service threshold utilized for composite modeling because it represents the lowest signal strength acceptable after considering the signal loss that occurs from building penetration. Outdoor signal strength in the same area will usually be higher than indoor signal strength. Generally the closer the subscriber is to the facility, the more reliable the service. A subscriber further from the facility will have less reliable service. As the subscriber gets closer to the edge of the yellow or blue area, the signal strength becomes more prone to degradation, particularly as usage in the area increases or environmental conditions worsen. Areas of gray on the map indicate where the subscriber will experience weak, unpredictable levels of signal strength, or no service at all. Filling in these coverage gaps would require the installation of additional antennas and corresponding construction of more towers or the identification of buildings that would serve as base stations.
Figure 12 illustrates current theoretical coverage for one service provider operating in the low or high band frequency assuming they had equipment on each site in the facility inventory. Figure 13 shows how population growth and technology changes will affect the current coverage model shown in Figure 12.
Both composite maps include the expected effects of terrain, vegetative cover, and current population density variables. The antenna mounting elevation in both figures is assumed to be at the top of the towers and base stations where the height is known or at 118 feet where unknown.
Figures 12 and 13 identify the location of the inventoried sites categorized as follows:
|
• |
Black dot – Eligible towers or base stations with PWSF |
|
★ |
Black star – Noneligible towers or base stations without PWSF |
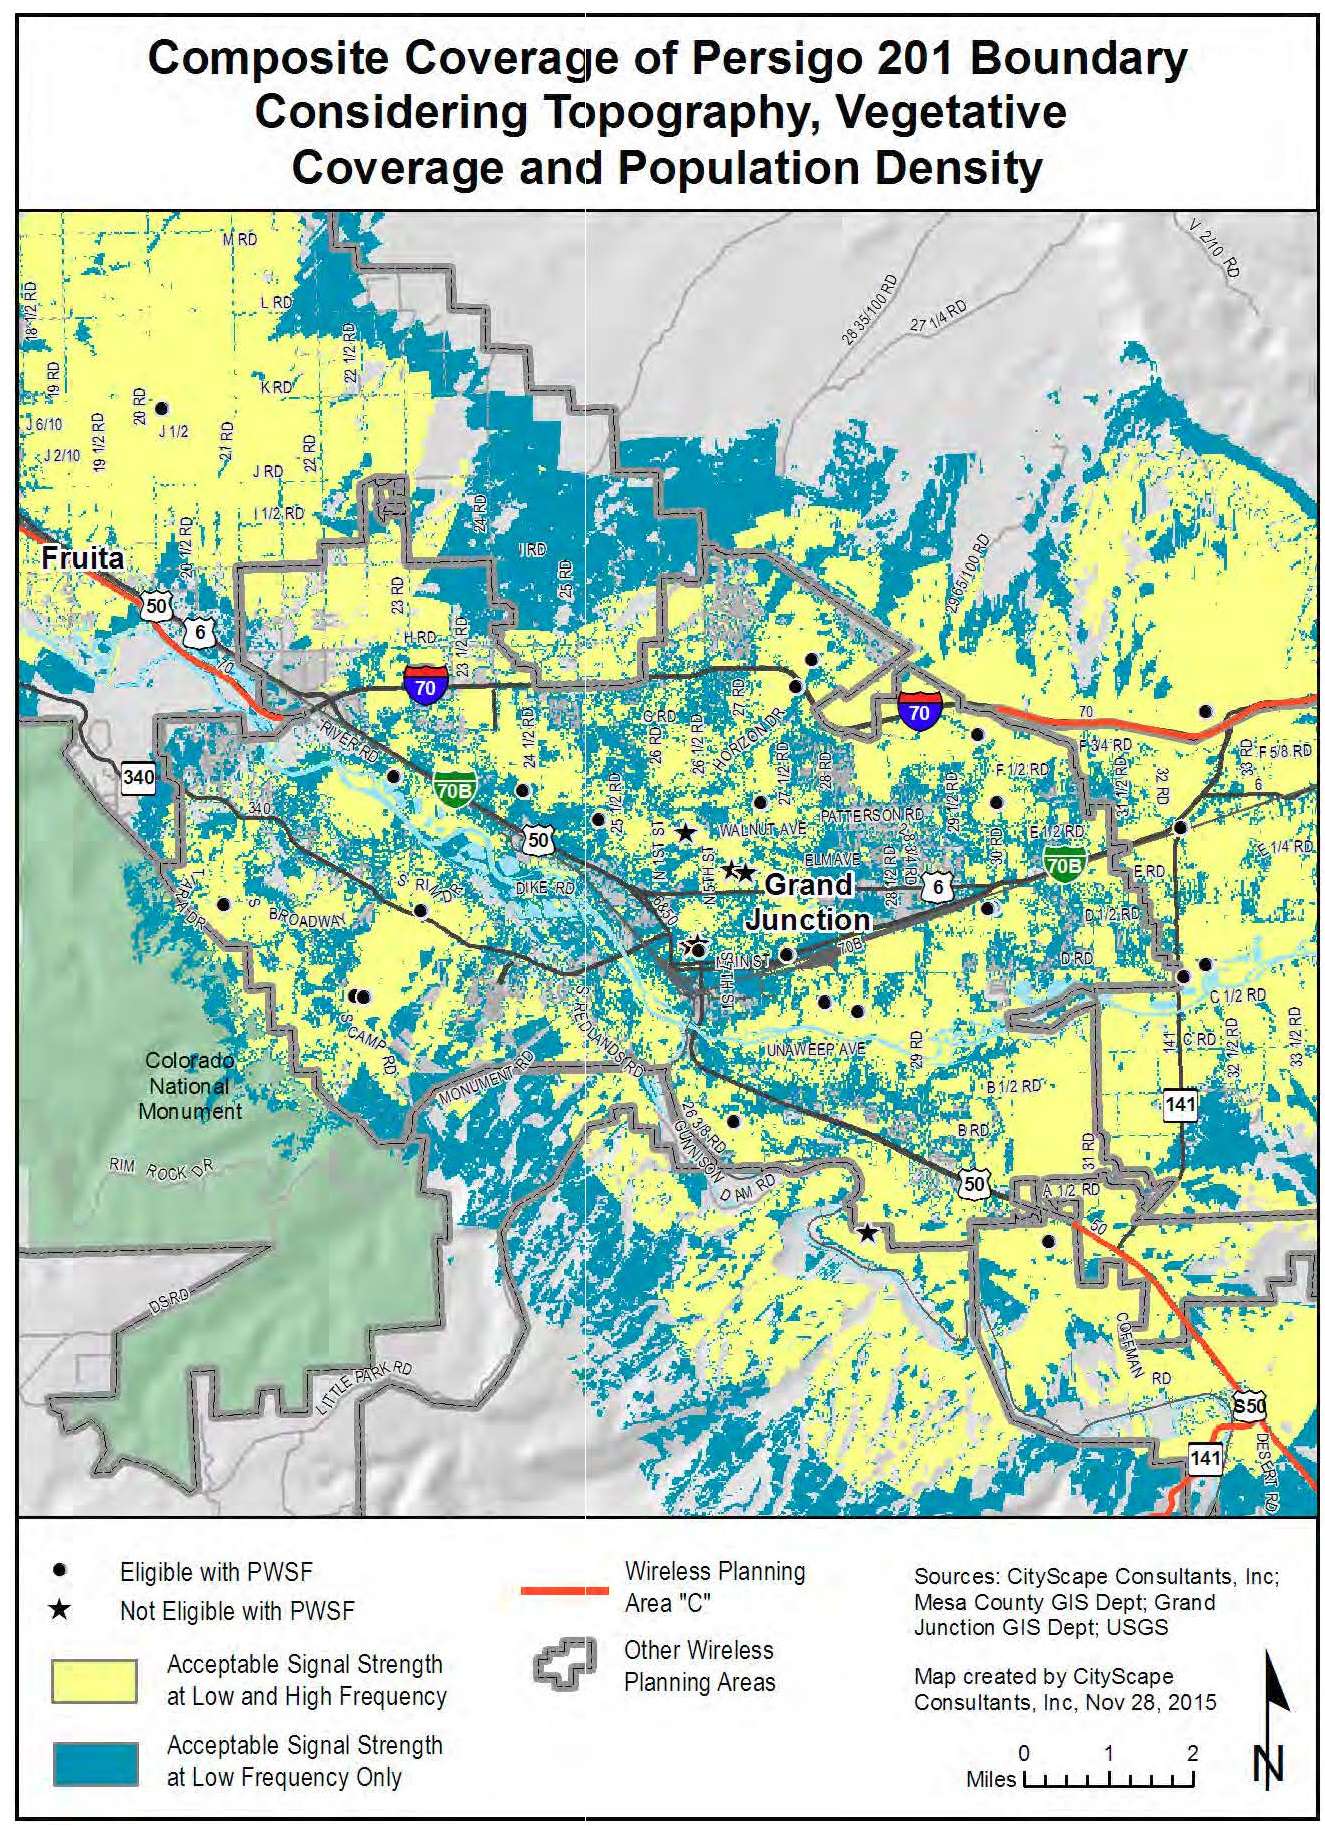
Figure 12: Current Potential Coverage
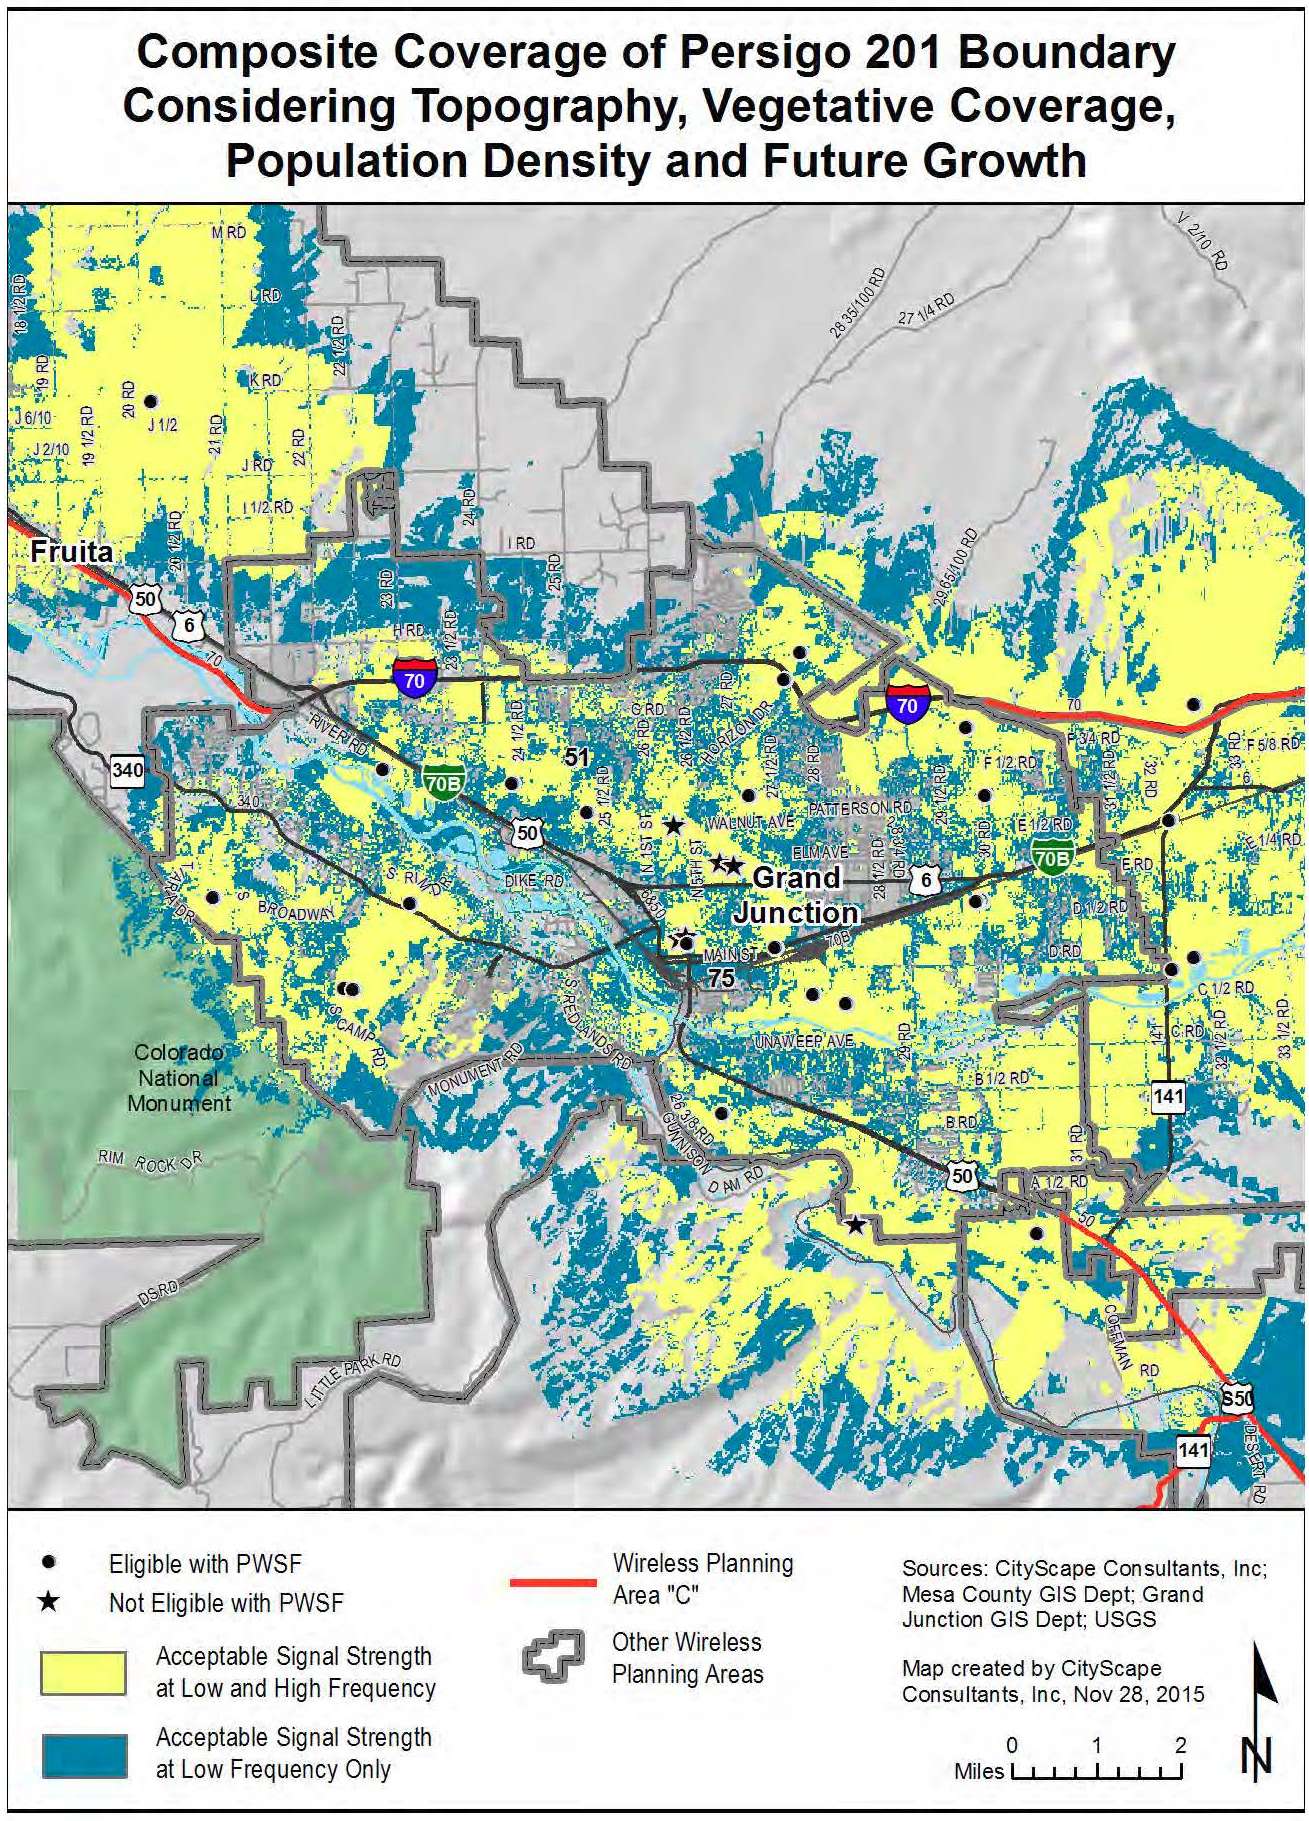
Figure 13: Current Potential Coverage Including Future Growth
(Ord. 4703, 6-1-16)
31.12.300 Persigo 201 Boundary propagation mapping.
In propagation mapping the gradation of colors from yellow to blue indicates the level of propagation signal strength. The geographic areas in yellow identify superior signal strength; green equates to areas with average signal strength; shades of blue symbolize acceptable signal strength; and gray shades show marginal or no signal strength.
Generally, the closer the proximity to the antenna the brighter the shades of yellow within the geographic service area which means the better quality of wireless communications between the elevated antenna and the wireless handset. As distance increases between the handset and the antenna, the green, blue, and gray shades appear, indicating geographic service areas with average, acceptable, and no signal strength respectively. Table 8 provides further explanation of the color coding relative to propagation signals.
|
SIGNAL STRENGTH |
||
|---|---|---|
|
COLOR |
TITLE |
DESCRIPTION |
|
Yellow |
Superior |
Signal strength strong enough to receive signal in many buildings |
|
Green |
Average |
Signal strength strong enough to receive signal in a car, but not inside most buildings |
|
Blue |
Acceptable |
Signal strength strong enough to receive signal outside for many handsets, but no expectation of receiving a signal in a car or building |
|
Gray |
No Service |
Signal strength is marginal or no service |
Figure 14 illustrates various levels of propagation signal coverage including terrain, network capacity and environmental variables. While the industry standards identify green and blue shades as “average” and “acceptable” coverage, customers tend to find otherwise. Most 21st century wireless subscribers demand superior signal strength (yellow) in their residences, schools, offices, and places frequented for shopping and entertainment. As consumers continue the trend of terminating traditional landline phone services and using the wireless handset as the primary mode of communication, having superior signal strength inside buildings becomes paramount to meeting their expectations. Therefore the industry’s “average” and “acceptable” coverage variables do not meet customer demands and expectations.
Figure 14 shows that significant gaps in coverage can be expected over the next 10 to 15 years with the existing infrastructure in the Persigo 201 Boundary. More than 50 percent of the projected signal coverage quality from existing infrastructure will be marginalized or eliminated based on technology changes anticipated with 5G networks. A significant amount of additional infrastructure will be needed to improve the quality of network coverage shown in areas with hues of green to blue and in all gray areas.
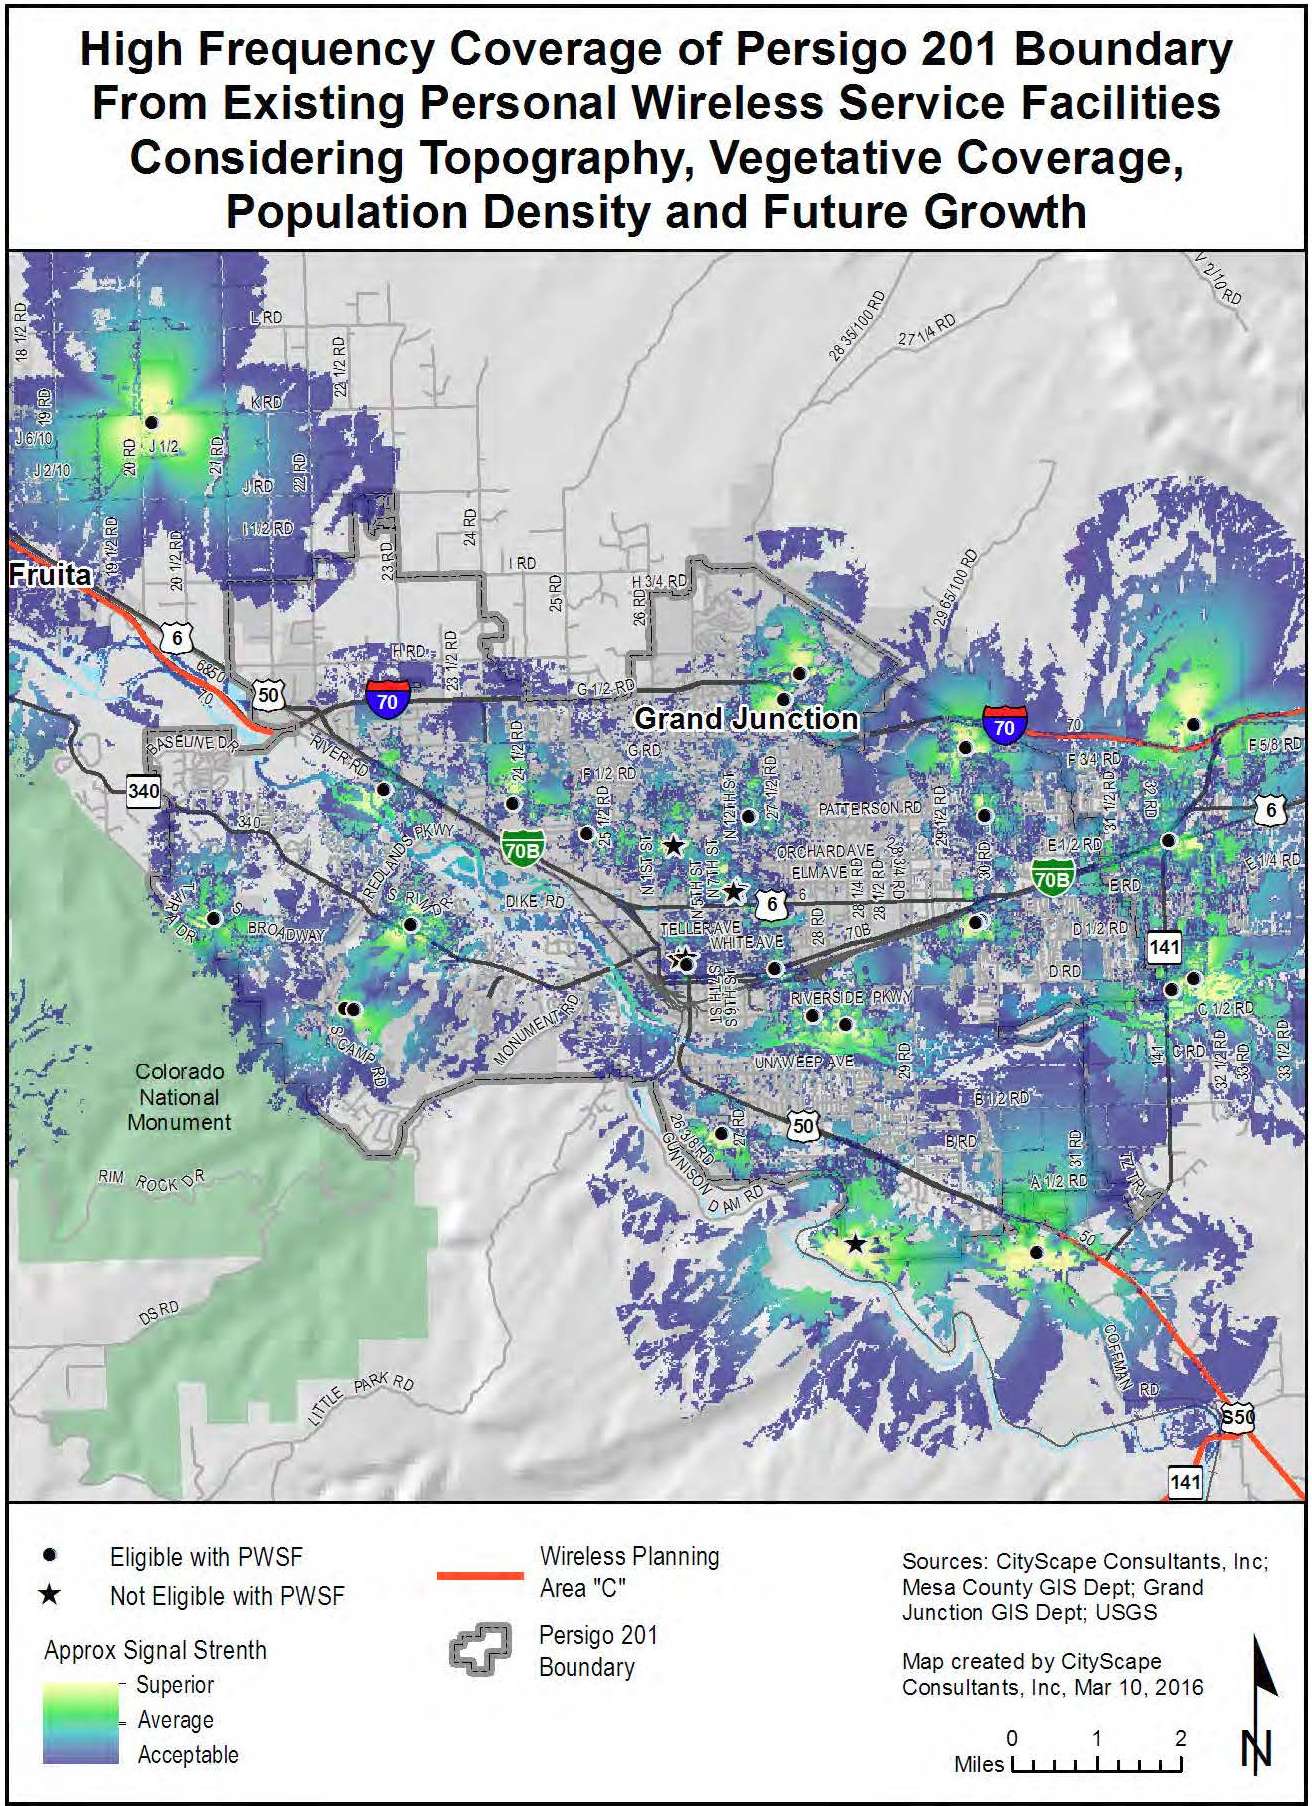
Figure 14: Propagation Map
(Ord. 4703, 6-1-16)
31.12.310 Persigo 201 Boundary estimation of future antenna sites.
Due to the urban characteristics of the City of Grand Junction, CityScape estimates that the largest number of new sites constructed over the next 10 to 15 years will be built in and around the Persigo 201 Study Area. Approximately 11 to 19 new towers or base stations will be needed to fill in the anticipated coverage gaps. These estimates are based on the expected changes in population density, subscriber base and usage, daily transient movement through the study area and the number of calls a facility can service at any given time. The projections consider coverage, capacity, and broadband network objectives and take into consideration terrain, population and proposed maximum infrastructure height variables. The projection model that CityScape designed assumes that all existing tower and base station locations will be used for maximum co-location opportunities in an effort to reduce the number of new towers and base stations required within a given geographic area. Should the industry not maximize the use of existing facilities, a greater number of towers will need to be constructed over this same time period. It should also be noted that even with this increase in new facilities, some areas within the study area will still be underserved due to the terrain and rural characteristics around the periphery of the study area.
(Ord. 4703, 6-1-16)
31.12.320 Public properties as fill-in sites for network gaps.
(a) When publicly owned property is used for new tower or base station construction, the community, represented by their local government agency, is assured that their preferences for tower types and concealment technology are followed. As public properties are developed, the infrastructure installed becomes the precedent for how future sites should be developed on both public and private land. For example, many slick sticks and flagpole towers are available to the industry as are other creative concealment techniques. Some are more aesthetically pleasing and more practical than other types. As the local government adopts preferred products on publicly owned property, their application becomes the standard for future tower sites developed on public and private land within their zoning jurisdiction. Leasing public properties to tower builders and tenant carriers for new wireless infrastructure can also create new sources of public revenue. Additionally, having a tower on public property results in an asset for the local government that is available for emergency services radio and wireless broadband equipment use.
(b) The City of Grand Junction has affirmed their interest in the use of City owned properties within the Persigo 201 Boundary and has established the following minimal criteria for each property:
(1) The property shall be located within the Grand Junction Persigo 201 Boundary or can be included in the Grand Junction Persigo 201 Boundary.
(2) The property shall be one acre minimum in lot size.
(3) The property shall have vehicular access to an improved public right-of-way.
(4) The property shall have access to utilities.
(5) The property shall be outside the 100-year floodplain.
(6) The cellular facility shall meet all City development standards and be subject to all regulations of the zoning code including but not limited to, “in residential zoning districts and in mixed use zoning districts that include residential uses, new concealed towers shall not be permitted on lots where the primary use or principal structure is single-family or two-family residential, group living, day care, or a multifamily structure of fewer than three stories. Examples of land uses/structure types in residential areas where the site may include a concealed tower are: school, religious assembly, fire station, stadium tower or stand, or other similar institutional/civic uses/structures.”
(7) Concealment is required and the owner of the property must identify the type of concealment proposed with the understanding that if accepted by the City, then any type of concealment aside from what is proposed and accepted at the time of the Master Plan vetting process would require a conditional use permit (CUP).
(c) The City has reviewed and qualified a total of 15 of the 19 fill-in locations. The City has identified site-specific concealment infrastructure required on each property. These properties are referenced as public priority site locations and if developed according to the recommendations in Table 9 and the City’s zoning codes, are entitled to a streamlined administrative approval process.
(d) Additionally, the City invited private property owners to submit their land as potential priority site locations; provided, that the properties met the same criteria as the City-owned priority sites. Private property owners seeking inclusion of their property as a priority site in the Master Plan submitted an application to the City of Grand Junction for review. The selected nonpublic priority sites, which includes property that is not for profit, are also listed in Table 9. During the vetting process, the Orchard Mesa Irrigation District, a public property land owner, requested that three of their properties be reviewed and added to the public priority site list. All three properties are included in Table 9 as sites Q, R and S. Additionally, The Museum of Western Colorado vetted two properties and they are listed as sites T and U in Table 9 under Non Public Priority heading.
(e) Public properties not owned by the City of Grand Junction but which could potentially be used as fill-in sites are listed in Table 9. These properties have not been vetted since they are not owned by the City of Grand Junction. However, as potential fill-in sites they are listed in Table 9 with a not determined recommendation. Use of these public fill-in sites is encouraged and promoted in the City’s ordinance, but will require conditional use approval.
|
Public Priority Site ID |
Owner |
Location |
Address |
Parcel Number |
Acreage |
Site-Specific Recommendation |
|---|---|---|---|---|---|---|
|
I1 |
City of Grand Junction |
Grand Junction City Limits |
727 24 1/2 Road |
2701-333-00-941 Zoned CRS |
35.595 |
Canyon View Park Entry or Art Feature; Slick Stick |
|
I2 |
City of Grand Junction |
Grand Junction City Limits |
728 24 Road |
2701-333-00-942 Zoned CSR |
39.741 |
Canyon View Park Entry or Art Feature; Slick Stick |
|
I4 |
City of Grand Junction |
Grand Junction City Limits |
730 24 Road |
2701-333-00-948 Zoned CSR |
36.793 |
Canyon View Park Entry or Art Feature; Slick Stick |
|
J1 |
City of Grand Junction |
Grand Junction City Limits |
773 Old Orchard Street |
2701-352-51-945 Zoned CSR |
31.653 |
Saccomanno Park Slick Stick; Concealed 3-Legged Pole |
|
J2 |
City of Grand Junction |
Grand Junction City Limits |
822 Lanai Drive |
2701-264-14-941 Zoned CSR |
2.817 |
Paradise Hills Park Banner Pole |
|
J3 |
City of Grand Junction |
Grand Junction City Limits |
731 27 Road |
2701-354-00-949 Zoned CSR |
12.643 |
Horizon Park Banner Pole |
|
K1 |
City of Grand Junction |
Grand Junction City Limits |
2155 Broadway |
2947-231-17-944 Zoned CSR |
3.269 |
Fire Station 5 Slick Stick; Flagpole; Concealed 3-Legged Pole |
|
L |
City of Grand Junction |
Grand Junction City Limits |
2400 Blue Heron Road |
2945-093-00-945 Zoned CSR |
46.519 |
Colorado Riverfront Trail Slick Stick; Banner Pole |
|
N1 |
City of Grand Junction |
Grand Junction City Limits |
405 Ridges Boulevard |
2945-174-24-944 Zoned PD |
1.926 |
Open Space Banner Pole |
|
N2 |
City of Grand Junction |
Grand Junction City Limits |
407 Saddle Court |
2945-174-29-941 Zoned PD |
28.041 |
Open Space Banner Pole |
|
N3 |
City of Grand Junction |
Grand Junction City Limits |
406 Ridges Boulevard #F1 |
2945-212-13-944 Zoned PD |
3.207 |
Open Space Banner Pole |
|
N4 |
City of Grand Junction |
Grand Junction City Limits |
585 Hidden Valley Court |
2945-212-14-944 Zoned PD |
7.028 |
Open Space Banner Pole |
|
Q |
Orchard Mesa Irrigation District (OMID) |
Mesa County |
158 29 1/2 Road |
2943-321-00-946 Zoned RSF-R |
1.672 |
Slick Stick; Flagpole; Concealed 3-Legged Pole |
|
R |
USA c/o OMID |
Grand Junction City Limits |
2962 A 1/2 Road |
2943-321-00-913; 2943-321-00-175* Zoned RSF-4 |
4.725 |
Slick Stick; Flagpole; Concealed 3-Legged Pole |
|
S |
USA c/o OMID |
Mesa County |
121 31 Road |
2943-334-00-948 Zoned AFT |
19.89 |
Slick Stick; Flagpole; Concealed 3-Legged Pole |
*Code reviser’s note: The reference to parcel number 2943-321-00-914 has been updated to be to 2943-321-00-175.
|
Other Public Priority Site ID |
Owner |
Location |
Address |
Parcel Number |
Acreage |
Site-Specific Recommendation |
|---|---|---|---|---|---|---|
|
H1 |
Mesa County |
GJ 201 Boundary |
651 Railhead Circle |
2945-062-16-938 |
9.194 |
Not Determined |
|
H2 |
State of Colorado |
GJ 201 Boundary |
Walter Walker Wildlife Area |
2947-142-00-922 |
470.112 |
Not Determined |
|
I3 |
Caprock Bldg Association |
Grand Junction City Limits |
Caprock Elementary |
2701-334-00-940 Zoned R-5 |
7.683 |
Not Determined |
|
K2 |
District 51 Master Lease Association |
GJ 201 Boundary |
Redlands Middle School |
2947-231-00-949 |
20.239 |
Not Determined |
|
M |
Colorado Game Fish and Parks Department |
Grand Junction City Limits |
711 Independent Avenue |
2945-104-00-922 |
9.88 |
Not Determined |
|
O |
State Highway Department |
Grand Junction City Limits |
606 S 9th Street |
2945-231-03-928 |
5.085 |
Not Determined |
|
P |
Mesa County |
GJ 201 Boundary |
275 1/2 Coulson Drive #B |
2943-302-47-935 |
7.495 |
Not Determined |
|
Nonpublic Priority Site ID* |
Owner |
Location |
Address |
Parcel Number |
Acreage |
Site-Specific Recommendation |
|---|---|---|---|---|---|---|
|
T |
Museum of Western Colorado |
Grand Junction City Limits |
462 Ute Avenue |
2945-143-28-992 Zoned B-2 |
1.15 |
Concealed Base Station on Observation Station |
|
U |
Museum of Western Colorado |
Mesa County |
3065 Patterson Road |
2943-091-00-993 Zoned RSF-4 |
22.34 |
Farm Entry; Art Feature; Slick Stick; Flagpole; Concealed 3-Legged Pole |
*Nonpublic also includes property that is not for profit
Figure 15 illustrates the potential solutions that will need to be considered to fill in the gaps identified in Figure 14. The area colored with yellow to green gradients shows the theoretical coverage from existing towers and base stations with PWSF. The areas colored with light to dark shades of red gradients show the projected theoretical coverage from existing towers and base stations without current PWSF that could be utilized or upgraded for co-locations. The areas colored with light to dark orange gradient would be filled with new infrastructure that has already been submitted for review. The areas colored with pink gradient represent areas where new fill-in sites would need to be located to provide the required coverage.
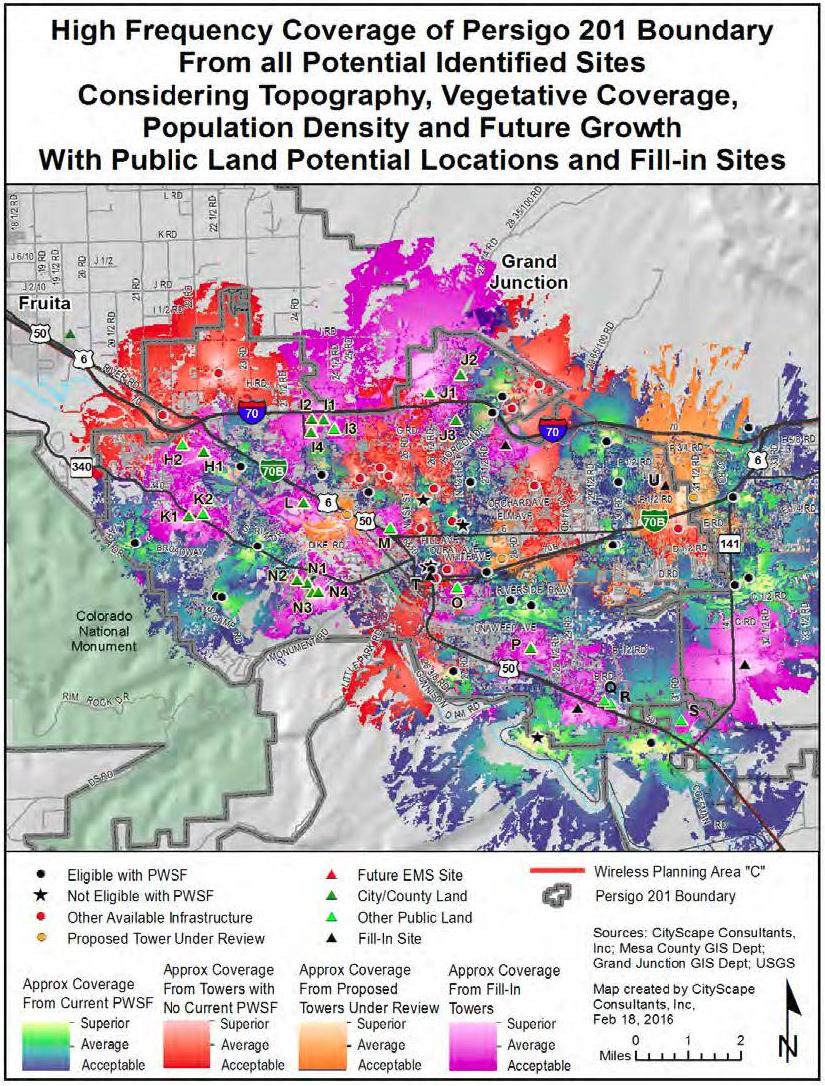
Figure 15: High Frequency Coverage with Future Fill-in
(Ord. 4703, 6-1-16)
31.12.330 Lower Valley characteristics.
(a) Rural;
(b) 139.85 square miles;
(c) 2010 population estimate 18,437;
(d) 2030 population estimate 26,900.
(Ord. 4703, 6-1-16)
31.12.340 Lower Valley theoretical root mean square maps.
The following maps represent a theoretical build-out of equally distributed antennas, mounted at a tower height of 118 feet, in a perfect radio frequency environment for a single service provider that excludes topographic, vegetative cover and population density considerations. The black dot within each larger circle indicates the ideal antenna location. The smaller circle within the larger circle represents the acceptable search ring for locating the tower and antennas.
Figure 16 illustrates that 14 towers or base stations equally distributed throughout the Lower Valley would provide complete low frequency coverage to the defined study area. Figure 17 illustrates that 40 locations would be needed to provide complete high frequency coverage to the same geographic area.
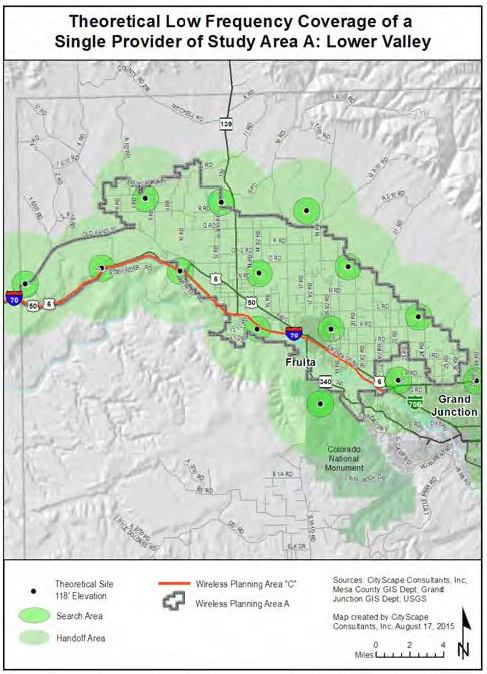
Figure 16: Theoretical Low Frequency
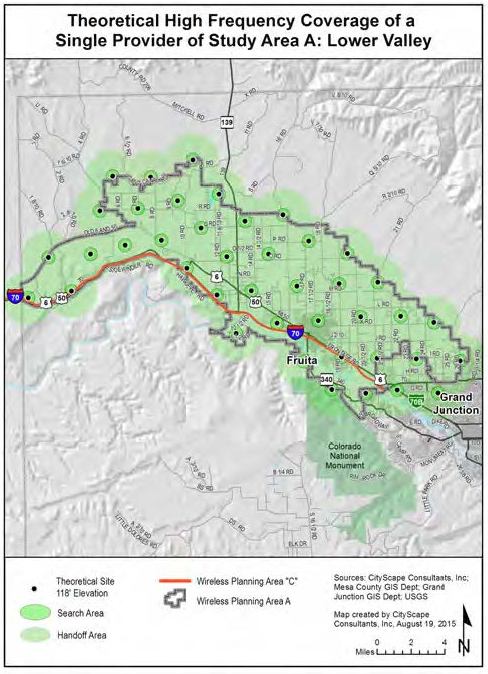
Figure 17: Theoretical High Frequency
(Ord. 4703, 6-1-16)
31.12.350 Lower Valley existing antenna locations.
Almost half of the 21 total sites in and around the Lower Valley are located within a 1.5 mile perimeter of the actual study area and nine of those 10 sites are within the Persigo 201 Boundary. Of the 10 sites within the Lower Valley study area only four currently have PWSF on them. Three of the sites (35, 36 and 37) are located parallel to I-70 and two of the sites (39 and 131) are located in the eastern half of the Lower Valley. Sites 136 through 139 all support wireless Internet facilities. This pattern of deployment is very common for the industry. The greatest concentration of towers and base stations is closer to the urban area along the major transportation networks.
|
Existing Total Number of Towers |
In |
Out |
Existing Total Number of Base Stations |
In |
Out |
|---|---|---|---|---|---|
|
Eligible Tower with PWSF |
4 |
3 |
Eligible Base Station with PWSF |
0 |
1 |
|
Noneligible Tower with PWSF |
0 |
0 |
Noneligible Base Station with PWSF |
0 |
0 |
|
Eligible Tower with no PWSF |
0 |
2 |
Eligible Base Station with no PWSF |
0 |
0 |
|
Noneligible Tower with no PWSF |
6 |
2 |
Noneligible Base Station with no PWSF |
0 |
2 |
|
Proposed Eligible Tower |
0 |
1 |
Proposed Eligible Base Station |
0 |
0 |
|
Total |
10 |
8 |
Total |
0 |
3 |
|
Site numbers in the Lower Valley: 34 – 39, 136 – 139 |
|||||
|
Site numbers within 1.5 mile perimeter of the Lower Valley: 40, 41, 47, 50 – 55, 80, 131 |
|||||
Figure 18 identifies the location of the sites listed in Table 10 above and are represented as follows:
|
• |
Black dot – Eligible towers or base stations with PWSF which have been approved through a prescribed process by the appropriate local government agency. |
|
• |
Red dot – Noneligible towers or base stations (meaning infrastructure built without prior approval for construction by the appropriate local government agency). |
|
• |
Orange dot – Tower or base station that has either been approved but not yet built; or is undergoing review at the time of this publication. |
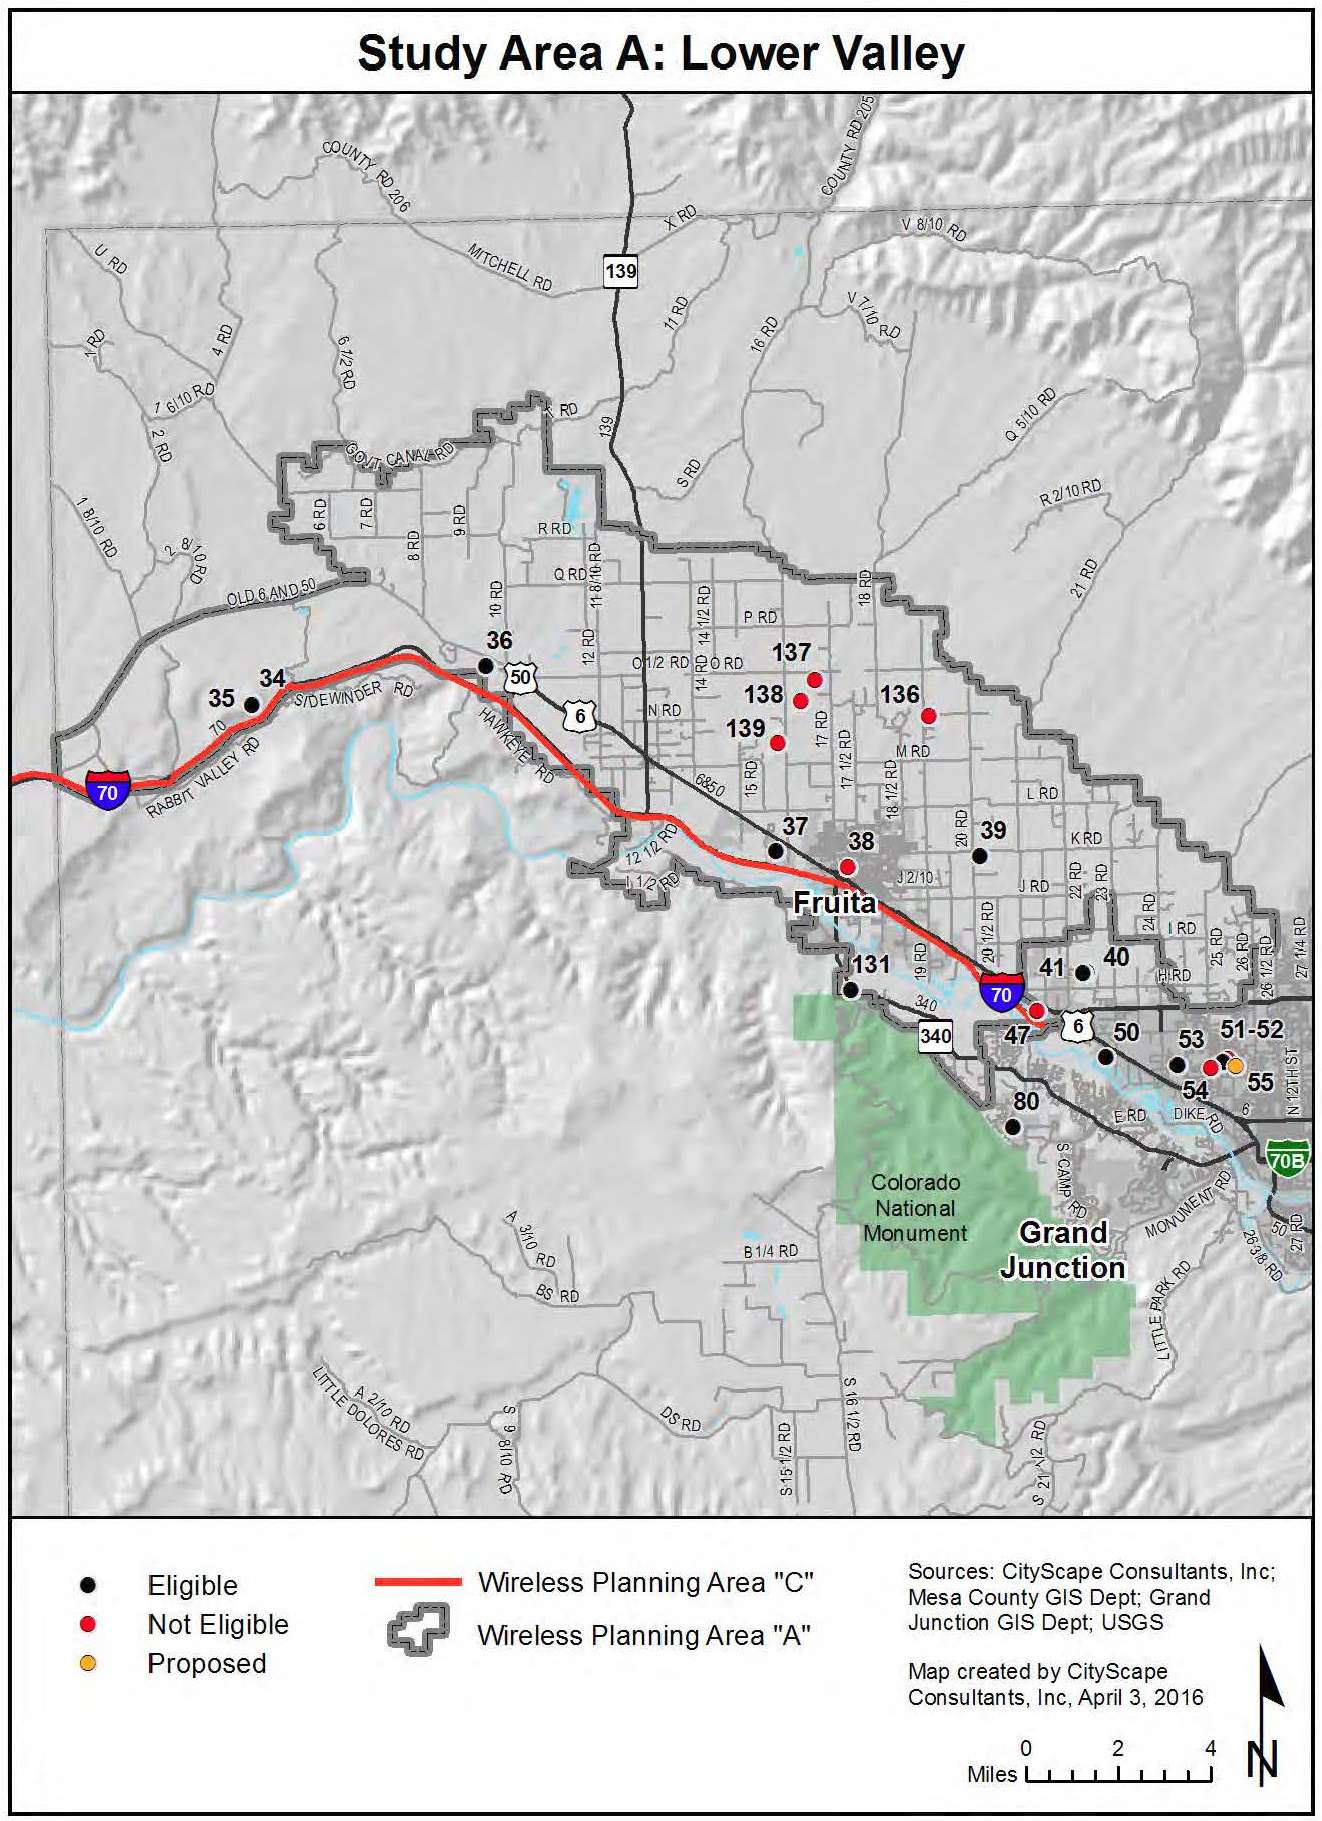
Figure 18: Existing Antenna Locations
(Ord. 4703, 6-1-16)
31.12.360 Lower Valley composite maps.
The service area coverage based on propagation signal strength modeling is shown for both low band frequency in yellow and high band frequency in blue on the following composite maps. The highlighted areas represent where a generally reliable signal level should be available for indoor use for both low and high bands of service.
Indoor usage is the service threshold utilized for composite modeling because it represents the lowest signal strength acceptable after considering the signal loss that occurs from building penetration. Outdoor signal strength in the same area will usually be higher than indoor signal strength. Generally the closer the subscriber is to the facility the more reliable the service. A subscriber further from the facility will have less reliable service. As the subscriber gets closer to the edge of the yellow or blue area, the signal strength becomes more prone to degradation, particularly as usage in the area increases or environmental conditions worsen. Areas of gray on the map indicate where the subscriber will experience weak, unpredictable levels of signal strength, or no service at all. Filling in these coverage gaps would require the installation of additional antennas and corresponding construction of more towers or the identification of buildings that would serve as base stations.
Figure 19 illustrates current theoretical coverage for one service provider operating in the low or high band frequency assuming they had equipment on each site in the facility inventory. Figure 20 shows how population growth and technology changes will affect the current coverage model shown in Figure 19.
Both composite maps include the expected effects of terrain, vegetative cover, and current population density variables. The antenna mounting elevation in both figures is assumed to be at the top of the towers and base stations where the height is known or at 118 feet where unknown.
Figures 19 and 20 identify the location of the inventory sites categorized as follows:
|
• |
Black dot – Eligible towers or base stations with PWSF |
|
★ |
Black star – Noneligible towers or base stations without PWSF |
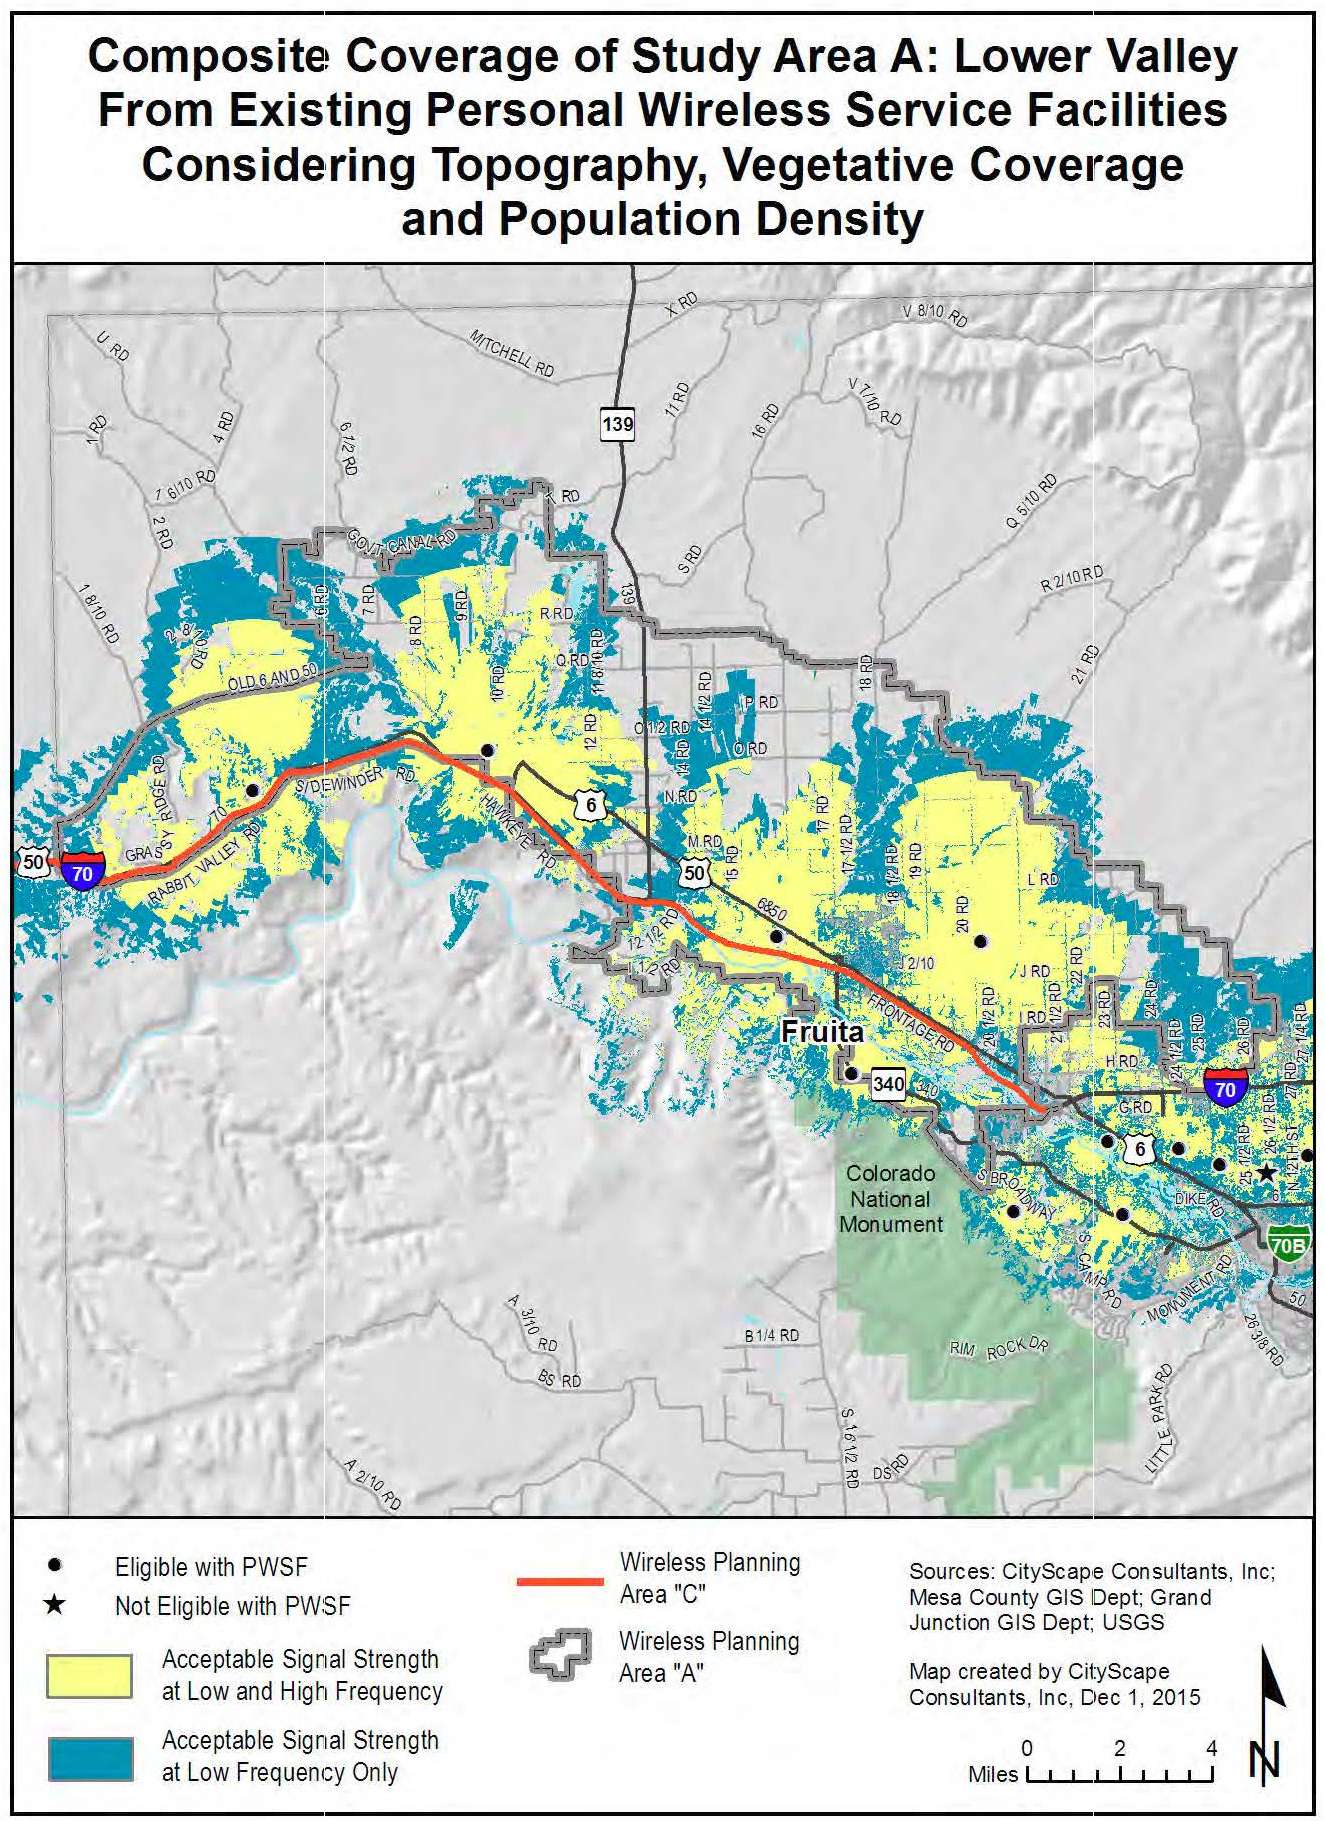
Figure 19: Current Potential Coverage
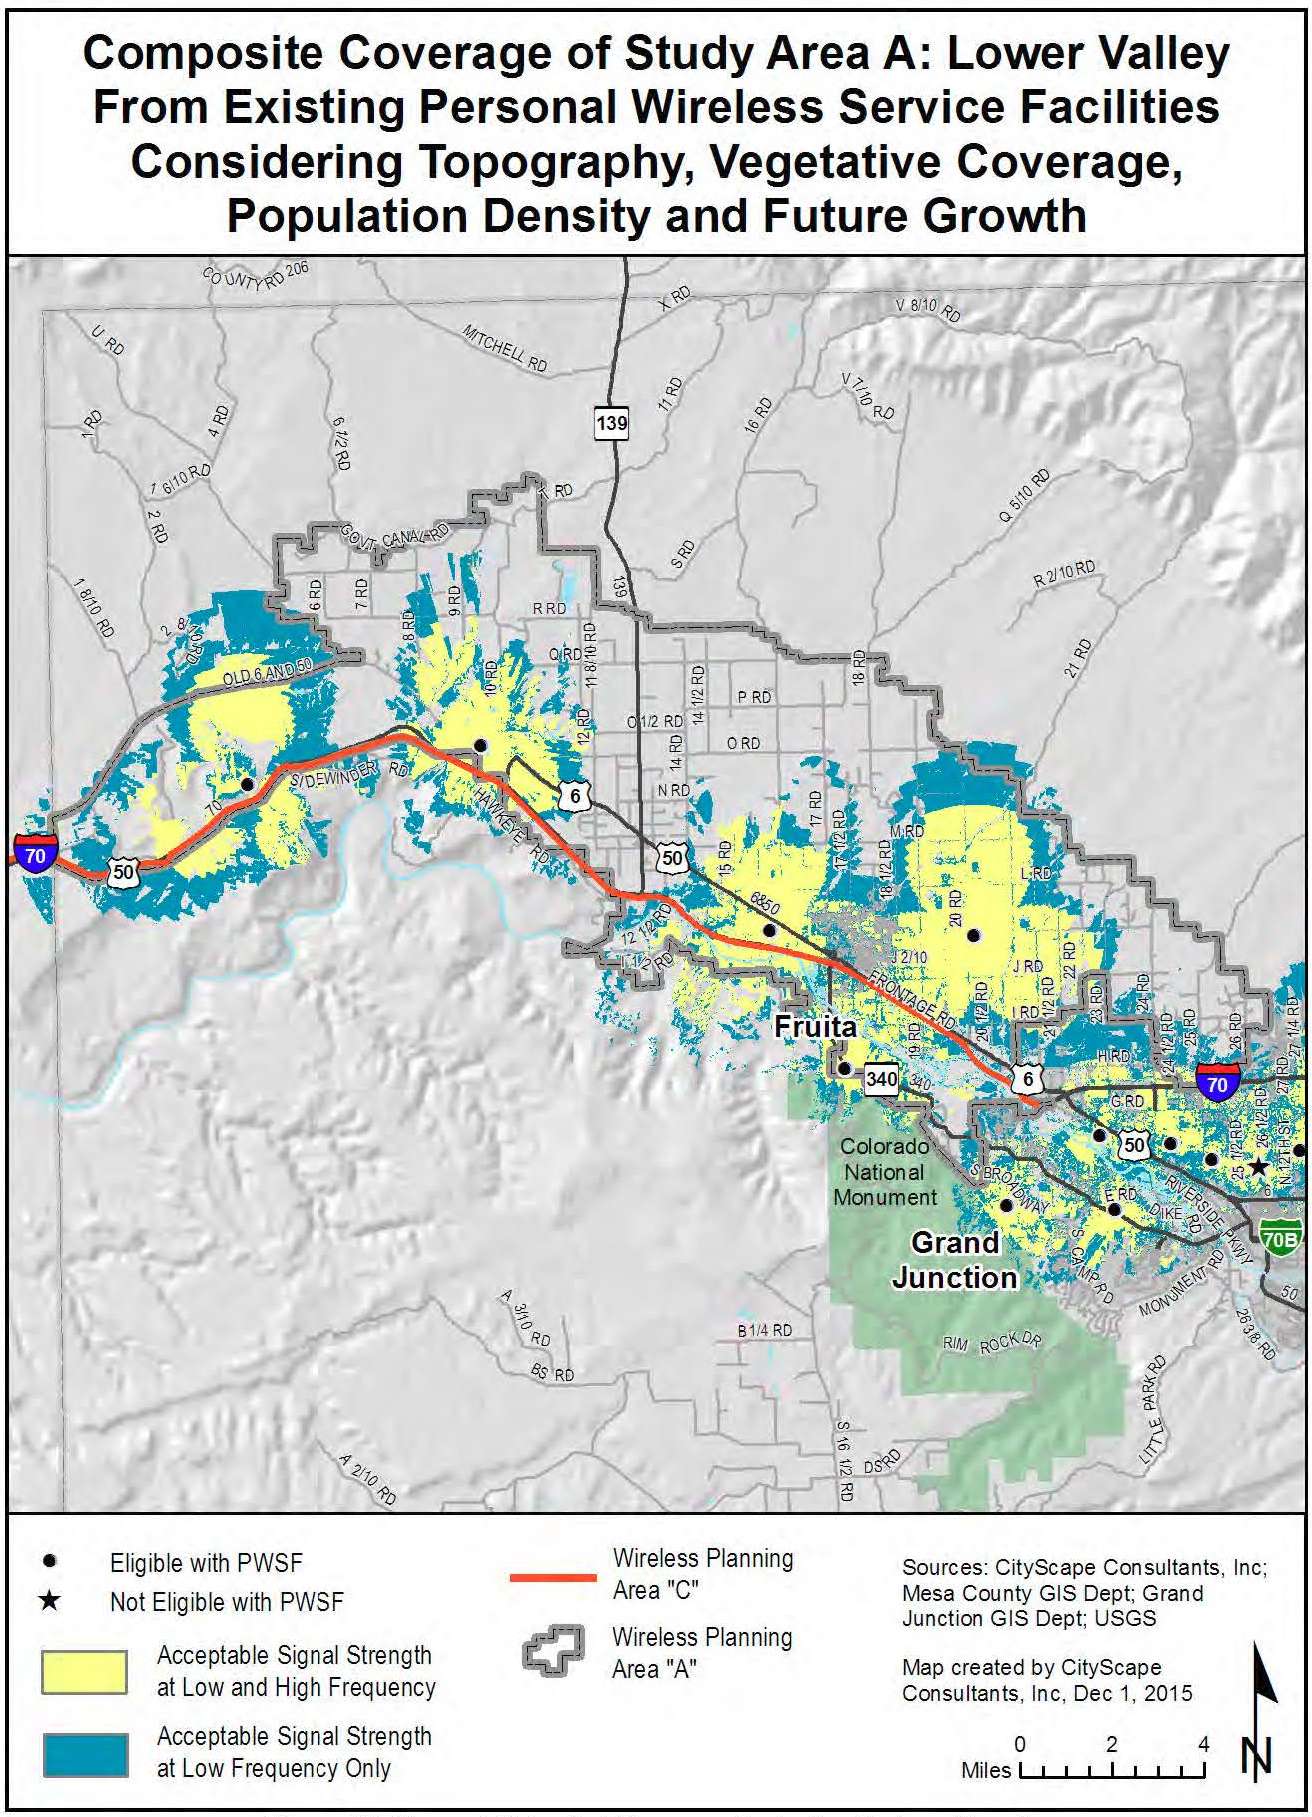
Figure 20: Current Potential Coverage Including Future Growth
(Ord. 4703, 6-1-16)
31.12.370 Lower Valley estimation of future antenna sites.
Due to the rural characteristics of the Lower Valley, CityScape estimates that the largest number of new sites constructed over the next 10 to 15 years will be built along the I-70 corridor. Approximately seven new towers or base stations will be needed to fill in anticipated coverage gaps. However, only four of the seven sites have been turned on in the gap analysis map in Figure 20 because CityScape believes it is unlikely that the industry will add all seven facilities over the next 10 to 12 years.
These estimates are based on the expected changes in population density, subscriber base and usage, daily transient movement throughout the study area and the number of calls a facility can service at any given time. The projections consider coverage, capacity, and broadband network objectives and take into consideration terrain, population and proposed maximum infrastructure height variables. The projection model that CityScape designed assumes that all existing tower and base station locations will be used for maximum co-location opportunities in an effort to reduce the number of new towers and base stations required within a given geographic area. Should the industry not maximize the use of existing facilities, a greater number of towers will need to be constructed over this same time period. It should also be noted that even with this increase in new facilities, some areas within the study area will still be underserved due to the terrain and to the rural characteristics of portions of the study area.
CityScape has reviewed the gaps in network coverage in comparison to the location of publicly owned properties and considered the impact that placing a tower on those properties would have on network and public safety coverage. When publicly owned property is used for new tower or base station construction, the community, represented by their local government agency, is assured that their preferences for tower types and concealment technology are followed. As public properties are developed, the infrastructure installed becomes the precedent for how future sites should be developed on both public and private land. For example, many slick sticks and flagpole towers are available to the industry as are other creative concealment techniques. Some are more aesthetically pleasing and more practical than other types. As the local government adopts preferred products on publicly owned property, their application becomes the standard for future tower sites developed on public and private land within their zoning jurisdiction. Leasing public properties to tower builders and tenant carriers for new wireless infrastructure can also create new sources of public revenue. Additionally, having a tower on public property results in an asset for the local government that is available for emergency services radio and wireless broadband equipment use.
Figure 21 indicates how certain geographic areas would benefit with improved network coverage from the addition of the publicly owned properties. Table 11 identifies potential public property fill-in sites. Tower type preferences are not provided in the recommendation column because the property has not been vetted by the local planning agency.
|
Public Site ID |
Owner |
Location |
Address |
Parcel Number |
Acreage |
Site-Specific Recommendation |
|---|---|---|---|---|---|---|
|
D |
State of Colorado |
|
Highline State Park |
2691-053-00-922 |
325.442 |
Not Determined |
|
E1 |
Lower Valley Protection District |
Loma |
1341 13 Road |
2691-334-04-498 |
0.79 |
Not Determined |
|
E2 |
State Department of Highways |
Loma |
1346 13 3/10 Road |
2691-342-00-924 |
9.762 |
Not Determined |
|
F1 |
City of Fruita |
Fruita |
324 N Coulson Street |
2697-172-00-940 |
1.398 |
Not Determined |
|
F2 |
City of Fruita |
Fruita |
300 W Ottley Avenue |
2697-172-00-946 |
6.04 |
Not Determined |
|
F3 |
Lower Valley Protection District |
Fruita |
168 N Mesa Street |
2697-172-53-944 |
0.675 |
Not Determined |
|
F4 |
District 51 |
Fruita |
Fruita Middle School |
2697-172-28-942 |
12.725 |
Not Determined |
|
F5 |
City of Fruita |
Fruita |
210 Frontage Road |
2697-173-09-945 |
3.51 |
Not Determined |
|
G |
Mesa County |
Fruita |
916 19 1/2 Road |
2697-224-00-939 |
5.281 |
Not Determined |
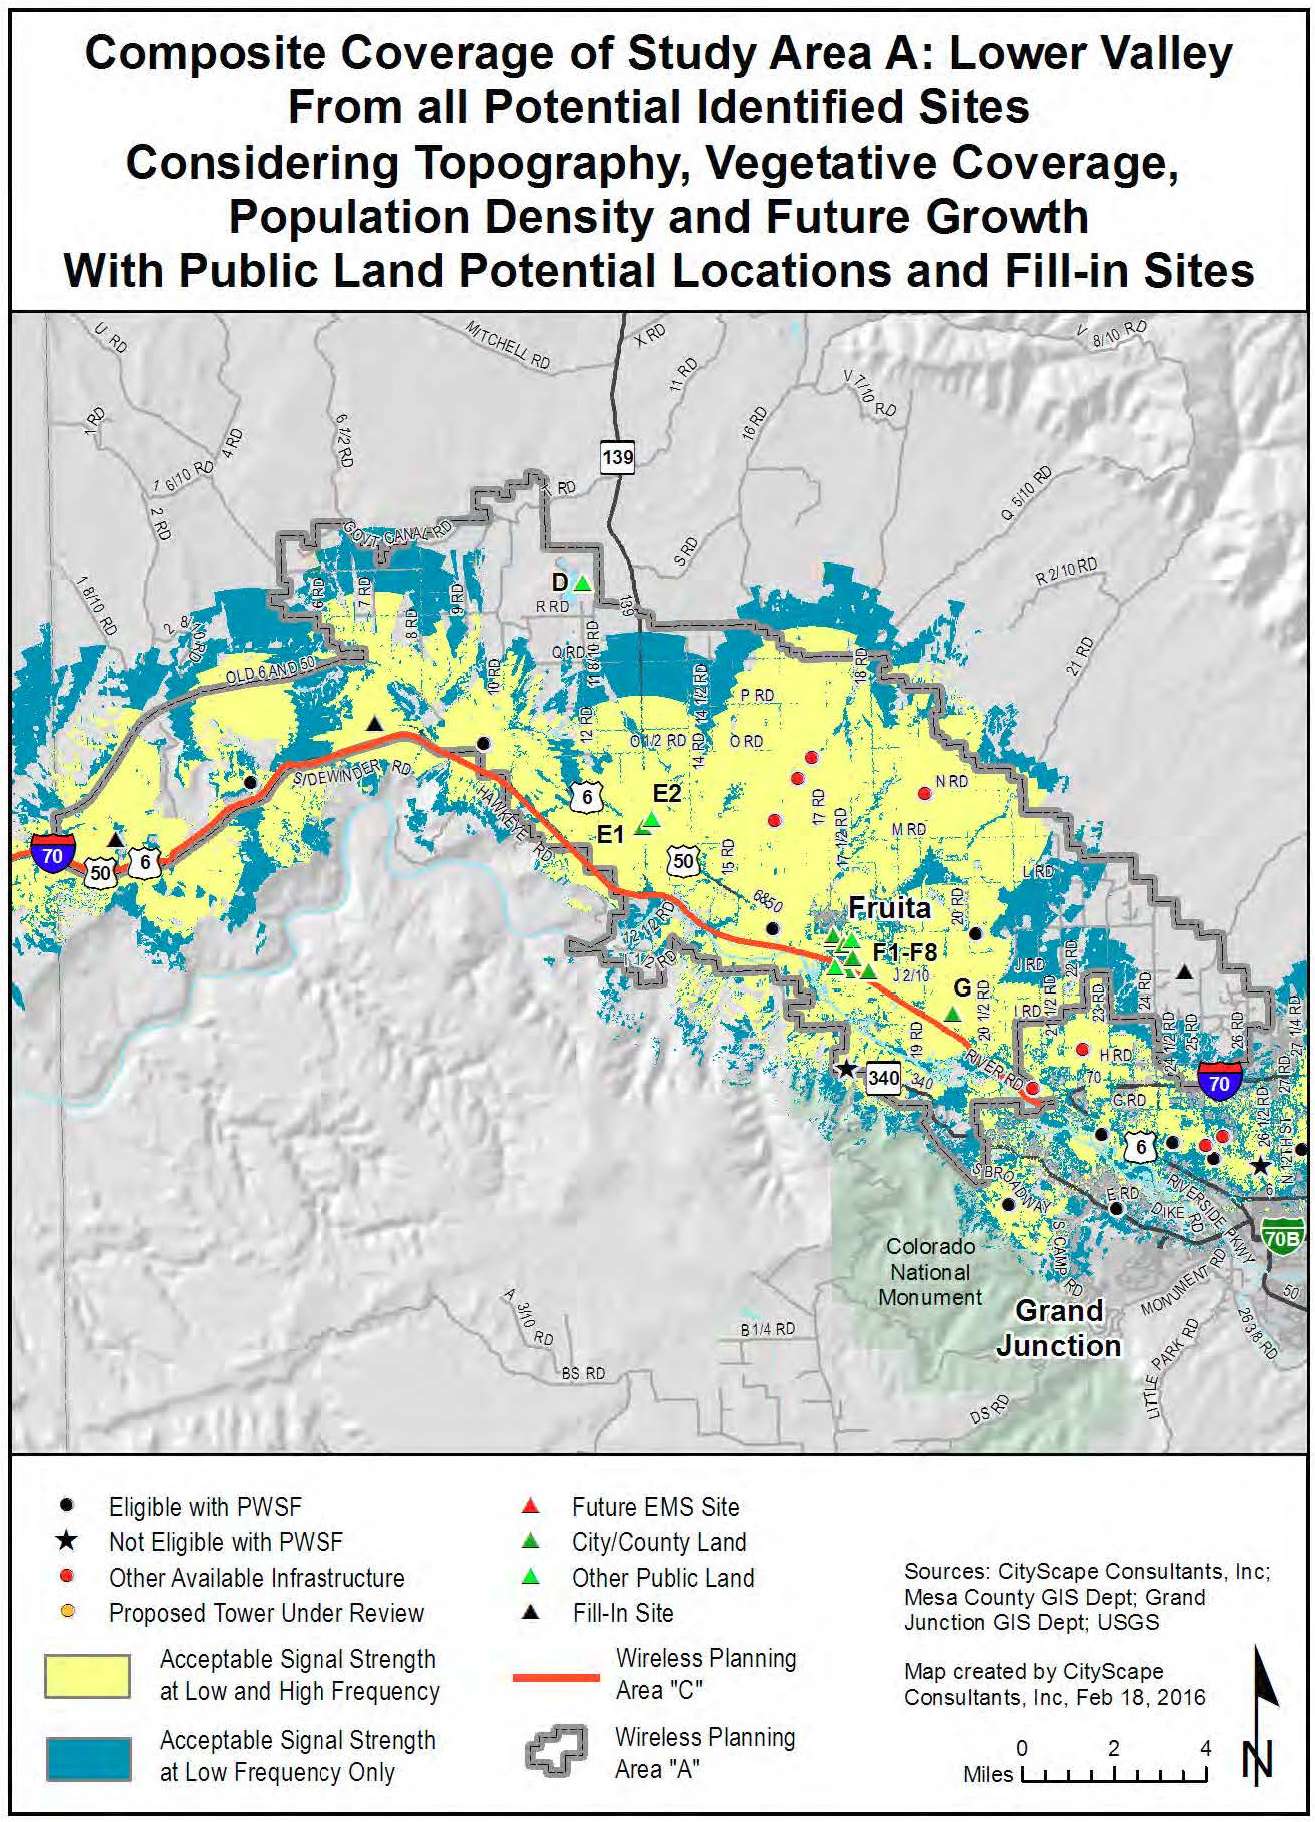
Figure 21: Coverage with Future Fill-In
(Ord. 4703, 6-1-16)
31.12.380 Palisade characteristics.
(a) Rural;
(b) 35.21 square miles;
(c) 2010 population estimate 18,642;
(d) 2030 population estimate 24,247.
(Ord. 4703, 6-1-16)
31.12.390 Palisade theoretical root mean square maps.
The following maps represent a theoretical build-out of equally distributed antennas, mounted at a tower height of 118 feet, in a perfect radio frequency environment for a single service provider that excludes topographic, vegetative cover and population density considerations. The black dot within each larger circle indicates the ideal antenna location. The smaller circle within the larger circle represents the acceptable search ring for locating the tower and antennas. Figure 22 illustrates that six towers or base stations equally distributed throughout the Palisade area would provide complete low frequency coverage to the defined study area. Figure 23 illustrates that 15 locations would be needed to provide complete high frequency coverage to the same geographic area.
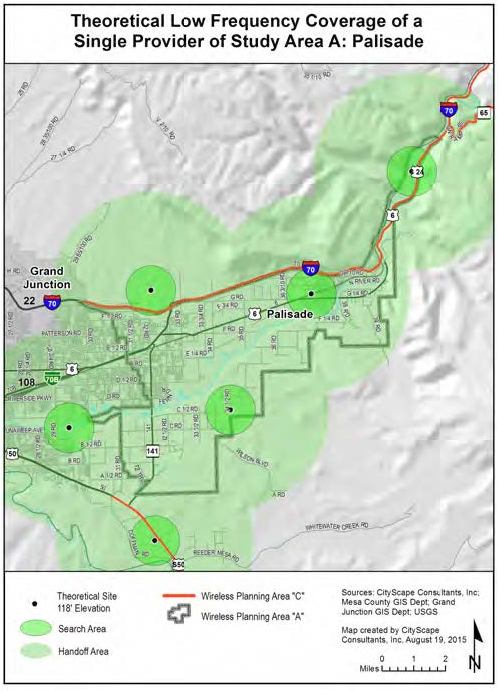
Figure 22: Theoretical Low Frequency Coverage
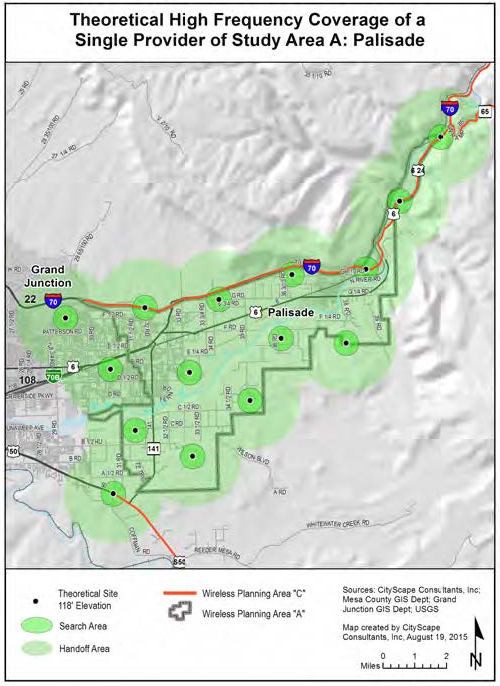
Figure 23: Theoretical High Frequency Coverage
(Ord. 4703, 6-1-16)
31.12.400 Palisade existing antenna locations.
There are 12 transmission equipment facilities in and around the Palisade Study Area. Two-thirds of these are located within a 1.5 mile perimeter of the actual study area. These outlying sites are either in the 201 Persigo Boundary or along I-70, Highway 6 or Highway 50. Three of the four sites within the Palisade Study Area are near the western boundary in close proximity to the 201 Boundary. Only one site (site 6) is not in either of these vicinities. This pattern of deployment is very common for the industry. The greatest concentration of towers and base stations are closer to the urban area along the major transportation networks.
|
Existing Total Number of Towers |
In |
Out |
Existing Total Number of Base Stations |
In |
Out |
|---|---|---|---|---|---|
|
Eligible Tower with PWSF |
3 |
5 |
Eligible Base Station with PWSF |
0 |
1 |
|
Noneligible Tower with PWSF |
0 |
0 |
Noneligible Base Station with PWSF |
0 |
0 |
|
Eligible Tower with no PWSF |
0 |
0 |
Eligible Base Station with no PWSF |
0 |
0 |
|
Noneligible Tower with no PWSF |
0 |
1 |
Noneligible Base Station with no PWSF |
0 |
1 |
|
Proposed Eligible Tower |
1 |
0 |
Proposed Eligible Base Station |
0 |
0 |
|
Total |
4 |
6 |
Total |
0 |
2 |
|
Site Numbers in the Palisade Study Area: 6, 60, 77, 128 |
|||||
|
Site Numbers within the 1.5 mile perimeter of the Palisade Study Area: 5, 48, 49, 59, 67, 68, 87, 132 |
|||||
Figure 24 identifies the location of the sites listed in Table 12 above and are represented by:
|
• |
Black dot – Eligible towers or base stations with PWSF which have been approved through a prescribed process by the appropriate local government agency. |
|
• |
Red dot – Noneligible towers or base stations (meaning infrastructure built without prior approval for construction by the appropriate local government agency). |
|
• |
Orange dot – Tower or base station that has either been approved but not yet built; or is undergoing review at the time of this publication. |
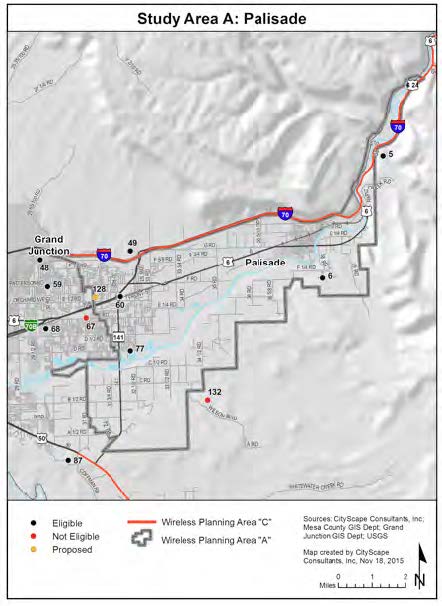
Figure 24: Existing Antenna Locations
(Ord. 4703, 6-1-16)
31.12.410 Palisade composite maps.
The service area coverage based on propagation signal strength modeling is shown for both low band frequency in yellow and high band frequency in blue on the following composite maps. The highlighted areas represent where a generally reliable signal level should be available for indoor use for both low and high bands of service.
Indoor usage is the service threshold utilized for composite modeling because it represents the lowest signal strength acceptable after considering the signal loss that occurs from building penetration. Outdoor signal strength in the same area will usually be higher than indoor signal strength. Generally the closer the subscriber is to the facility the more reliable the service. A subscriber further from the facility will have less reliable service. As the subscriber gets closer to the edge of the yellow or blue area, the signal strength becomes more prone to degradation, particularly as usage in the area increases or environmental conditions worsen. Areas of gray on the map indicate where the subscriber will experience weak, unpredictable levels of signal strength, or no service at all. Filling in these coverage gaps would require the installation of additional antennas and corresponding construction of more towers or the identification of buildings that would serve as base stations.
Figure 25 illustrates current theoretical coverage for one service provider operating in the low or high frequency assuming they had equipment on each inventoried facility. Figure 26 shows how population growth and technology changes will affect the current coverage model shown in Figure 25.
Both composite maps have included the expected effects of terrain, vegetative cover, and current population density variables. The antenna mounting elevation in both figures is assumed to be at the top of the towers and base stations where the height is known or at 118 feet where unknown.
Figures 25 and 26 identify the location of the inventory sites categorized as follows:
|
• |
Black dot – Eligible towers or base stations with PWSF |
|
★ |
Black star – Noneligible towers or base stations without PWSF |
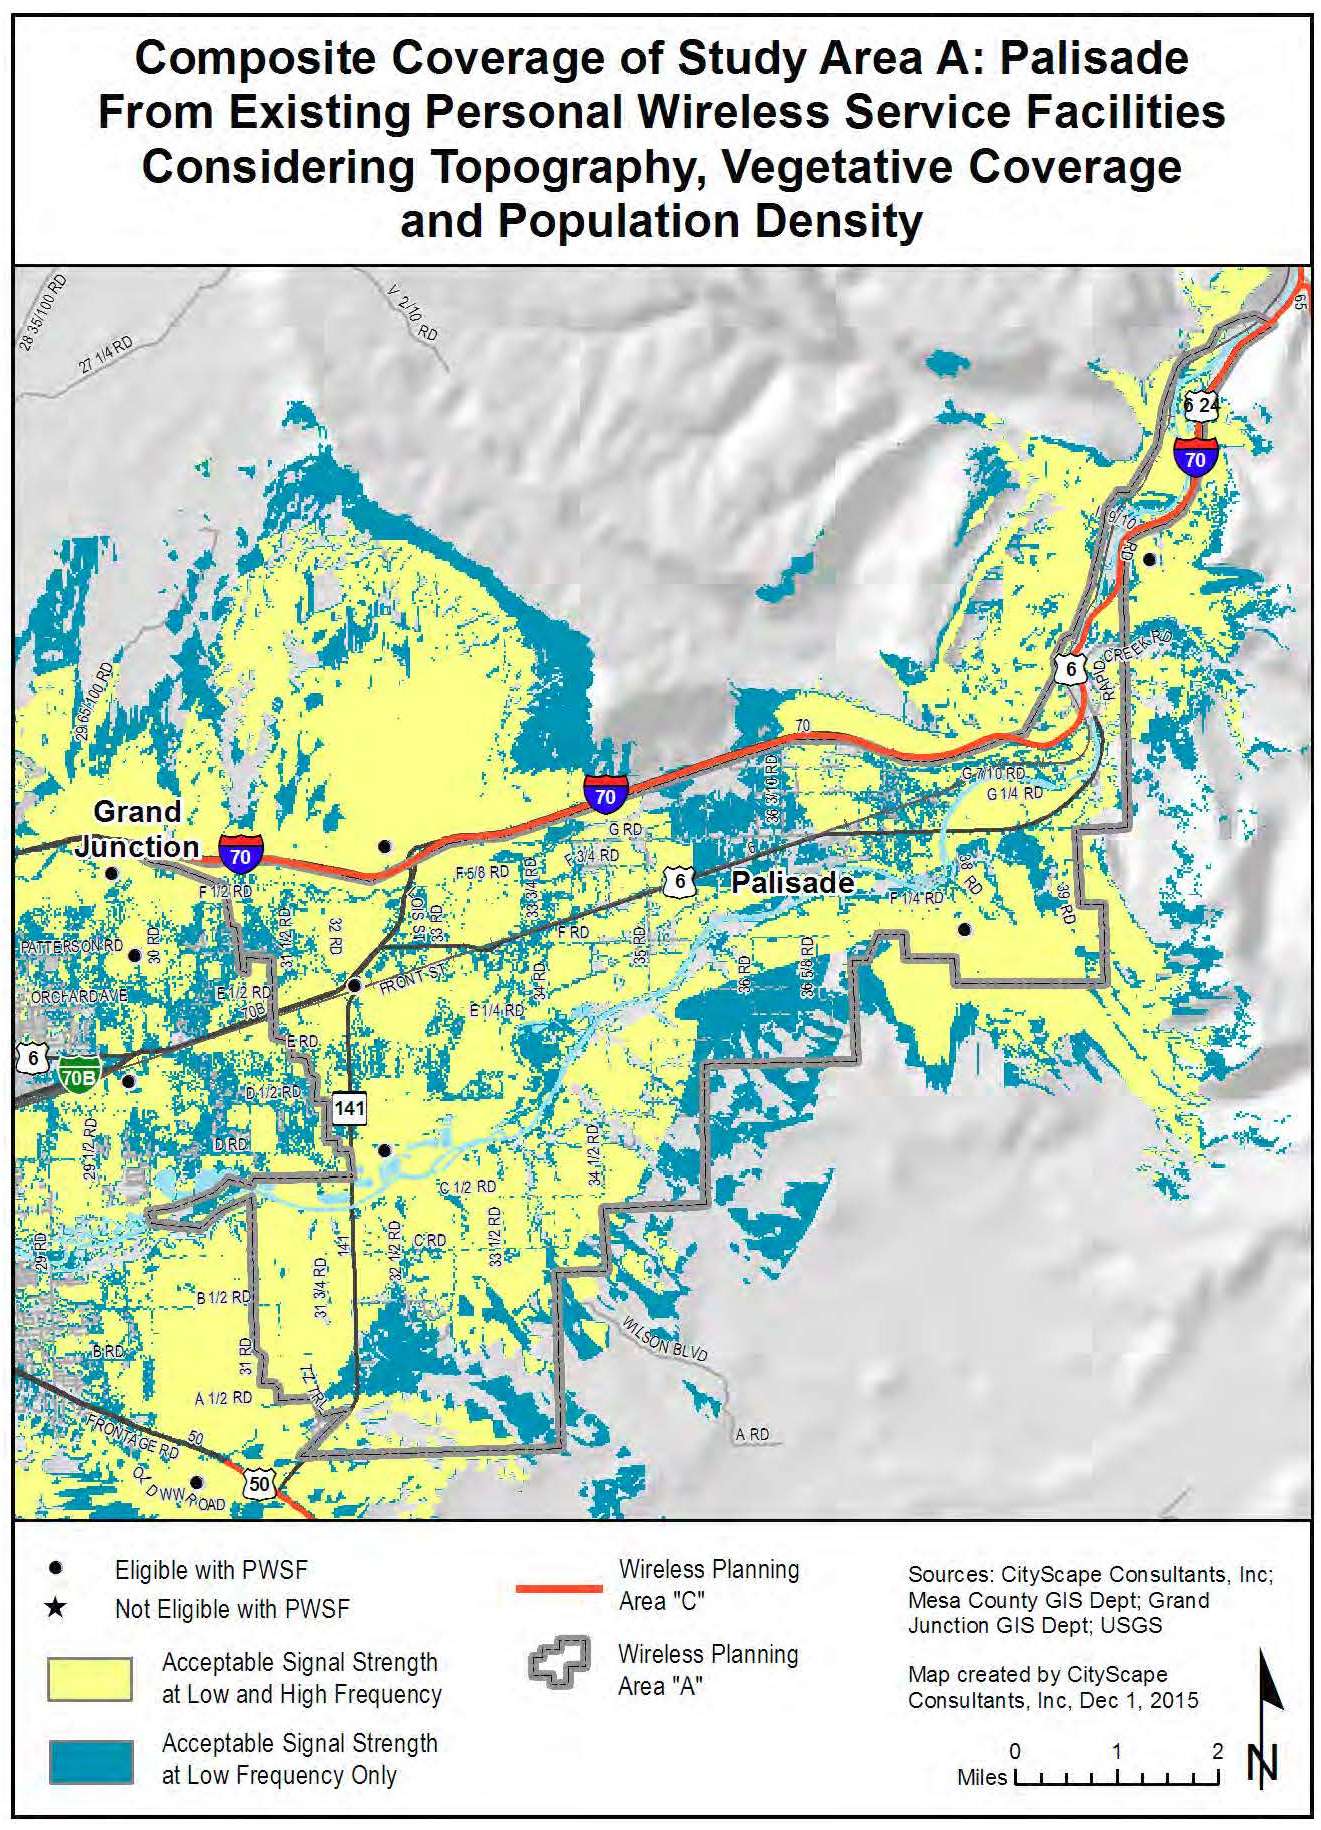
Figure 25: Current Potential Coverage
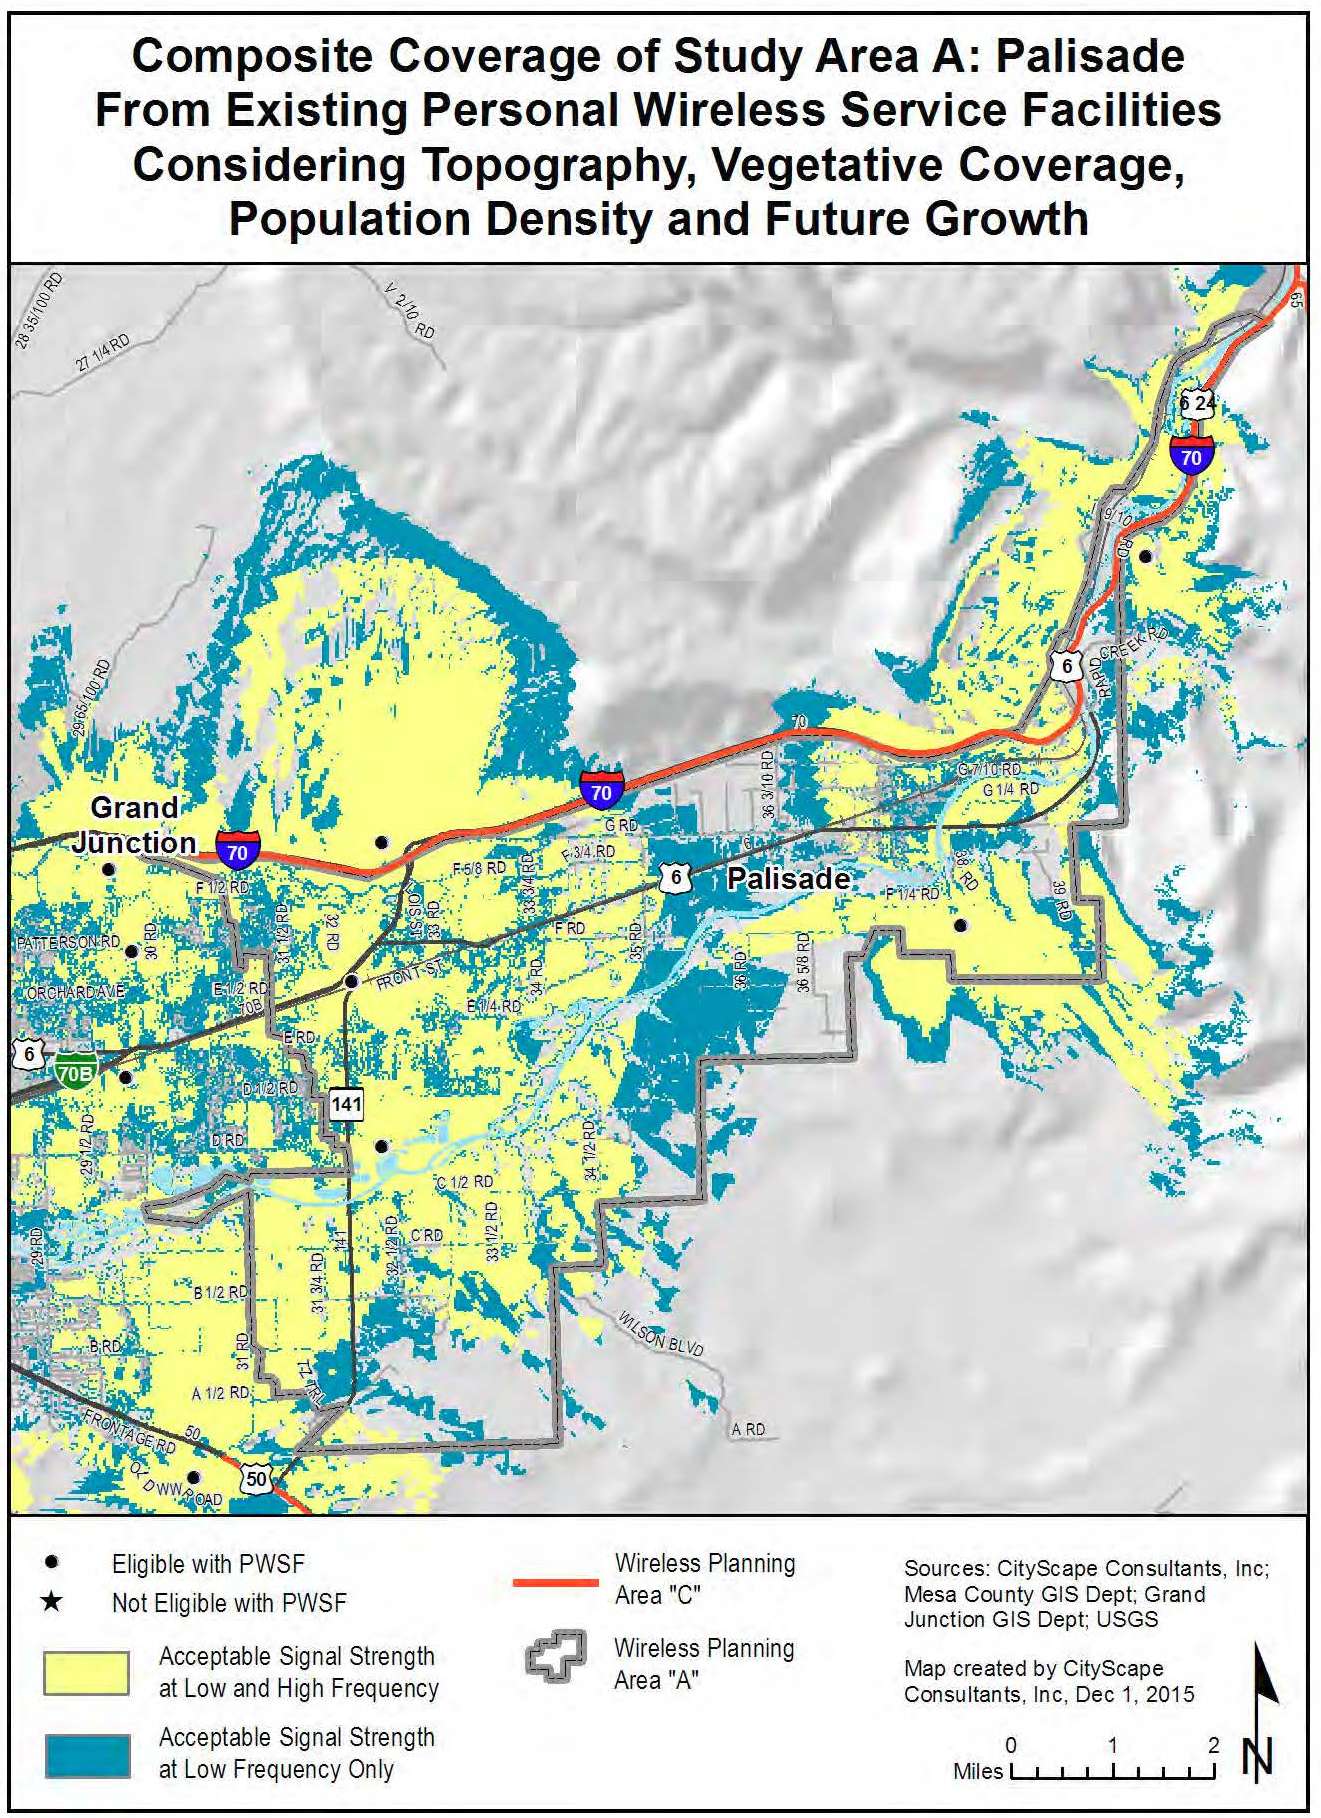
Figure 26: Current Potential Coverage Including Future Growth
(Ord. 4703, 6-1-16)
31.12.420 Palisade estimation of future antenna sites.
Due to the rural characteristics of the Palisade Study Area, CityScape estimates that about six new towers or base stations will be needed over the next 10 to 15 years located along the corridors of I-70, Highway 141 and Highway 50. The fill-in map, shown in Figure 27, includes the six new sites which will provide almost complete coverage for the Palisade Study Area.
These estimates are based on the expected changes in population density, subscriber base and usage, daily transient movement throughout the study area and the number of calls a facility can service at any given time. The projections consider coverage, capacity, and broadband network objectives and take into consideration terrain, population and proposed maximum infrastructure height variables. The projection model that CityScape designed assumes that all existing tower and base station locations will be used for maximum co-location opportunities in an effort to reduce the number of new towers and base stations required within a given geographic area. Should the industry not maximize the use of existing facilities, a greater number of towers will need to be constructed over this same time period. It should also be noted that even with this increase in new facilities, some areas within the study area will still be underserved due to the terrain and to the rural characteristics of portions of the study area.
CityScape has reviewed the gaps in network coverage in comparison to the location of publicly owned properties and considered the impact that placing a tower on those properties would have on network and public safety coverage. When publicly owned property is used for new tower or base station construction, the community, represented by their local government agency, is assured that their preferences for tower types and concealment technology are followed. As public properties are developed, the infrastructure installed becomes the precedent for how future sites should be developed on both public and private land. For example, many slick sticks and flagpole towers are available to the industry as are other creative concealment techniques. Some are more aesthetically pleasing and more practical than other types. As the local government adopts preferred products on publicly owned property, their application become the standard for future tower sites developed on public and private land within their zoning jurisdiction. Leasing public properties to tower builders and tenant carriers for new wireless infrastructure can also create new sources of public revenue. Additionally, having a tower on public property results in an asset for the local government that is available for emergency services radio and wireless broadband equipment use.
Figure 27 indicates how certain geographic areas would benefit with improved network coverage from the addition of the publicly owned properties. Table 13 identifies potential public property fill-in sites. Tower type preferences are not provided in the recommendation column because the property has not been vetted by the local planning agency.
|
Public Site ID |
Owner |
Location |
Address |
Parcel Number |
Acreage |
Site-Specific Recommendation |
|---|---|---|---|---|---|---|
|
Q |
Colorado Department of Highways |
Palisade |
816 35 8/10 Road |
2937-063-00-924 |
10.241 |
Not Determined |
|
R1 |
Town of Palisade |
Palisade |
175 E Third Street |
2937-091-04-941 |
0.95 |
Not Determined |
|
R2 |
Town of Palisade |
Palisade |
120 W Eighth Street |
2937-093-36-941 |
2.476 |
Not Determined |
|
R3 |
Town of Palisade |
Palisade |
571 W Fifth Street |
2937-093-00-940 |
2.875 |
Not Determined |
|
R4 |
Town of Palisade |
Palisade |
711 Iowa Avenue |
2937-093-37-943 |
3.189 |
Not Determined |
|
S |
East Orchard Fire Protection District |
Palisade |
544 35 1/2 Road |
2941-084-00-944 |
1.108 |
Not Determined |
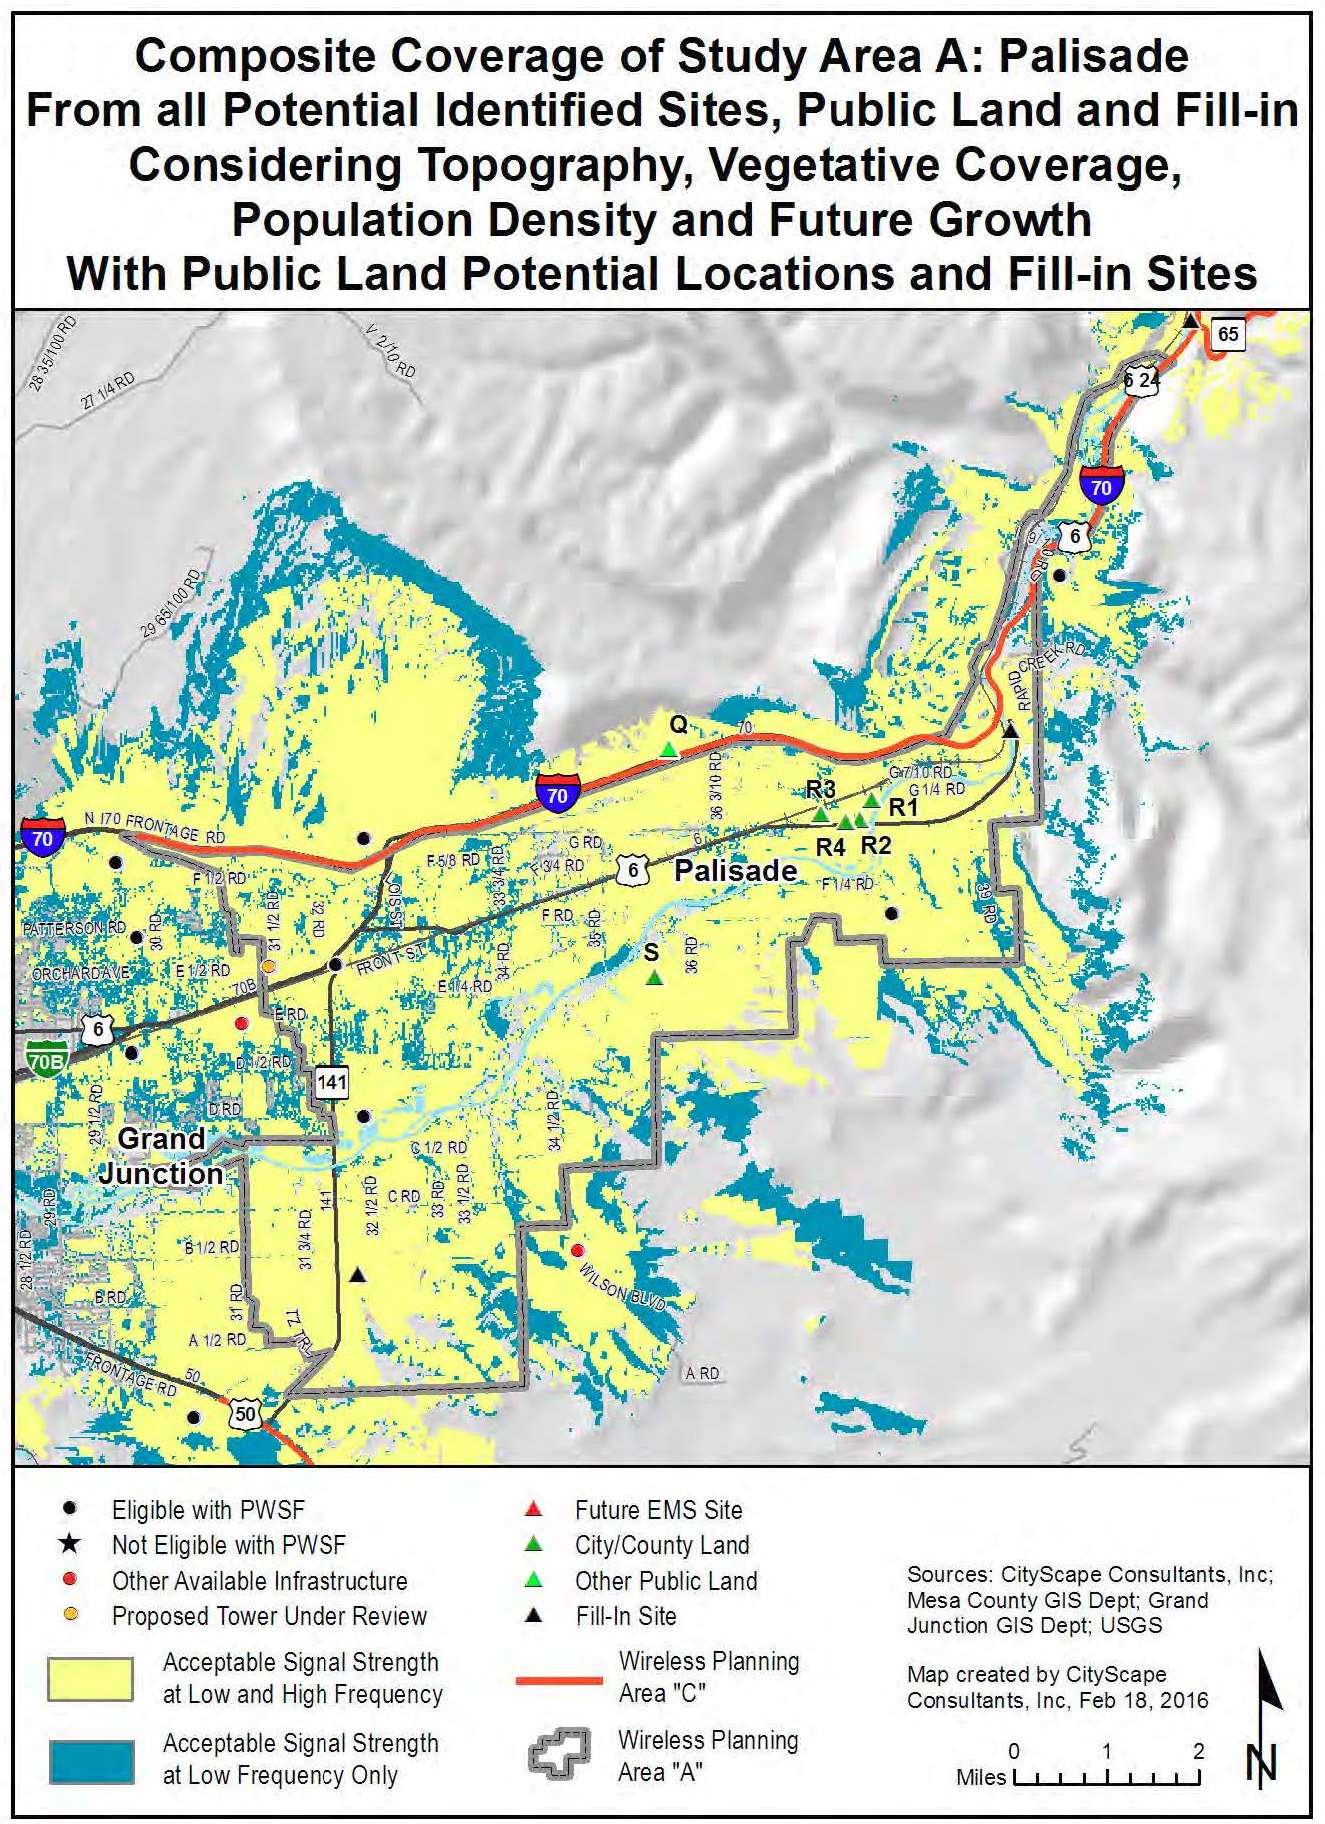
Figure 27: Coverage with Future Fill-In
(Ord. 4703, 6-1-16)
31.12.430 DeBeque characteristics.
(a) Rural.
(b) 30.34 square miles.
(c) 2010 population estimate 808.
(d) 2030 population estimate 1,096.
(Ord. 4703, 6-1-16)
31.12.440 DeBeque theoretical root mean square maps.
The following maps represent a theoretical build-out of equally distributed antennas, mounted at a tower height of 118 feet, in a perfect radio frequency environment for a single service provider that excludes topographic, vegetative cover and population density considerations. The black dot within each larger circle indicates the ideal antenna location. The smaller circle within the larger circle represents the acceptable search ring for locating the tower and antennas. Figure 28 illustrates that three towers or base stations equally distributed throughout the DeBeque Study Area would provide complete low frequency coverage to the defined study area. Figure 29 illustrates nine locations would be needed to provide complete high frequency coverage to the same geographic area.
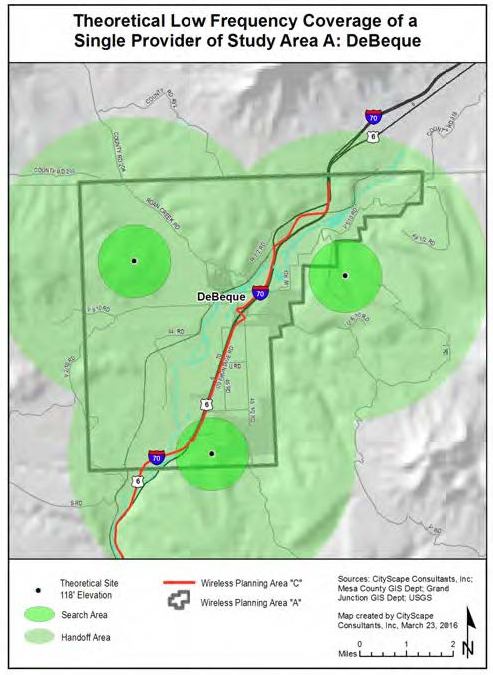
Figure 28: Theoretical Low Frequency Coverage
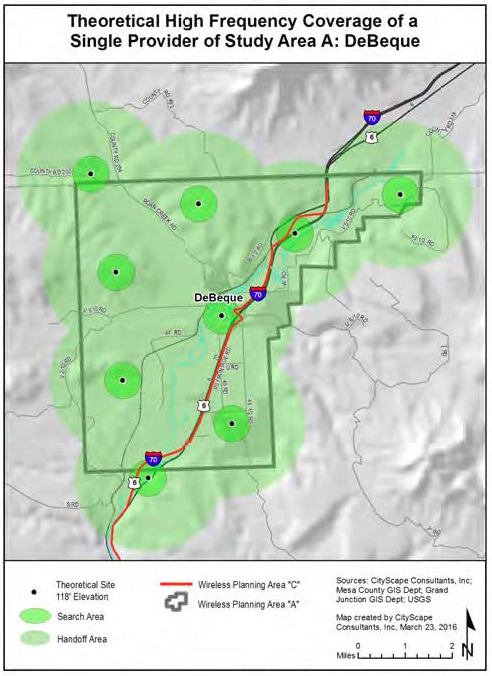
Figure 29: Theoretical High Frequency Coverage
(Ord. 4703, 6-1-16)
31.12.450 DeBeque existing antenna locations.
Of the three geographic regions included in Study Area A, the DeBeque Study Area is the least populated. There are two equipment communication facilities within the DeBeque Study Area and both of the towers are equipped with PWSF. Both towers are located parallel to I-70 with the intent of serving that corridor.
|
Existing Total Number of Towers |
In |
Out |
Existing Total Number of Base Stations |
In |
Out |
|---|---|---|---|---|---|
|
Eligible Tower with PWSF |
2 |
0 |
Eligible Base Station with PWSF |
0 |
0 |
|
Noneligible Tower with PWSF |
0 |
0 |
Noneligible Base Station with PWSF |
0 |
0 |
|
Eligible Tower with no PWSF |
0 |
0 |
Eligible Base Station with no PWSF |
0 |
0 |
|
Noneligible Tower with no PWSF |
0 |
0 |
Noneligible Base Station with no PWSF |
0 |
0 |
|
Proposed Eligible Tower |
0 |
0 |
Proposed Eligible Base Station |
0 |
0 |
|
Total |
2 |
0 |
Total |
0 |
0 |
|
Site Numbers in the DeBeque Study Area: 1, 2 |
|||||
|
Site numbers within the 1.5 mile perimeter of the DeBeque Study Area: None |
|||||
Figure 30 identifies the location of the sites listed in Table 14 above and are represented by:
|
• |
Black dot – Eligible towers or base stations with PWSF which have been approved through a prescribed process by the appropriate local government agency. |
|
• |
Red dot – Noneligible towers or base stations (meaning infrastructure built without prior approval for construction by the appropriate local government agency). |
|
• |
Orange dot – Tower or base station that has either been approved but not yet built; or is undergoing review at the time of this publication. |
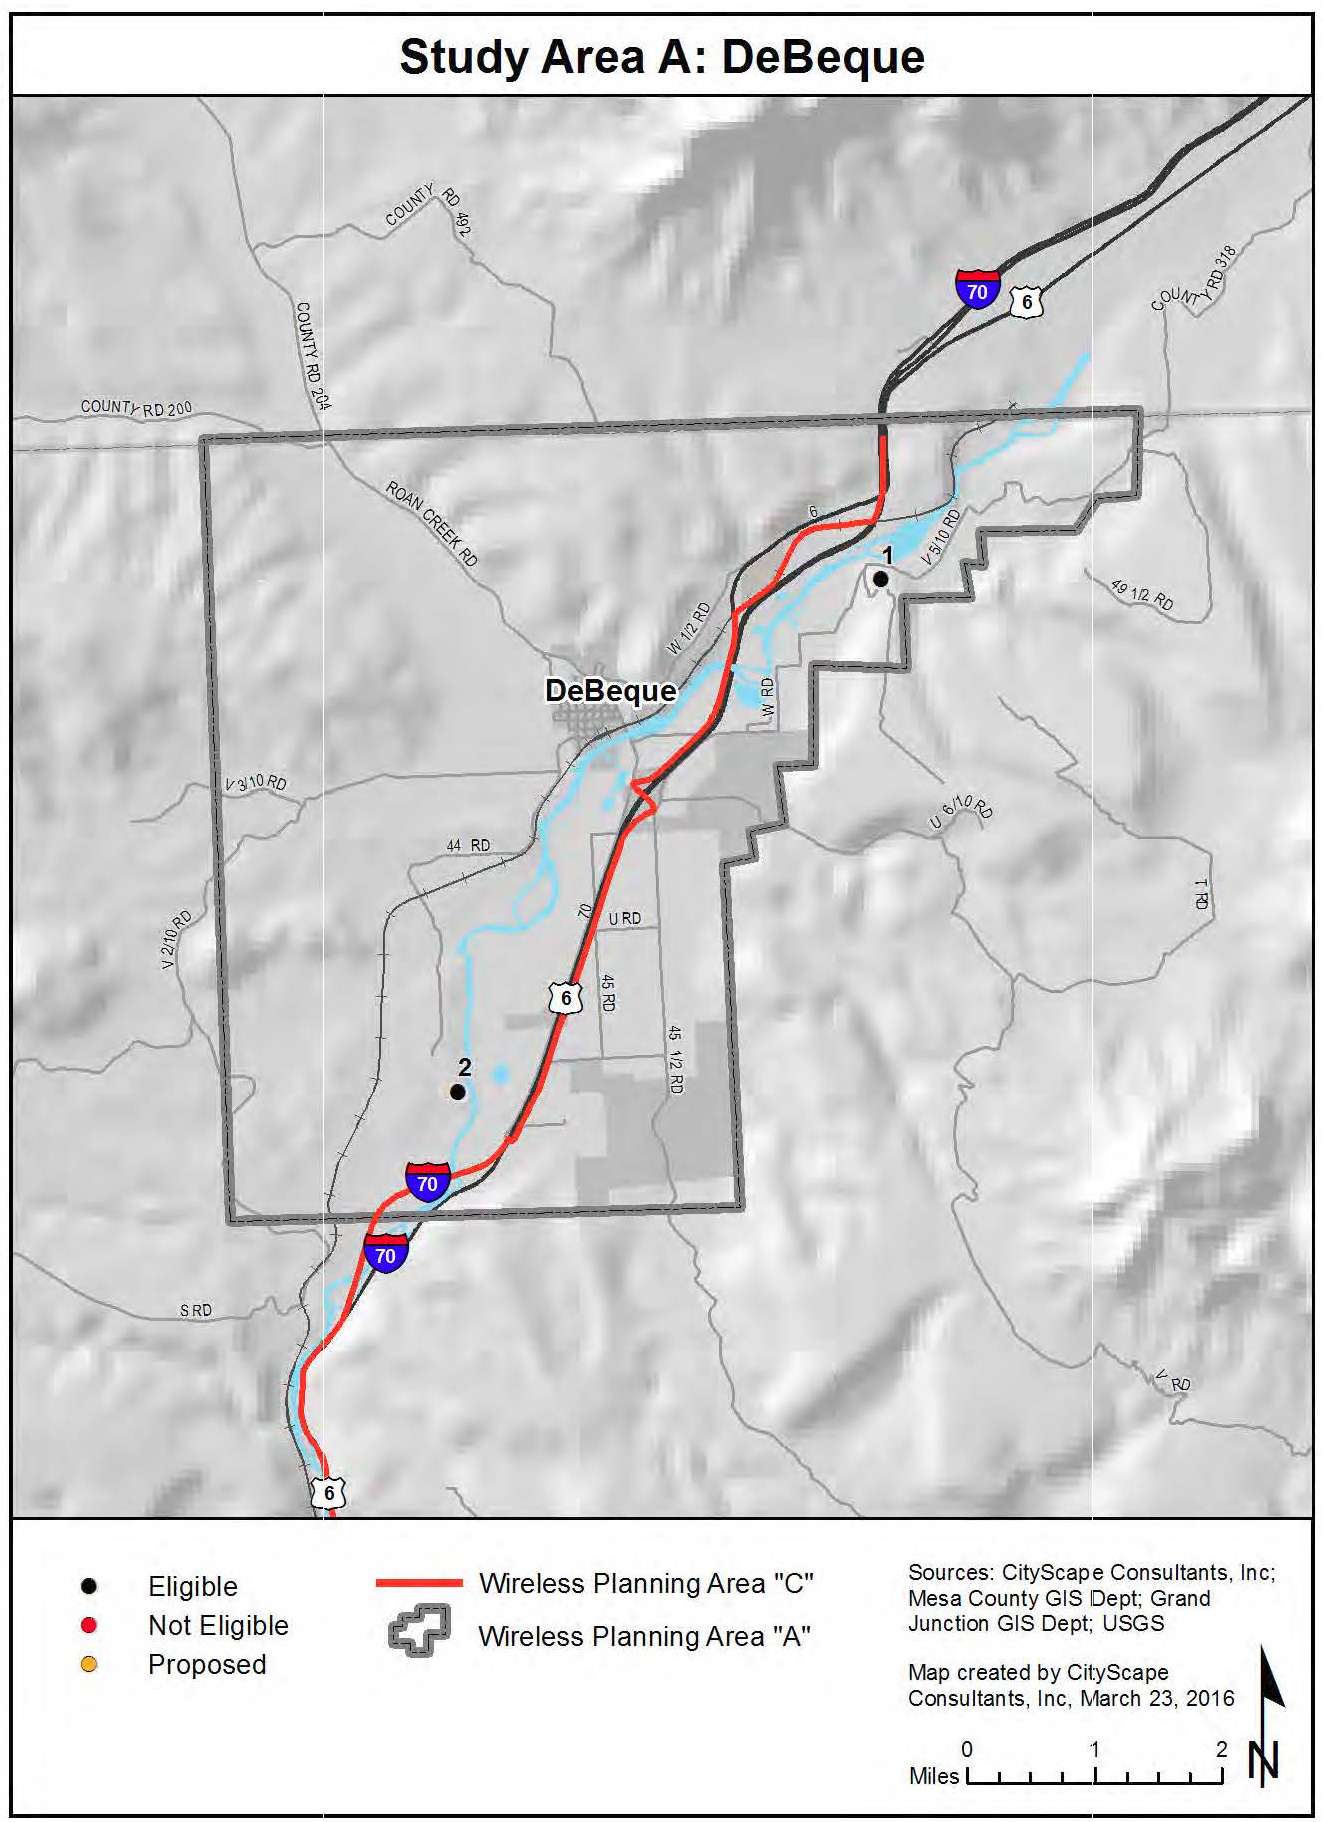
Figure 30: Existing Antenna Locations
(Ord. 4703, 6-1-16)
31.12.460 DeBeque composite maps.
The service area coverage based on propagation signal strength modeling is shown for both low band frequency in yellow and high band frequency in blue on the following composite maps. The highlighted areas represent where a generally reliable signal level should be available for indoor use for both low and high bands of service.
Indoor usage is the service threshold utilized for composite modeling because it represents the lowest signal strength acceptable after considering the signal loss that occurs from building penetration. Outdoor signal strength in the same area will usually be higher than indoor signal strength. Generally the closer the subscriber is to the facility the more reliable the service. A subscriber further from the facility will have less reliable service. As the subscriber gets closer to the edge of the yellow or blue area, the signal strength becomes more prone to degradation, particularly as usage in the area increases or environmental conditions worsen. Areas of gray on the map indicate where the subscriber will experience weak, unpredictable levels of signal strength, or no service at all. Filling in these coverage gaps would require the installation of additional antennas and corresponding construction of more towers or the identification of buildings that would serve as base stations.
Figure 31 illustrates current theoretical coverage for one service provider operating in the low or high band frequency assuming they had equipment on each facility. Figure 32 shows how population growth and technology changes will affect the current coverage model shown in Figure 31.
Both composite maps have included the expected effects of terrain, vegetative cover, and current population density variables. The antenna mounting elevation in both figures is assumed to be at the top of the towers and base stations where the height is known or at 118 feet where unknown.
Figures 31 and 32 identify the location of the inventory sites categorized as follows:
|
• |
Black dot – Eligible towers or base stations with PWSF |
|
★ |
Black star – Noneligible towers or base stations without PWSF |
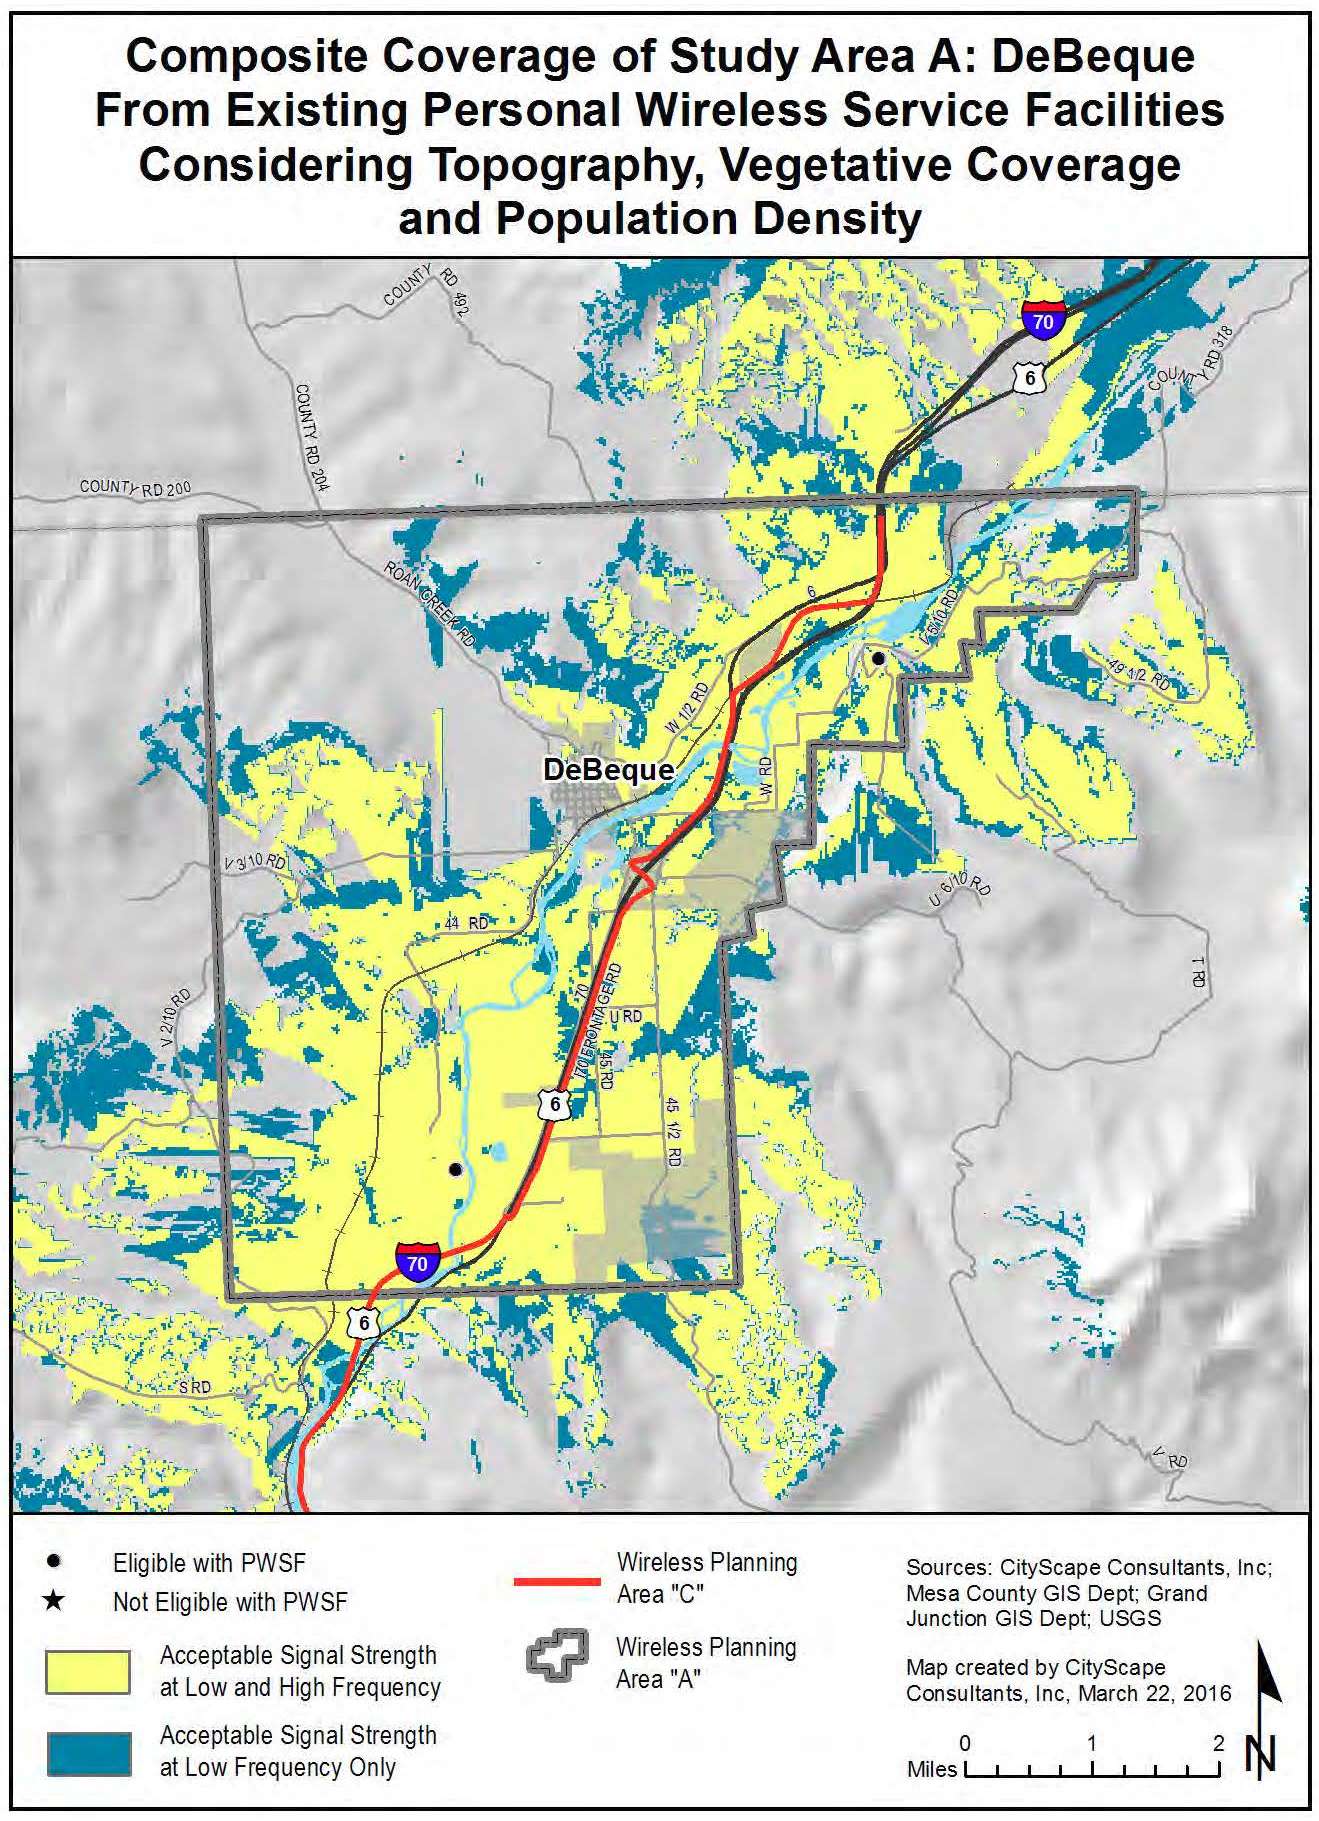
Figure 31: Current Potential Coverage
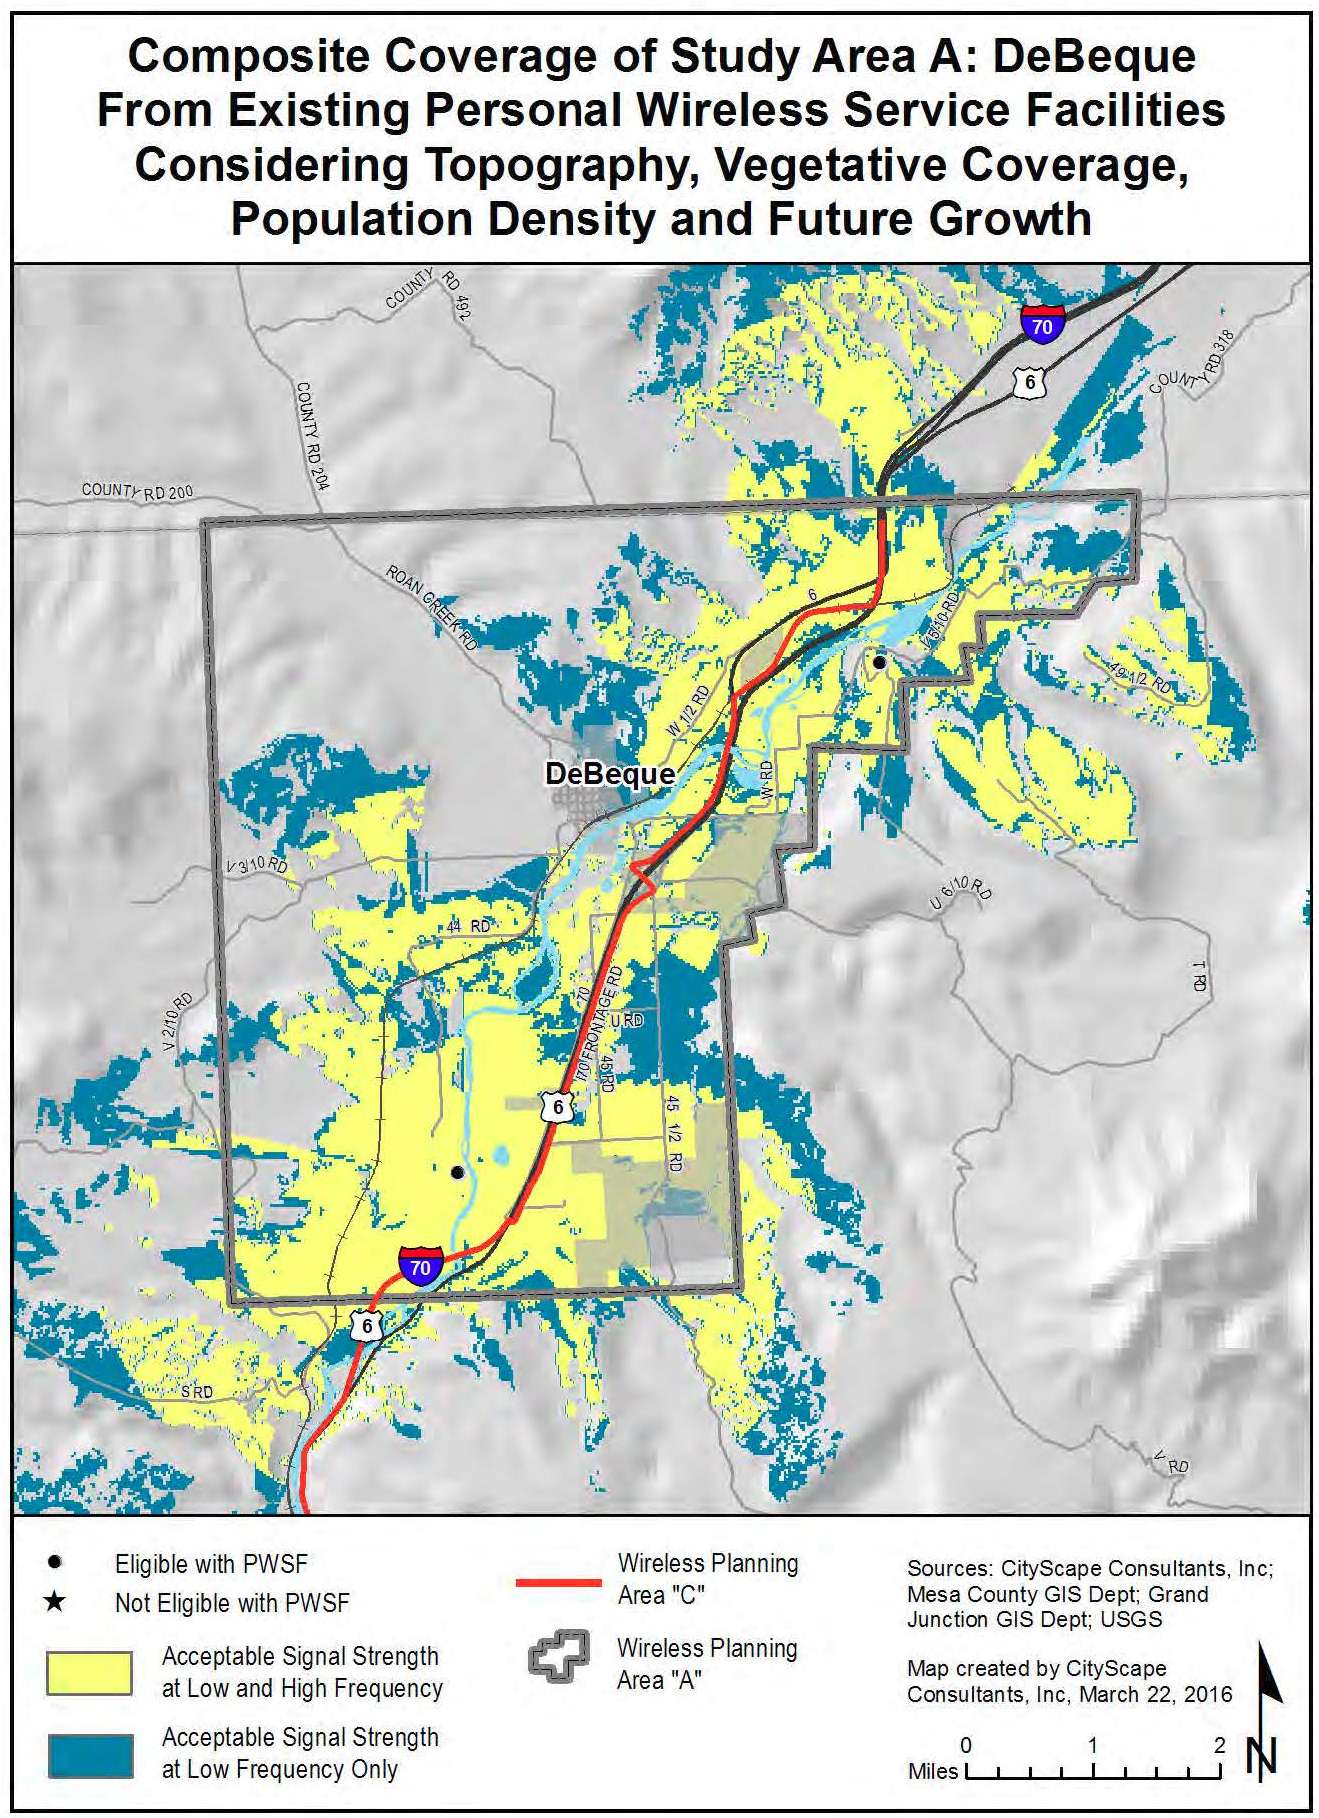
Figure 32: Current Potential Coverage Including Future Growth
(Ord. 4703, 6-1-16)
31.12.470 DeBeque estimation of future antenna sites.
Due to the rural characteristics of the DeBeque Study Area, CityScape estimates that approximately three new sites will be needed in the next 10 to 15 years: one along the I-70 corridor, one in the town of DeBeque and one in the northwest quadrant of the study area. It is likely that the I-70 site will be constructed first, with the other two sites possibly being added in the distant future. The fill-in map in Figure 33 illustrates great improvement to the I-70 corridor coverage with one new site and almost complete coverage for the study area with the construction of all three sites.
These estimates are based on the expected changes in population density, subscriber base and usage, daily transient movement throughout the study area and the number of calls a facility can service at any given time. The projections consider coverage, capacity, and broadband network objectives and take into consideration terrain, population and proposed maximum infrastructure height variables. The projection model that CityScape designed assumes that all existing tower and base station locations will be used for maximum co-location opportunities in an effort to reduce the number of new towers and base stations required within a given geographic area. Should the industry not maximize the use of existing facilities, a greater number of towers will need to be constructed over this same time period. It should also be noted that even with this increase in new facilities, some areas within the study area will still be underserved due to the terrain and to the rural characteristics of the study area.
CityScape has reviewed the gaps in network coverage in comparison to the location of publicly owned properties and considered the impact that placing a tower on those properties would have on network and public safety coverage. When publicly owned property is used for new tower or base station construction, the community, represented by their local government agency, is assured that their preferences for tower types and concealment technology are followed. As public properties are developed, the infrastructure installed becomes the precedent for how future sites should be developed on both public and private land. For example, many slick sticks and flagpole towers are available to the industry as are other creative concealment techniques. Some are more aesthetically pleasing and more practical than other types. As the local government adopts preferred products on publicly owned property, their application becomes the standard for future tower sites developed on public and private land within their zoning jurisdiction. Leasing public properties to tower builders and tenant carriers for new wireless infrastructure can also create new sources of public revenue. Additionally, having a tower on public property results in an asset for the local government that is available for emergency services radio and wireless broadband equipment use.
Figure 33 indicates how certain geographic areas would benefit with improved network coverage from the addition of the publicly owned properties. Table 15 identifies potential public property fill-in sites. Tower type preferences are not provided in the recommendation column because the property has not been vetted by the local planning agency.
|
Public Site ID |
Owner |
Location |
Address |
Parcel Number |
Acreage |
Site-Specific Recommendation |
|---|---|---|---|---|---|---|
|
A |
Joint School District 49 |
DeBeque |
|
2445-213-00-942 |
20.575 |
Not Determined |
|
B1 |
DeBeque Fire Protection District |
DeBeque |
4580 I70 Frontage Road |
2445-274-00-944 |
5.86 |
Not Determined |
|
B2 |
Town of DeBeque |
DeBeque |
414 Rouse Avenue |
2445-272-00-943 |
61.767 |
Not Determined |
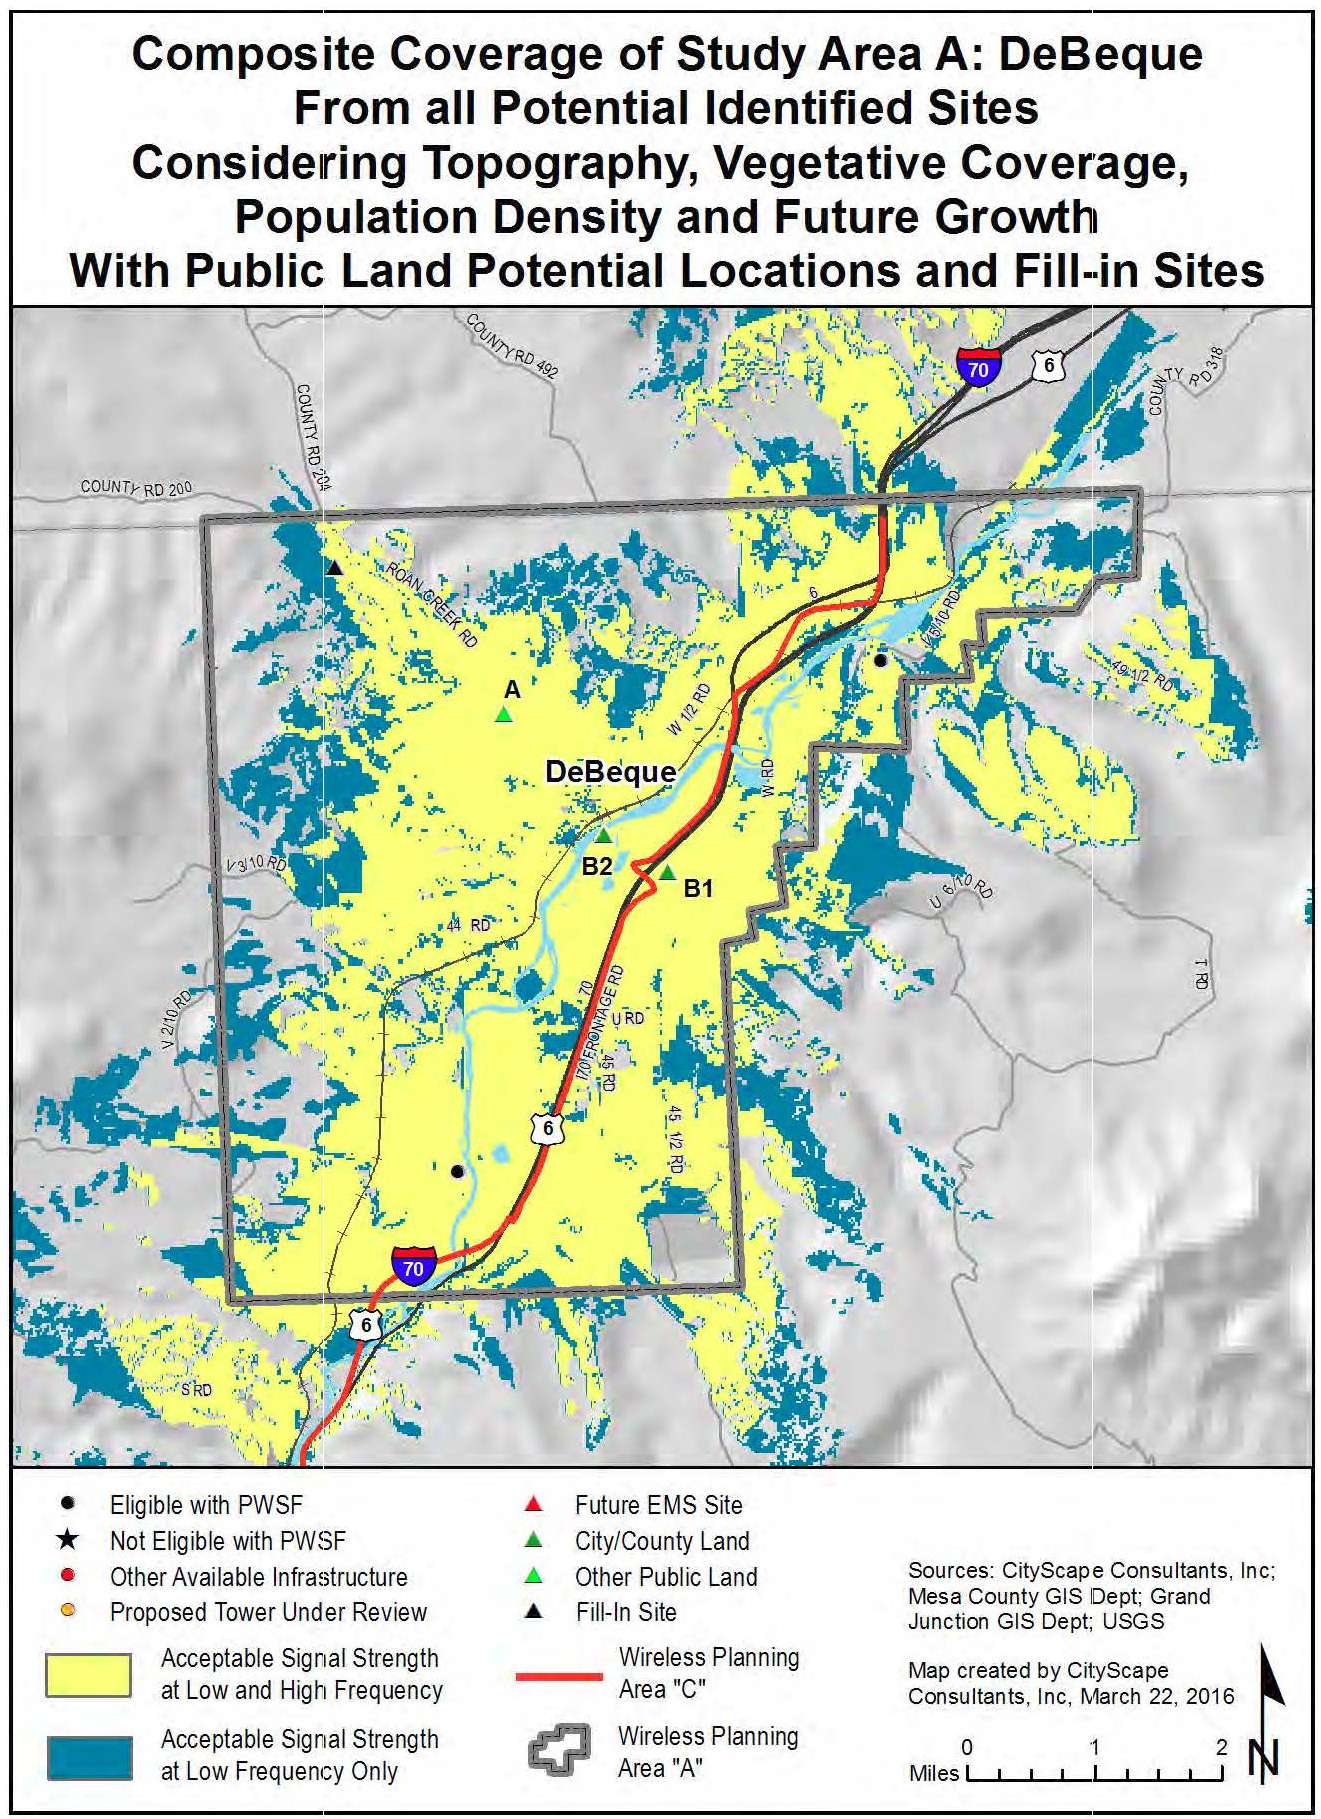
Figure 33: Coverage with Future Fill-In
(Ord. 4703, 6-1-16)
31.12.480 Glade Park characteristics.
(a) Undeveloped.
(b) 387.86 square miles.
(c) 2010 population estimate 1,664.
(d) 2030 population estimate 1,956.
(Ord. 4703, 6-1-16)
31.12.490 Glade Park theoretical root mean square maps.
The following maps represent a theoretical build-out of equally distributed antennas, mounted at a tower height of 118 feet, in a perfect radio frequency environment for a single service provider that excludes topographic, vegetative cover and population density considerations. The black dot within each larger circle indicates the ideal antenna location. The smaller circle within the larger circle represents the acceptable search ring for locating the tower and antennas.
Figure 34 illustrates that 26 towers or base stations equally distributed throughout the Glade Park Study Area would provide complete low frequency coverage to the defined study area. Figure 35 illustrates that 89 locations would be needed to provide complete high frequency coverage to the same geographic area.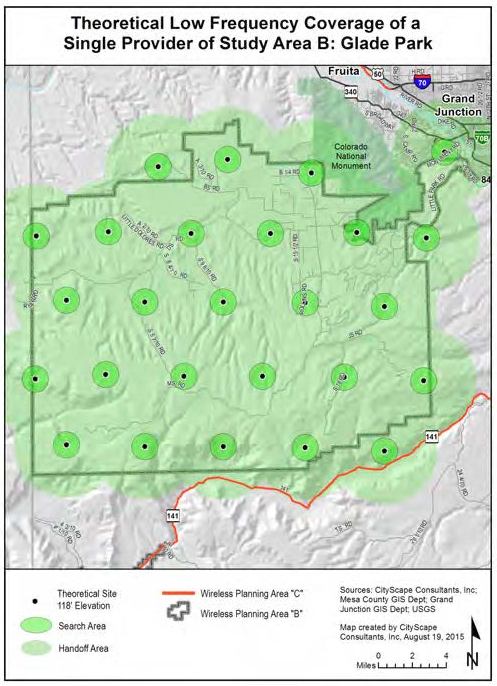
Figure 34: Theoretical Low Frequency Coverage
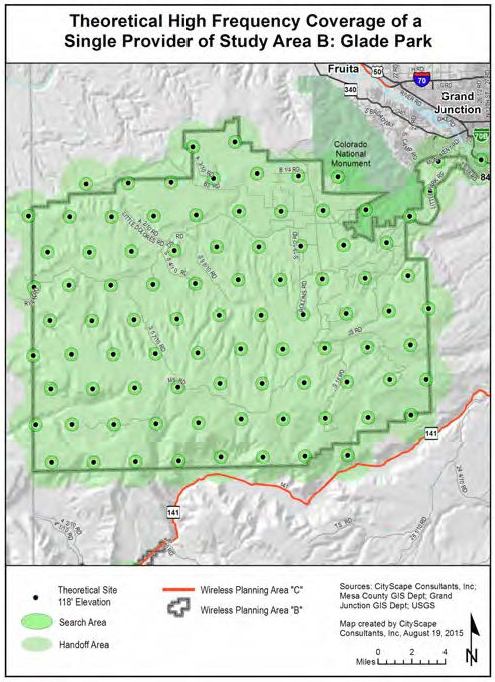
Figure 35: Theoretical High Frequency Coverage
(Ord. 4703, 6-1-16)
31.12.500 Glade Park existing antenna locations.
There are no towers or base stations within the Glade Park Study Area. All 26 sites listed below are outside the study area and within either the Persigo 201 Boundary or in a tower cluster located on Blackridge above the Colorado National Monument. The low population density and seasonal tourist and recreational visitors do not meet industry criteria for additional infrastructure within the study area at this time.
|
Existing Total Number of Towers |
In |
Out |
Existing Total Number of Base Stations |
In |
Out |
|---|---|---|---|---|---|
|
Eligible Tower with PWSF |
0 |
4 |
Eligible Base Station with PWSF |
0 |
1 |
|
Noneligible Tower with PWSF |
0 |
0 |
Noneligible Base Station with PWSF |
0 |
0 |
|
Eligible Tower with no PWSF |
0 |
1 |
Eligible Base Station with no PWSF |
0 |
0 |
|
Noneligible Tower with no PWSF |
0 |
21 |
Noneligible Base Station with no PWSF |
0 |
2 |
|
Proposed Eligible Tower |
0 |
0 |
Proposed Eligible Base Station |
0 |
0 |
|
Total |
0 |
26 |
Total |
0 |
3 |
|
Site numbers in the Glade Park Study Area: None |
|||||
|
Site numbers within the 1.5 mile perimeter of the Glade Park Study Area: 71 – 75, 81 – 85, 88 – 102, 141 |
|||||
Figure 36 identifies the location of the sites listed in Table 16 above and are represented by:
|
• |
Black dot – Eligible towers or base stations with PWSF which have been approved through a prescribed process by the appropriate local government agency. |
|
• |
Red dot – Noneligible towers or base stations (meaning infrastructure built without prior approval for construction by the appropriate local government agency). |
|
• |
Orange dot – Tower or base station that has either been approved but not yet built; or is undergoing review at the time of this publication. |
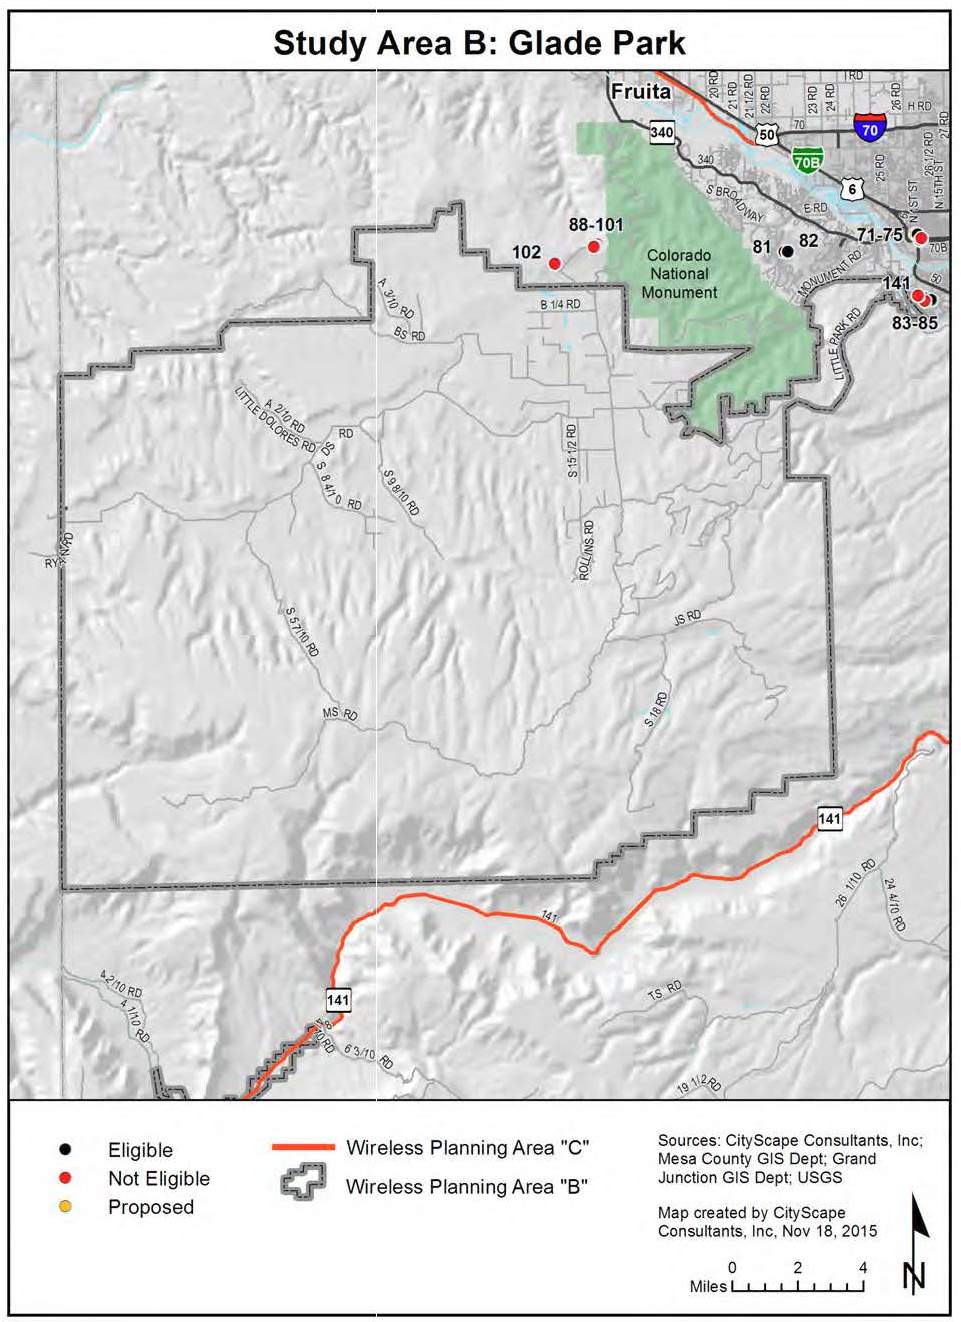
Figure 36: Existing Antenna Locations
(Ord. 4703, 6-1-16)
31.12.510 Glade Park composite maps.
The service area coverage based on propagation signal strength modeling is shown for both low band frequency in yellow and high band frequency in blue on the following composite maps. The highlighted areas represent where a generally reliable signal level should be available for indoor use for both low and high bands of service.
Indoor usage is the service threshold utilized for composite modeling because it represents the lowest signal strength acceptable after considering the signal loss that occurs from building penetration. Outdoor signal strength in the same area will usually be higher than indoor signal strength. Generally the closer the subscriber is to the facility the more reliable the service. A subscriber further from the facility will have less reliable service. As the subscriber gets closer to the edge of the yellow or blue area, the signal strength becomes more prone to degradation, particularly as usage in the area increases or environmental conditions worsen. Areas of gray on the map indicate where the subscriber will experience weak, unpredictable levels of signal strength, or no service at all. Filling in these coverage gaps would require the installation of additional antennas and corresponding construction of more towers or the identification of buildings that would serve as base stations.
Figure 37 illustrates current theoretical coverage for one service provider operating in the low or high frequency assuming they had equipment on each facility. Figure 38 shows how population growth and technology changes will affect the current coverage model shown in Figure 37. There appears to be very little difference between Figures 37 and 38 due to the scale of the map and the height of the existing tower.
Both composite maps have included the expected effects of terrain, vegetative cover, and current population density variables. The antenna mounting elevation in both figures is assumed to be at the top of the towers and base stations where the height is known or at 118 feet where unknown.
Figures 37 and 38 identify the location of the inventory sites categorized as follows:
|
• |
Black dot – Eligible towers or base stations with PWSF |
|
★ |
Black star – Noneligible towers or base stations without PWSF |
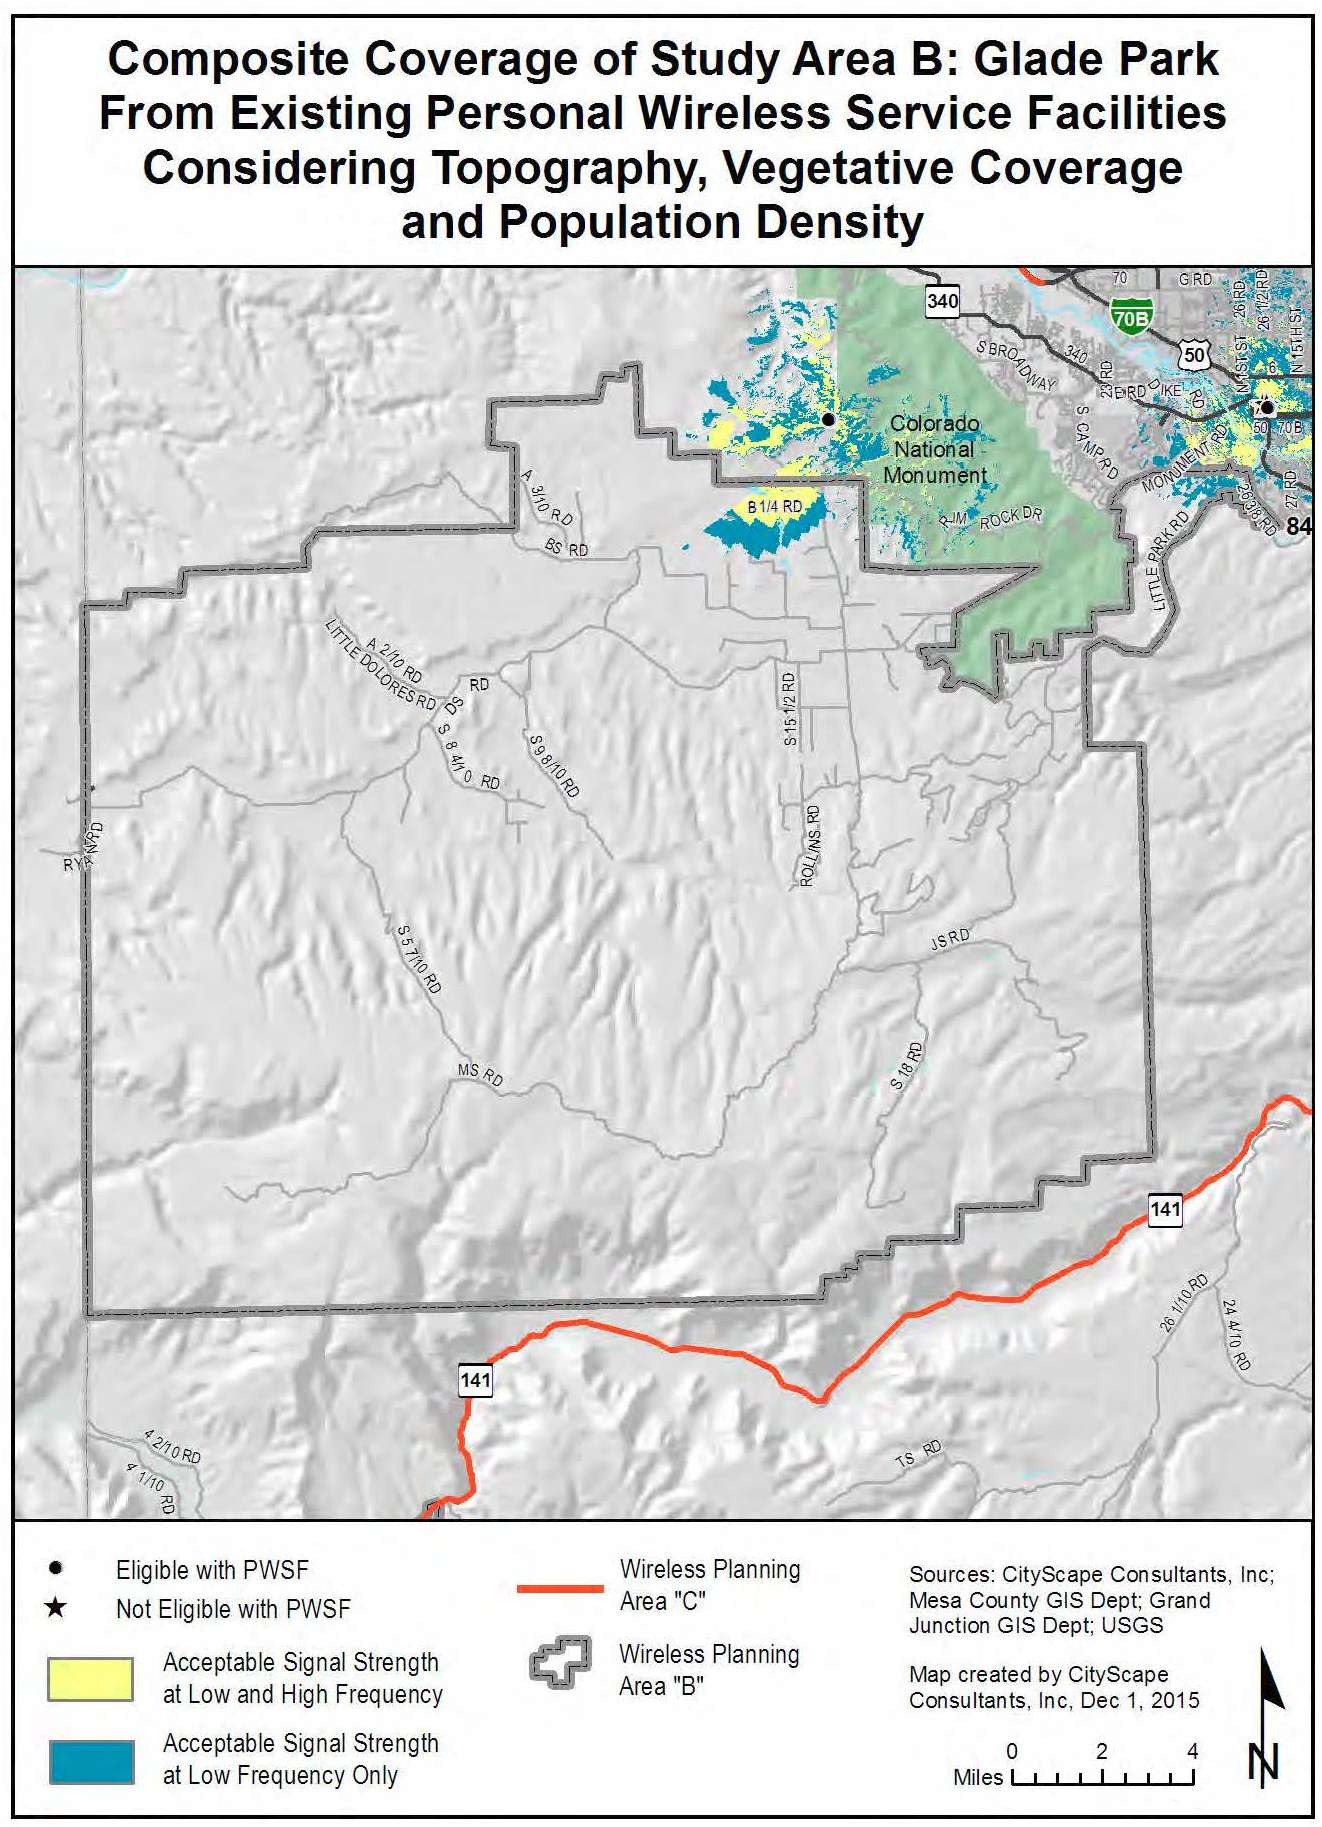
Figure 37: Current Potential Coverage
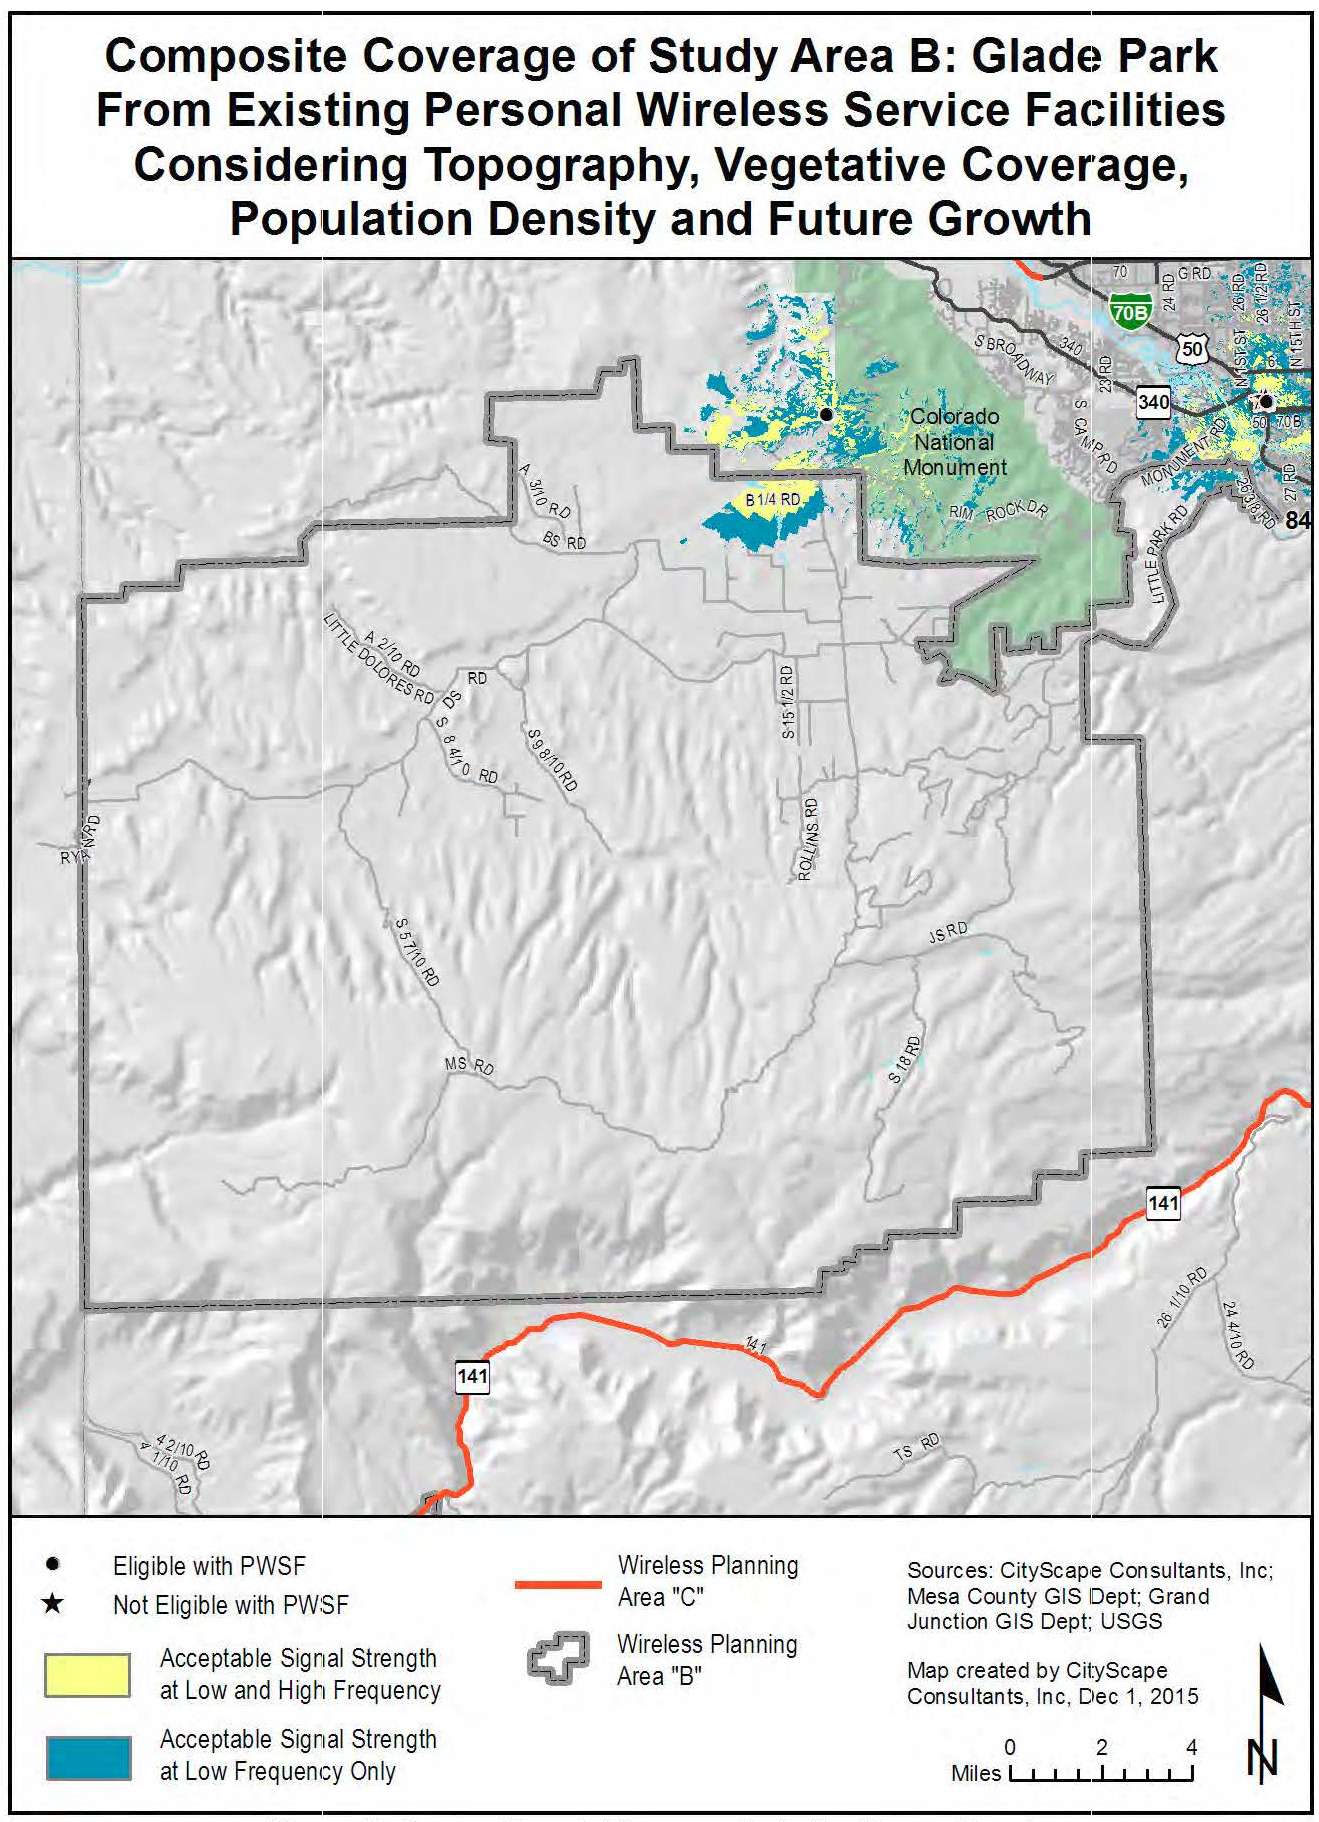
Figure 38: Current Potential Coverage Including Future Growth
(Ord. 4703, 6-1-16)
31.12.520 Glade Park estimation of future antenna sites.
CityScape understands the residents’ and visitors’ desire to have service coverage in the Glade Park Study Area. A study was recently completed to identify possible locations for additional emergency services infrastructure. Three of these sites are located in this study area and have been added to the fill-in map in Figure 39 and are identified by a red triangle. CityScape has identified an additional six locations that would maximize the effectiveness of new infrastructure but anticipates that only one of those facilities (site T) may be constructed over the next 10 to 15 years. These fill-in sites are shown with green and black triangles. The majority of the population lives in the Northwest corner of the study area and services for these residents could be improved by a facility in that area. However, the sparsity of the subscribers and the division between multiple providers makes this area too small of a footprint for most major service providers to justify a new facility. Due to the unique circumstances found in this study area, CityScape recommends that residents and local government agencies work with the service providers to create a coordinated effort to develop new sites.
These estimates are based on the expected changes in population density, subscriber base and usage, daily transient movement throughout the study area and the number of calls a facility can service at any given time. The projections consider coverage, capacity, and broadband network objectives and take into consideration terrain, population and proposed maximum infrastructure height variables. The projection model that CityScape designed assumes that all existing tower and base station locations will be used for maximum co-location opportunities in an effort to reduce the number of new towers and base stations required within a given geographic area. Should the industry not maximize the use of existing facilities, a greater number of towers will need to be constructed over this same time period. It should also be noted that even with this increase in new facilities, some areas within the study area will still be underserved due to the terrain and to the rural characteristics of the study area.
CityScape has reviewed the gaps in network coverage in comparison to the location of publicly owned properties and considered the impact that placing a tower on those properties would have on network and public safety coverage. When publicly owned property is used for new tower or base station construction, the community, represented by their local government agency, is assured that their preferences for tower types and concealment technology are followed. As public properties are developed, the infrastructure installed becomes the precedent for how future sites should be developed on both public and private land. For example, many slick sticks and flagpole towers are available to the industry as are other creative concealment techniques. Some are more aesthetically pleasing and more practical than other types. As the local government adopts preferred products on publicly owned property, their application becomes the standard for future tower sites developed on public and private land within their zoning jurisdiction. Leasing public properties to tower builders and tenant carriers for new wireless infrastructure can also create new sources of public revenue. Additionally, having a tower on public property results in an asset for the local government that is available for emergency services radio and wireless broadband equipment use.
Figure 39 indicates how certain geographic areas would benefit with improved network coverage from the addition of the publicly owned properties. Table 17 identifies potential public property fill-in sites. Tower type preferences are not provided in the recommendation column because the property has not been vetted by the local planning agency.
|
Public Site ID |
Owner |
Location |
Address |
Parcel Number |
Acreage |
Site-Specific Recommendation |
|---|---|---|---|---|---|---|
|
T |
County of Mesa |
Glade Park |
16430 DS Road |
2959-243-02-932 |
2.089 |
Not Determined |
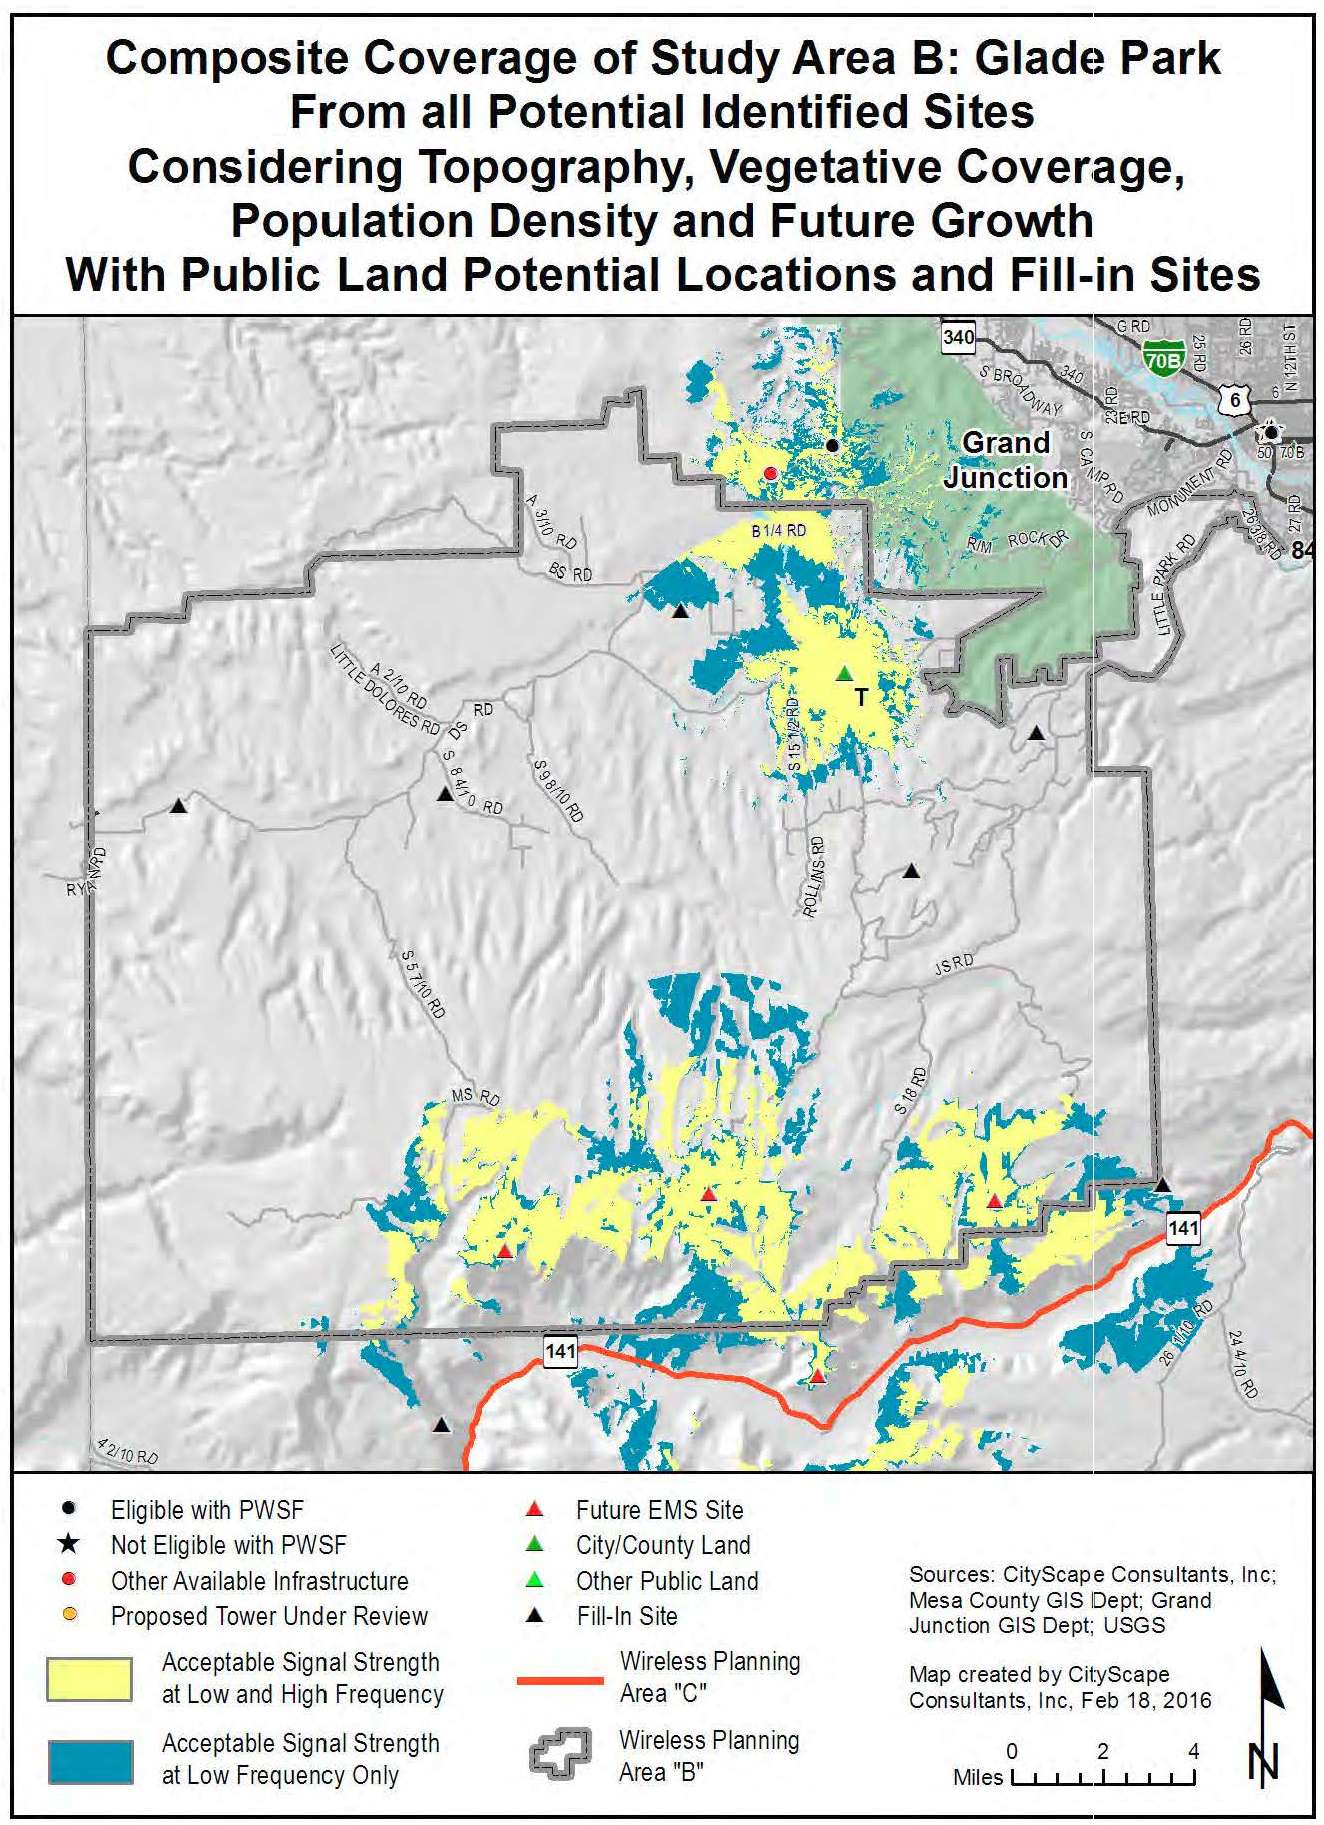
Figure 39: Coverage with Future Fill-In
(Ord. 4703, 6-1-16)
31.12.530 Gateway characteristics.
(a) Undeveloped.
(b) 3.69 square miles.
(c) 2010 population estimate 142.
(d) 2030 population estimate 342.
(Ord. 4703, 6-1-16)
31.12.540 Gateway theoretical root mean square maps.
The following maps represent a theoretical build-out of equally distributed antennas, mounted at a tower height of 118 feet, in a perfect radio frequency environment for a single service provider that excludes topographic, vegetative cover and population density considerations. The black dot within each larger circle indicates the ideal antenna location. The smaller circle within the larger circle represents the acceptable search ring for locating the tower and antennas.
Figure 40 illustrates that two towers or base stations centrally located in the Gateway Study Area would provide complete low frequency coverage to the defined study area. Figure 41 illustrates that it would take four locations to provide complete high frequency coverage to the same geographic area.
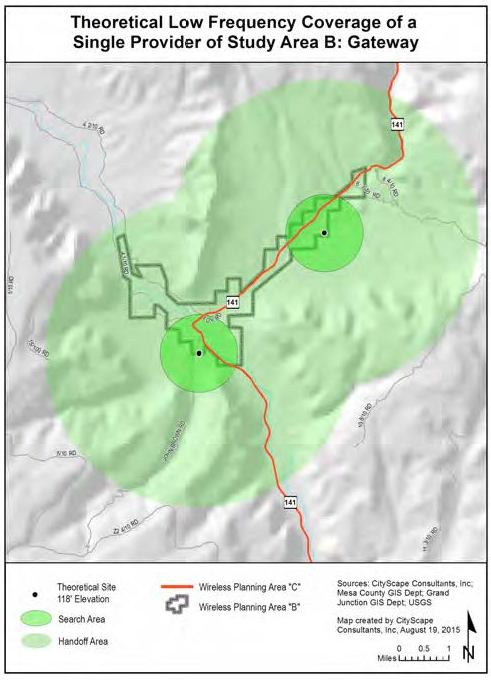
Figure 40: Theoretical Low Frequency Coverage
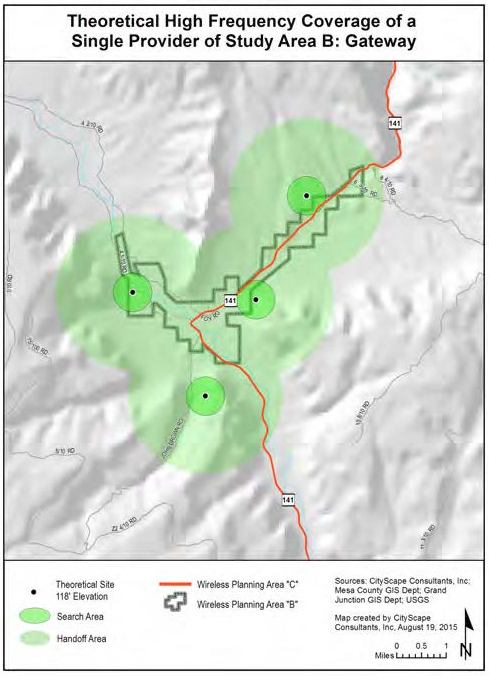
Figure 41: Theoretical High Frequency Coverage
(Ord. 4703, 6-1-16)
31.12.550 Gateway existing antenna locations.
The Gateway Study Area has no communication equipment within the study boundary. There are three sites located to the west on Lee’s Point which provide some service to Gateway and the Highway 141 corridor. Gateway, a remote, rural community, has a minimal subscriber base which explains the lack of wireless infrastructure in this region of the County. There is a resort located in Gateway which is likely the reason a PWSF was constructed on Lee’s Point.
|
Existing Total Number of Towers |
In |
Out |
Existing Total Number of Base Stations |
In |
Out |
|---|---|---|---|---|---|
|
Eligible Tower with PWSF |
0 |
0 |
Eligible Base Station with PWSF |
0 |
0 |
|
Noneligible Tower with PWSF |
0 |
1 |
Noneligible Base Station with PWSF |
0 |
0 |
|
Eligible Tower with no PWSF |
0 |
0 |
Eligible Base Station with no PWSF |
0 |
0 |
|
Noneligible Tower with no PWSF |
0 |
2 |
Noneligible Base Station with no PWSF |
0 |
0 |
|
Proposed Eligible Tower |
0 |
0 |
Proposed Eligible Base Station |
0 |
0 |
|
Total |
0 |
3 |
Total |
0 |
0 |
|
Site numbers in the Gateway Park Study Area: None |
|||||
|
Site numbers within the 1.5 mile perimeter of the Gateway Park Study Area: 133 – 135 |
|||||
Figure 42 identifies the location of the sites listed in Table 18 above and are represented by:
|
• |
Black dot – Eligible towers or base stations with PWSF which have been approved through a prescribed process by the appropriate local government agency. |
|
• |
Red dot – Noneligible towers or base stations (meaning infrastructure built without prior approval for construction by the appropriate local government agency). |
|
• |
Orange dot – Tower or base station that has either been approved but not yet built; or is undergoing review at the time of this publication. |
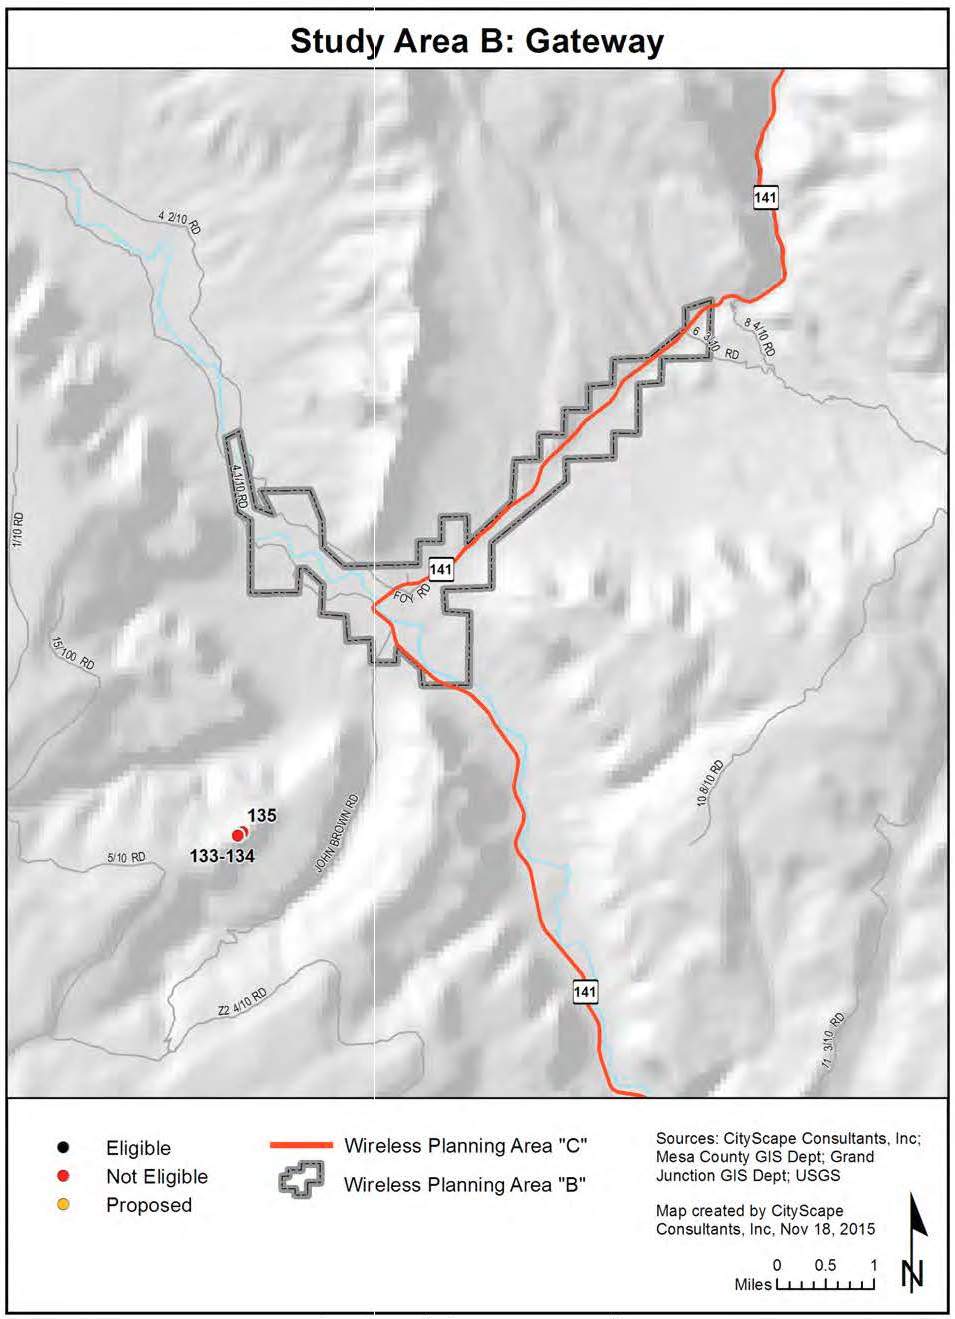
Figure 42: Existing Antenna Locations
(Ord. 4703, 6-1-16)
31.12.560 Gateway composite maps.
The service area coverage based on propagation signal strength modeling is shown for both low band frequency in yellow and high band frequency in blue on the following composite maps. The highlighted areas represent where a generally reliable signal level should be available for indoor use for both low and high bands of service.
Indoor usage is the service threshold utilized for composite modeling because it represents the lowest signal strength acceptable after considering the signal loss that occurs from building penetration. Outdoor signal strength in the same area will usually be higher than indoor signal strength. Generally the closer the subscriber is to the facility the more reliable the service. A subscriber further from the facility will have less reliable service. As the subscriber gets closer to the edge of the yellow or blue area, the signal strength becomes more prone to degradation, particularly as usage in the area increases or environmental conditions worsen. Areas of gray on the map indicate where the subscriber will experience weak, unpredictable levels of signal strength, or no service at all. Filling in these coverage gaps would require the installation of additional antennas and corresponding construction of more towers or the identification of buildings that would serve as base stations.
Figure 43 illustrates current and future theoretical coverage for one service provider operating in the low or high band frequency assuming they have equipment on each facility. This composite map includes the expected effects of terrain, vegetative cover, and current population density variables. The antenna mounting elevation is assumed to be at the top of the towers and base stations where the height is known or at 118 feet where unknown.
(Ord. 4703, 6-1-16)
31.12.570 Gateway estimation of future antenna sites.
Due to the undeveloped characteristics of the Gateway rural community, CityScape estimates that only one to three new sites may be built over the next 10 to 15 years. Any sites built will parallel Highway 141. The most likely location for a new facility would be in or near the town, which would improve wireless access for the citizens, resort visitors and travelers on Highway 141.
These estimates are based on the expected changes in population density, subscriber base and usage, daily transient movement throughout the study area and the number of calls a facility can service at any given time. The projections consider coverage, capacity, and broadband network objectives and take into consideration terrain, population and proposed maximum infrastructure height variables Should all three projected structures be constructed, then all of the Gateway Study Area would have wireless access.
CityScape has reviewed the gaps in network coverage in comparison to the location of publicly owned properties and considered the impact that placing a tower on those properties would have on network and public safety coverage. When publicly owned property is used for new tower or base station construction, the community, represented by their local government agency, is assured that their preferences for tower types and concealment technology are followed. As public properties are developed, the infrastructure installed becomes the precedent for how future sites should be developed on both public and private land. For example, many slick sticks and flagpole towers are available to the industry as are other creative concealment techniques. Some are more aesthetically pleasing and more practical than other types. As the local government adopts preferred products on publicly owned property, their application becomes the standard for future tower sites developed on public and private land within their zoning jurisdiction. Leasing public properties to tower builders and tenant carriers for new wireless infrastructure can also create new sources of public revenue. Additionally, having a tower on public property results in an asset for the local government that is available for emergency services radio and wireless broadband equipment use.
Figure 43 indicates how certain geographic areas would benefit with improved network coverage from the addition of the publicly owned properties. Table 19 identifies potential public property fill-in sites. Tower type preferences are not provided in the recommendation column because the property has not been vetted by the local planning agency.
|
Public Site ID |
Owner |
Location |
Address |
Parcel Number |
Acreage |
Site-Specific Recommendation |
|---|---|---|---|---|---|---|
|
X |
Mesa County |
Gateway |
42700 Highway 141 |
3477-153-01-936 |
7.663 |
Not Determined |
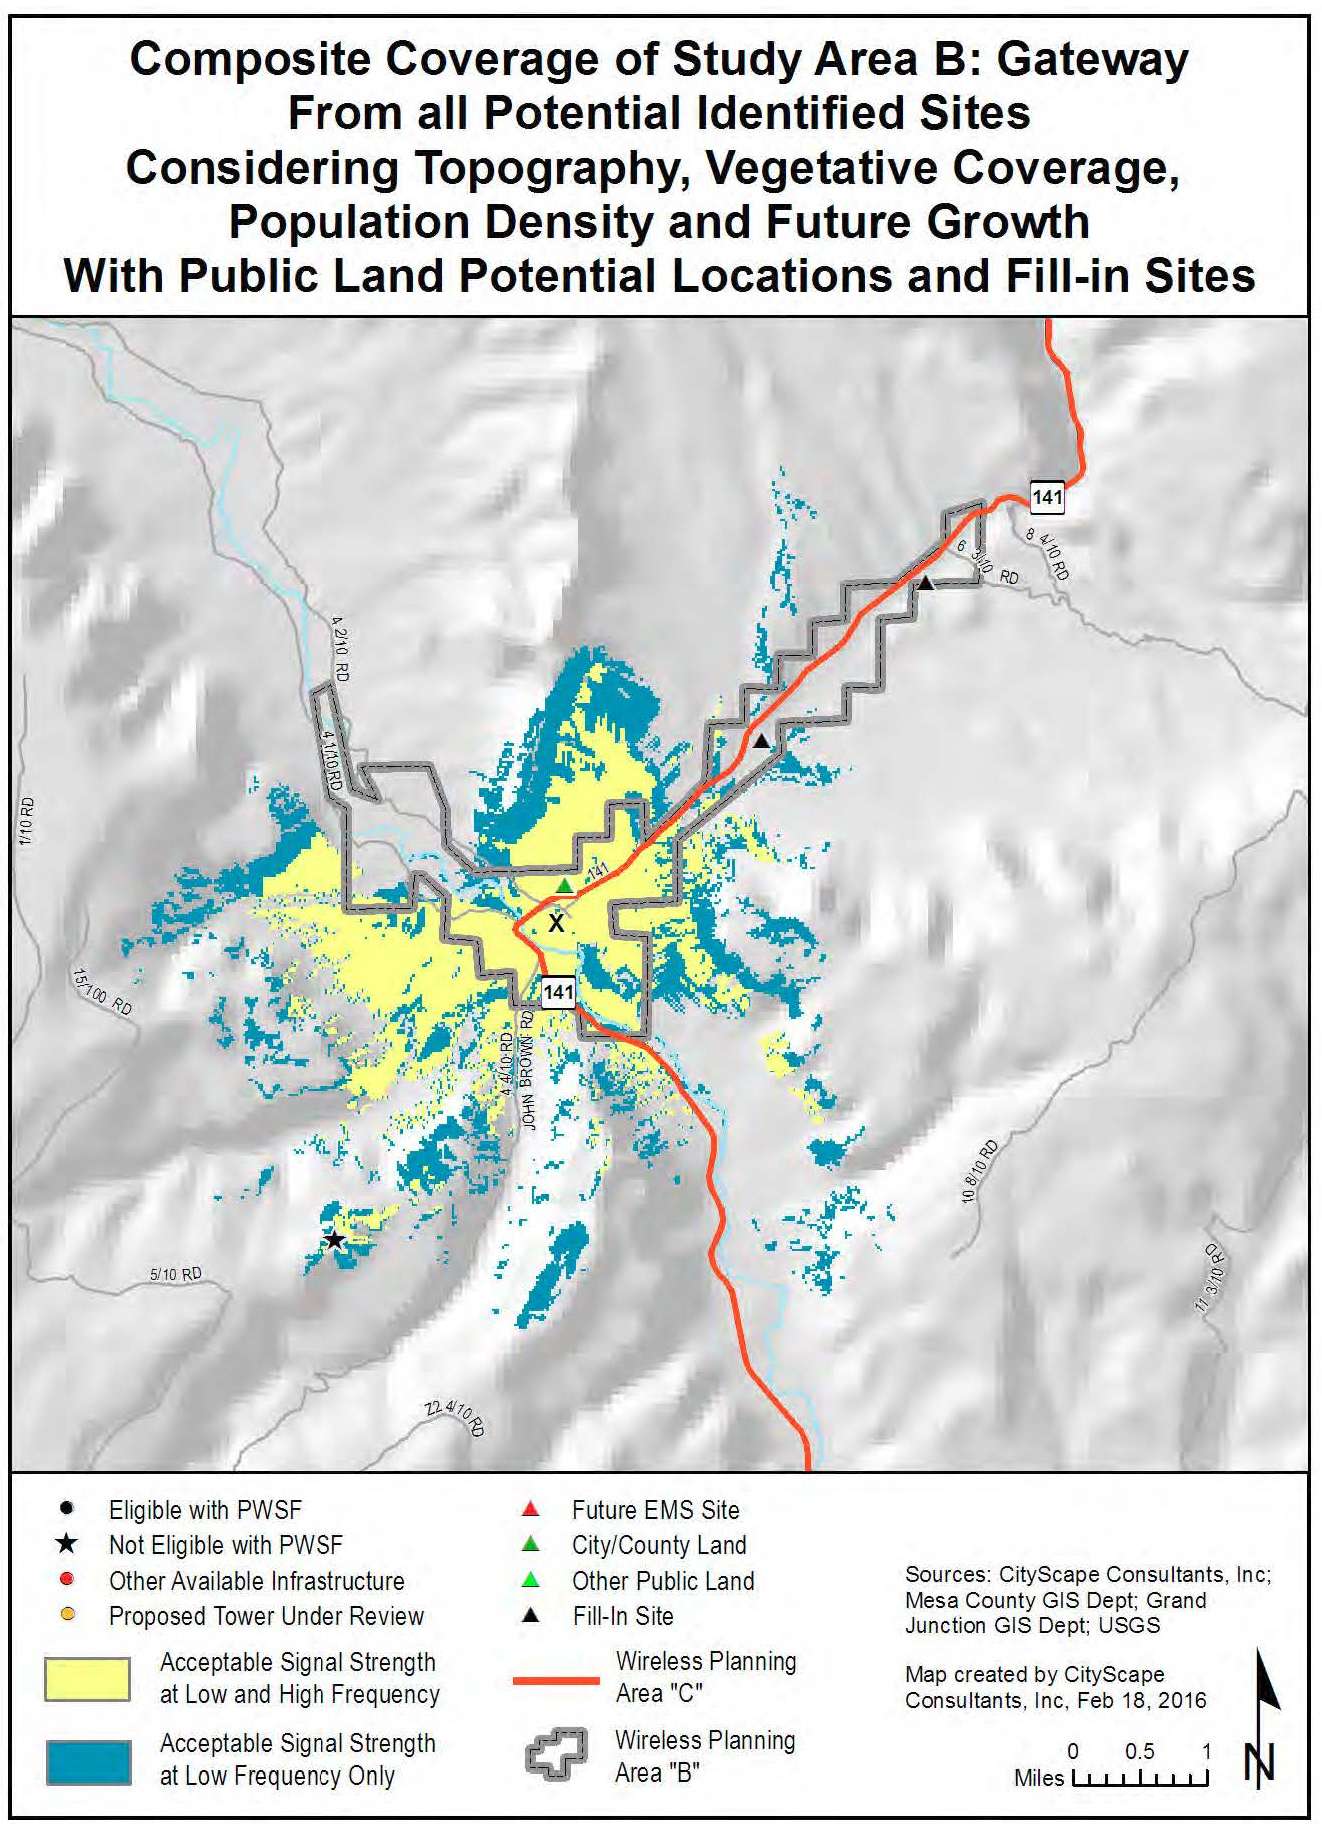
Figure 43: Coverage with Future Fill-In
(Ord. 4703, 6-1-16)
31.12.580 Whitewater characteristics.
(a) Rural/Undeveloped.
(b) 49.49 square miles.
(c) 2010 population estimate 1,864.
(d) 2030 population estimate 2,391.
(Ord. 4703, 6-1-16)
31.12.590 Whitewater theoretical root mean square maps.
The following maps represent a theoretical build-out of equally distributed antennas, mounted at a tower height of 118 feet, in a perfect radio frequency environment for a single service provider that excludes topographic, vegetative cover and population density considerations. The black dot within each larger circle indicates the ideal antenna location. The smaller circle within the larger circle represents the acceptable search ring for locating the tower and antennas.
Figure 44 illustrates that five towers or base stations equally distributed throughout the Whitewater Study Area would provide complete low frequency coverage to the defined study area. Figure 45 illustrates that 14 locations would be needed to provide complete high frequency coverage to the same geographic area.
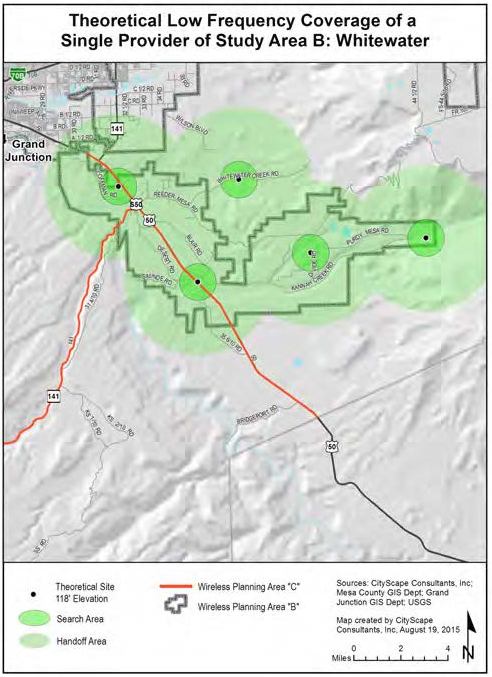
Figure 44: Theoretical Low Frequency Coverage
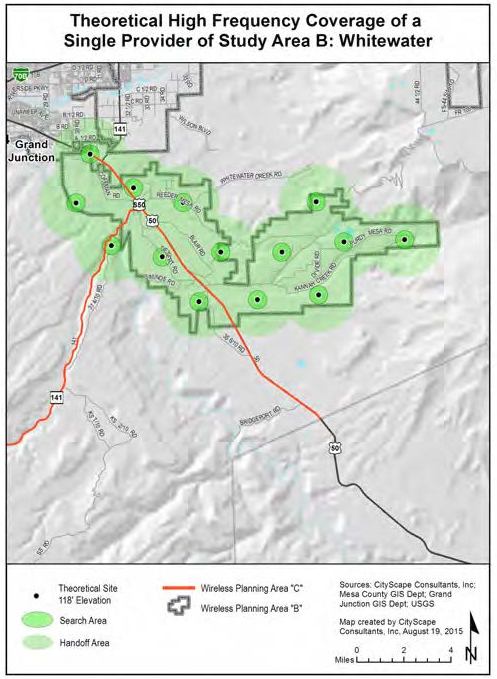
Figure 45: Theoretical Low Frequency Coverage
(Ord. 4703, 6-1-16)
31.12.600 Whitewater existing antenna locations.
There are five communication facilities within the Whitewater Study Area located parallel to Highway 50. Only one of the three facilities is equipped with a PWSF. One additional facility is located west of the boundary area.
|
Existing Total Number of Towers |
In |
Out |
Existing Total Number of Base Stations |
In |
Out |
|---|---|---|---|---|---|
|
Eligible Tower with PWSF |
1 |
0 |
Eligible Base Station with PWSF |
0 |
0 |
|
Noneligible Tower with PWSF |
1 |
1 |
Noneligible Base Station with PWSF |
0 |
0 |
|
Eligible Tower with no PWSF |
0 |
0 |
Eligible Base Station with no PWSF |
0 |
0 |
|
Noneligible Tower with no PWSF |
3 |
0 |
Noneligible Base Station with no PWSF |
0 |
0 |
|
Proposed Eligible Tower |
0 |
0 |
Proposed Eligible Base Station |
0 |
0 |
|
Total |
5 |
1 |
Total |
0 |
0 |
|
Site numbers in the Whitewater Study Area: 87, 103, 104 |
|||||
|
Site numbers within the 1.5 mile perimeter of the Whitewater Study Area: 86 |
|||||
Figure 46 identifies the location of the sites listed in Table 20 above and are represented by:
|
• |
Black dot – Eligible towers or base stations with PWSF which have been approved through a prescribed process by the appropriate local government agency. |
|
• |
Red dot – Noneligible towers or base stations (meaning infrastructure built without prior approval for construction by the appropriate local government agency). |
|
• |
Orange dot – Tower or base station that has either been approved but not yet built; or is undergoing review at the time of this publication. |
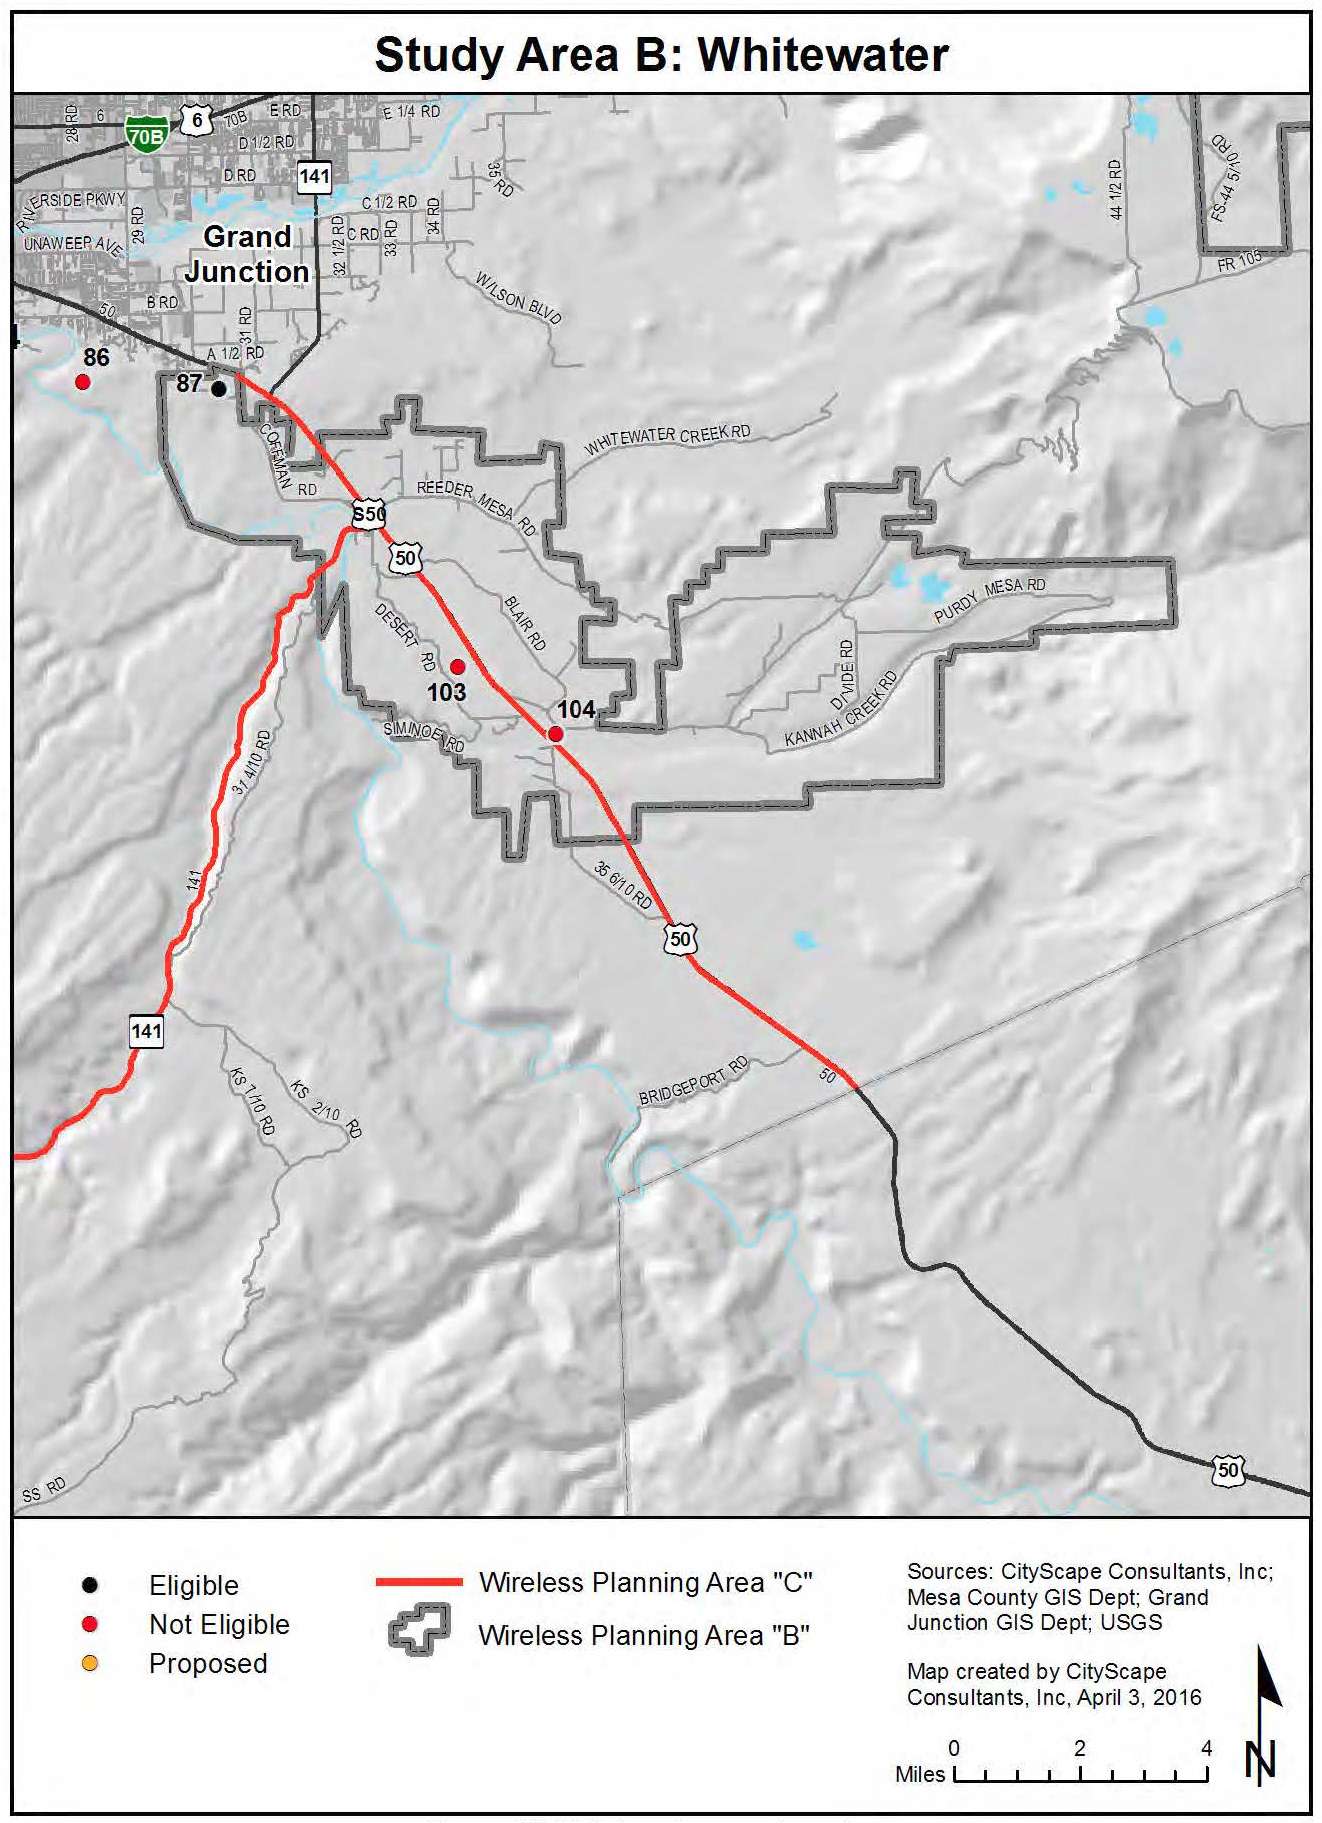
Figure 46: Existing Antenna Locations
(Ord. 4703, 6-1-16)
31.12.610 Whitewater composite maps.
The service area coverage based on propagation signal strength modeling is shown for both low band frequency in yellow and high band frequency in blue on the following composite maps. The highlighted areas represent where a generally reliable signal level should be available for indoor use for both low and high bands of service.
Indoor usage is the service threshold utilized for composite modeling because it represents the lowest signal strength acceptable after considering the signal loss that occurs from building penetration. Outdoor signal strength in the same area will usually be higher than indoor signal strength. Generally the closer the subscriber is to the facility the more reliable the service. A subscriber further from the facility will have less reliable service. As the subscriber gets closer to the edge of the yellow or blue area, the signal strength becomes more prone to degradation, particularly as usage in the area increases or environmental conditions worsen. Areas of gray on the map indicate where the subscriber will experience weak, unpredictable levels of signal strength, or no service at all. Filling in these coverage gaps would require the installation of additional antennas and corresponding construction of more towers or the identification of buildings that would serve as base stations.
Figure 47 illustrates current theoretical coverage for one service provider operating in the low or high frequency assuming they had equipment on each facility. Figure 48 shows how population growth and technology changes will affect the current coverage model shown in Figure 47.
Both composite maps include the expected effects of terrain, vegetative cover, and current population density variables. The antenna mounting elevation in both figures is assumed to be at the top of the towers and base stations where the height is known or at 118 feet where unknown.
Figures 47 and 48 identify the location of the inventory sites categorized as follows:
|
• |
Black dot – Eligible towers or base stations with PWSF |
|
★ |
Black star – Noneligible towers or base stations without PWSF |
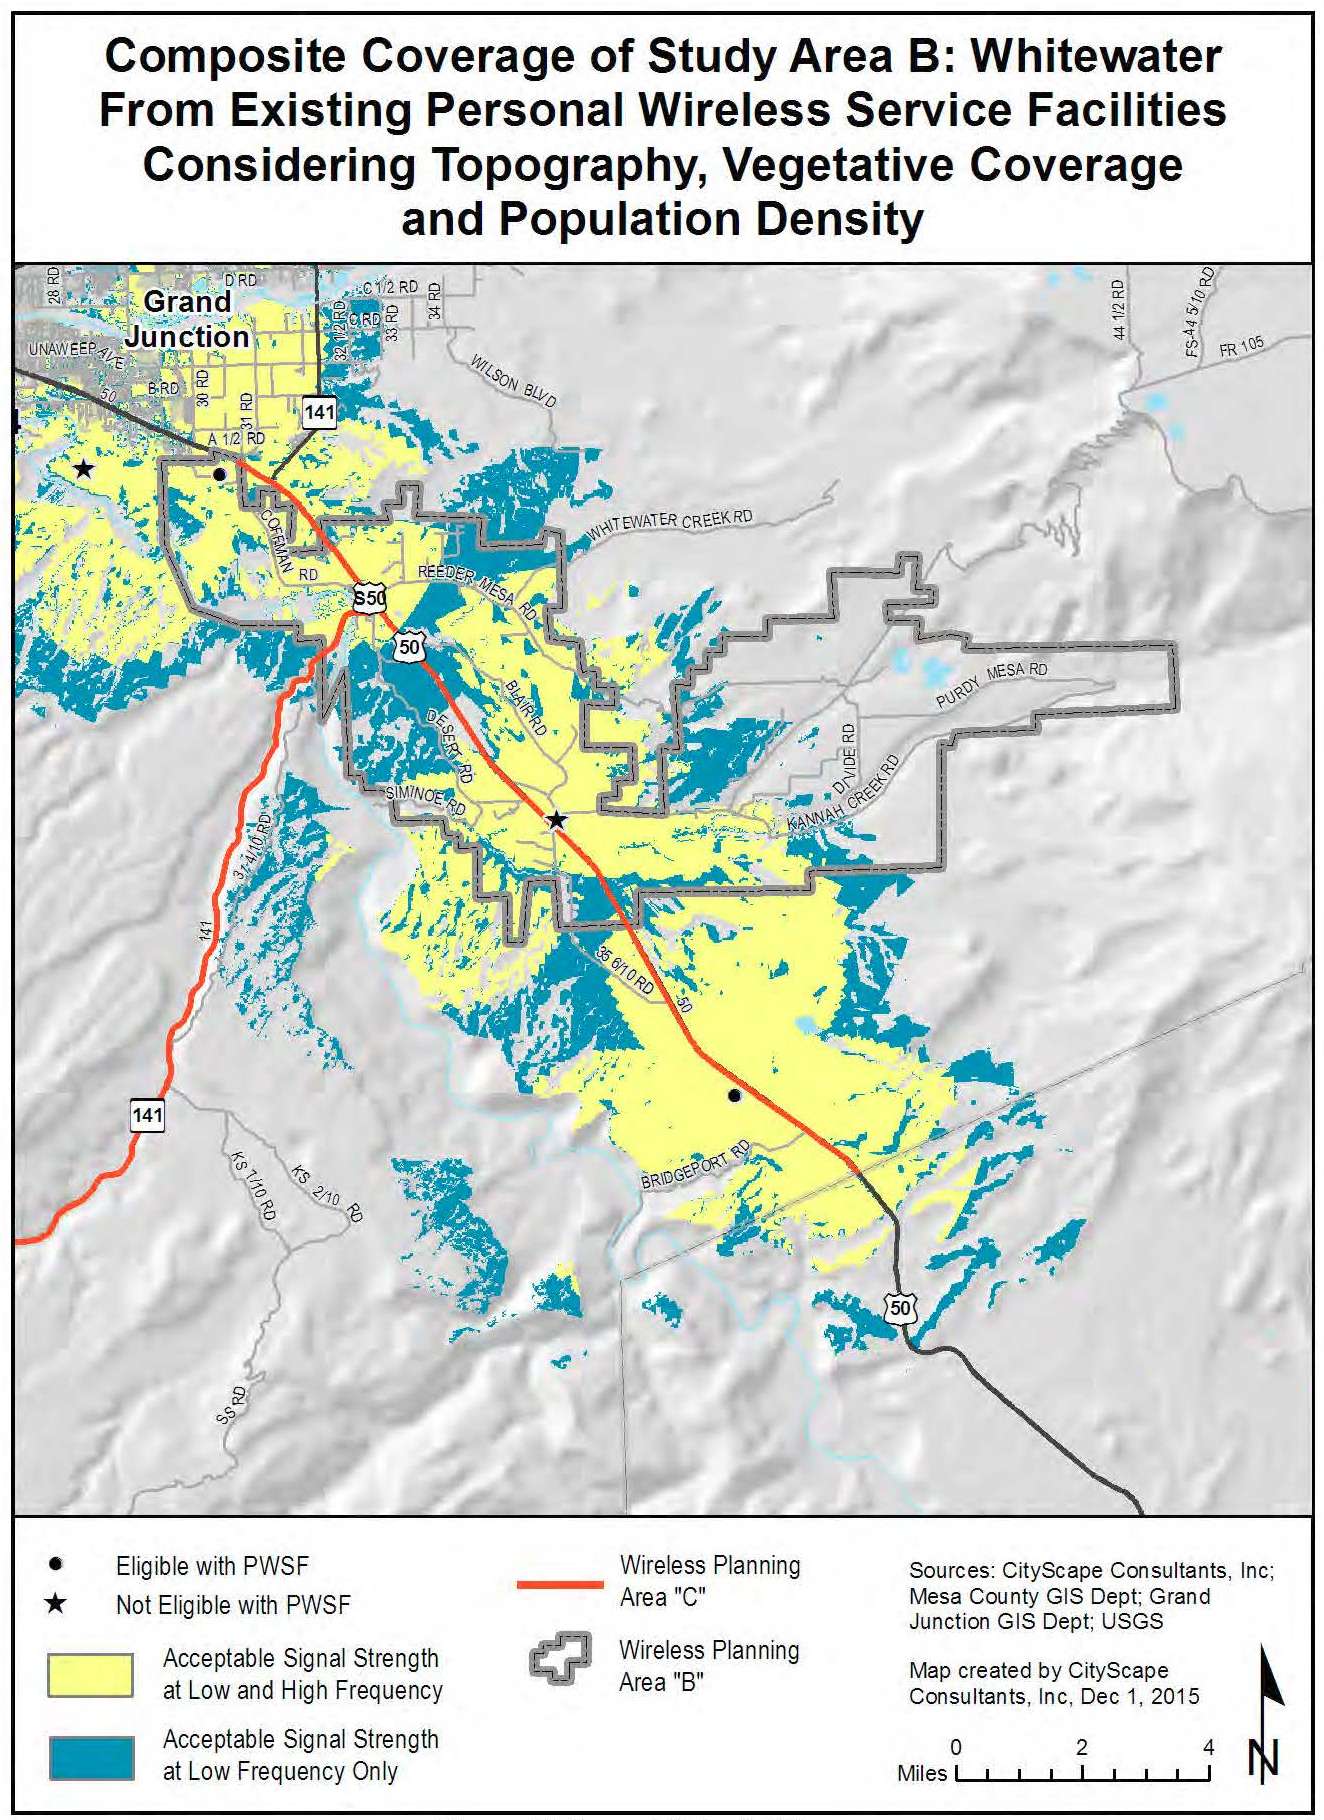
Figure 47: Current Potential Coverage
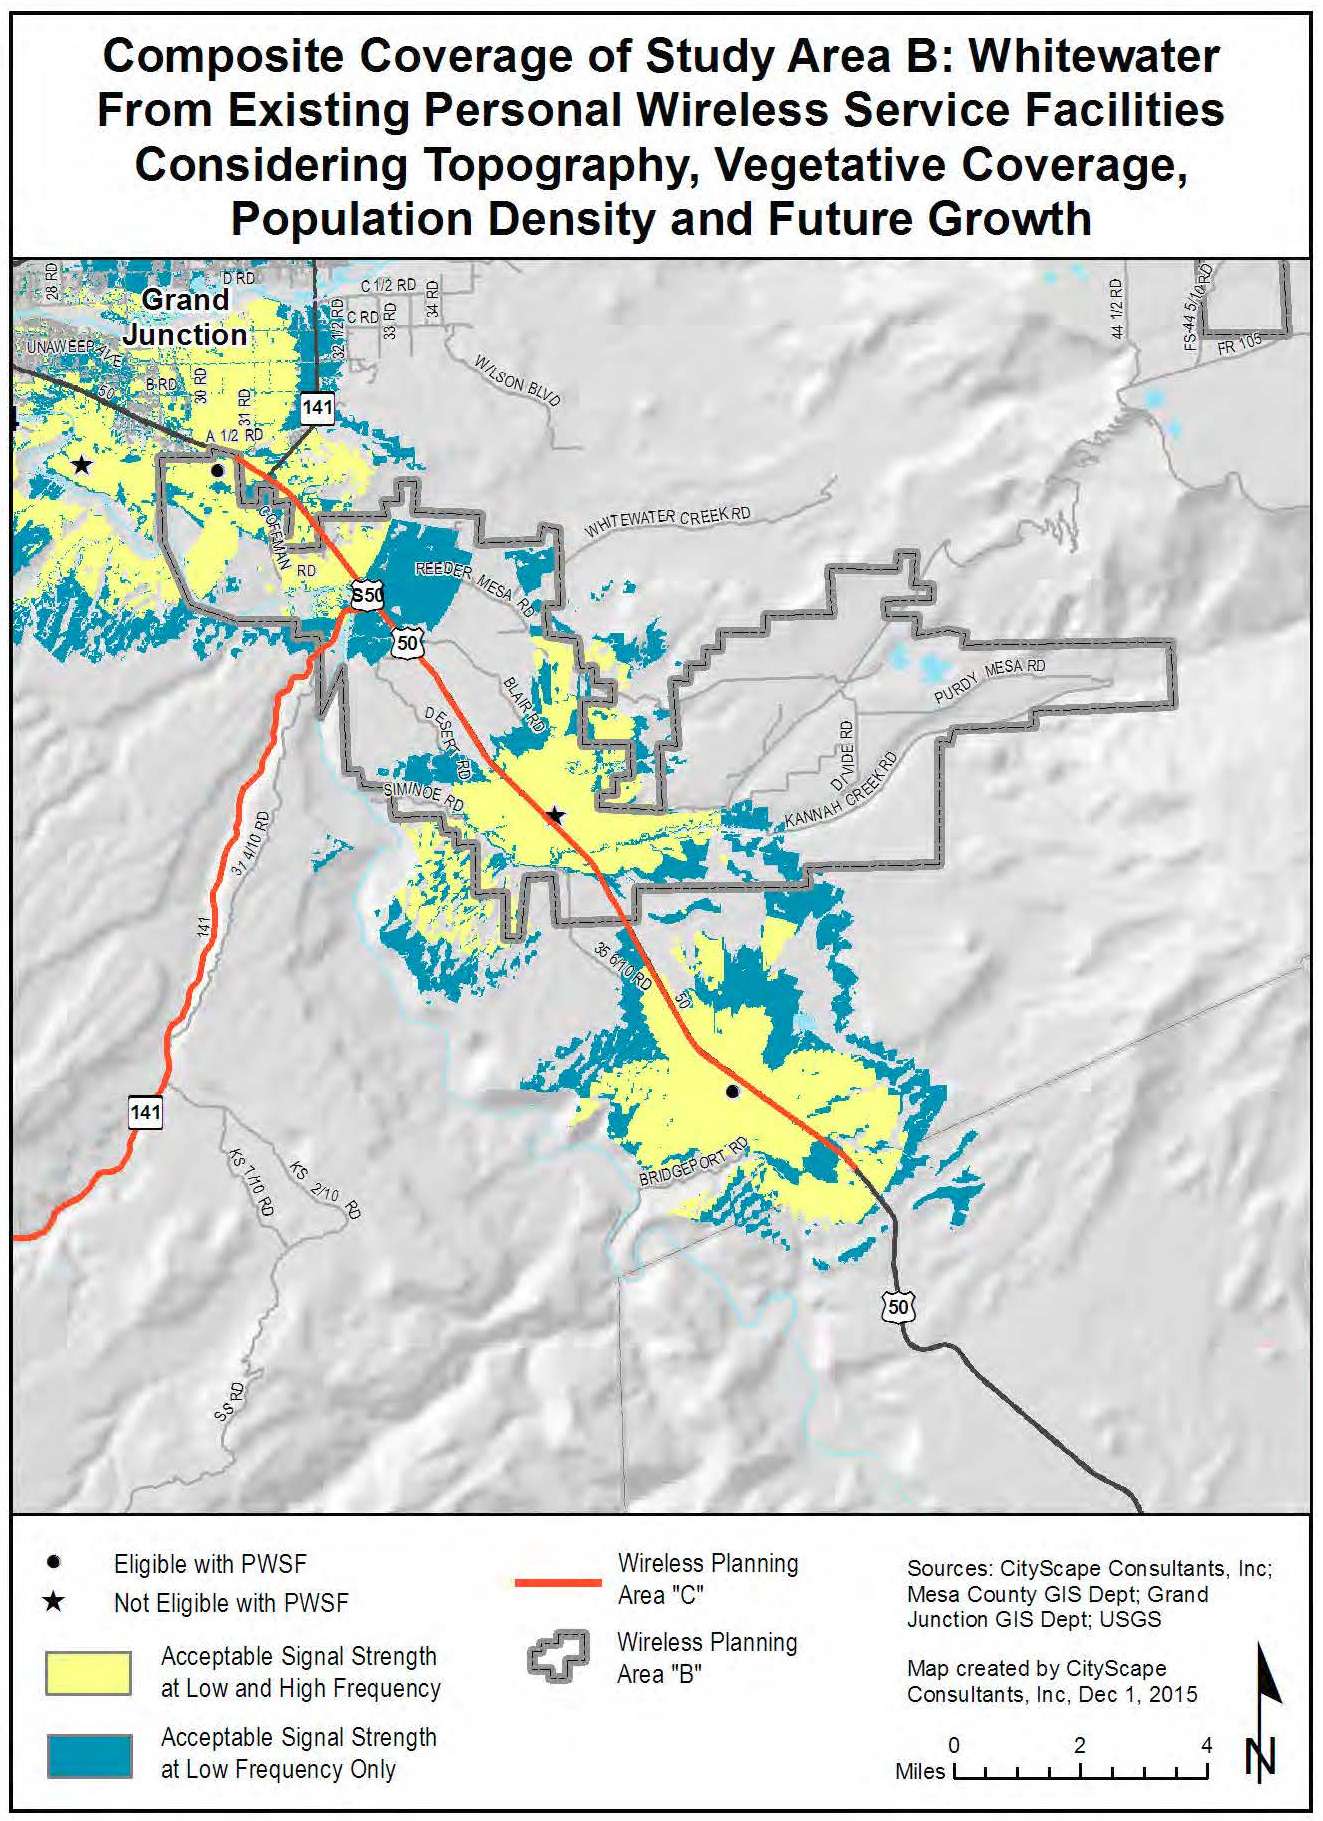
Figure 48: Current Potential Coverage Including Future Growth
(Ord. 4703, 6-1-16)
31.12.620 Whitewater estimation of future antenna sites.
The three existing towers in the Whitewater Study Area, if occupied by the same wireless service provider would offer very good service coverage along the Highway 50 corridor. CityScape has identified the need for four additional towers or base stations in this study area by 2030. Figure 49 illustrates three of the four sites turned on. In all likelihood, the first two sites added will be parallel to the highway.
These estimates are based on the expected changes in population density, subscriber base and usage, daily transient movement throughout the study area and the number of calls a facility can service at any given time. The projections consider coverage, capacity, and broadband network objectives and take into consideration terrain, population and proposed maximum infrastructure height variables. The projection model that CityScape designed assumes that all existing tower and base station locations will be used for maximum co-location opportunities in an effort to reduce the number of new towers and base stations required within a given geographic area. Should the industry not maximize the use of existing facilities, a greater number of towers will need to be constructed over this same time period.
CityScape has reviewed the gaps in network coverage in comparison to the location of publicly owned properties and considered the impact that placing a tower on those properties would have on network and public safety coverage. When publicly owned property is used for new tower or base station construction, the community, represented by their local government agency, is assured that their preferences for tower types and concealment technology are followed. As public properties are developed, the infrastructure installed becomes the precedent for how future sites should be developed on both public and private land. For example, many slick sticks and flagpole towers are available to the industry as are other creative concealment techniques. Some are more aesthetically pleasing and more practical than other types. As the local government adopts preferred products on publicly owned property, their application becomes the standard for future tower sites developed on public and private land within their zoning jurisdiction. Leasing public properties to tower builders and tenant carriers for new wireless infrastructure can also create new sources of public revenue. Additionally, having a tower on public property results in an asset for the local government that is available for emergency services radio and wireless broadband equipment use.
Figure 49 indicates how certain geographic areas would benefit with improved network coverage from the addition of the publicly owned properties. Table 21 identifies potential public property fill-in sites. Tower type preferences are not provided in the recommendation column because the property has not been vetted by the local planning agency.
|
Public Site ID |
Owner |
Location |
Address |
Parcel Number |
Acreage |
Site-Specific Recommendation |
|---|---|---|---|---|---|---|
|
U1 |
Mesa County |
Whitewater |
527 Desert Road |
2967-231-00-939 |
116.554 |
Not Determined |
|
U2 |
City of Grand Junction |
Whitewater |
33129 Mill Tailing Road |
2967-243-00-944 |
138.554 |
Not Determined |
|
V1 |
City of Grand Junction |
Whitewater |
2080 Purdy Mesa Road |
2969-251-00-944 |
216.145 |
Not Determined |
|
V2 |
City of Grand Junction |
Whitewater |
7630 Reeder Mesa Road |
2969-242-00-948 |
1333.34 |
Not Determined |
|
V3 |
City of Grand Junction |
Whitewater |
3330 Purdy Mesa Road |
2971-363-00-941 |
47.659 |
Not Determined |
|
W1 |
City of Grand Junction |
Whitewater |
3280 Purdy Mesa Road |
2971-361-00-940 |
1057.746 |
Not Determined |
|
W2 |
City of Grand Junction |
Whitewater |
8570 Kannah Creek Road |
3199-051-00-944 |
20.48 |
Not Determined |
|
W3 |
City of Grand Junction |
Whitewater |
9470 Kannah Creek Road |
2937-334-00-941 |
26.649 |
Not Determined |
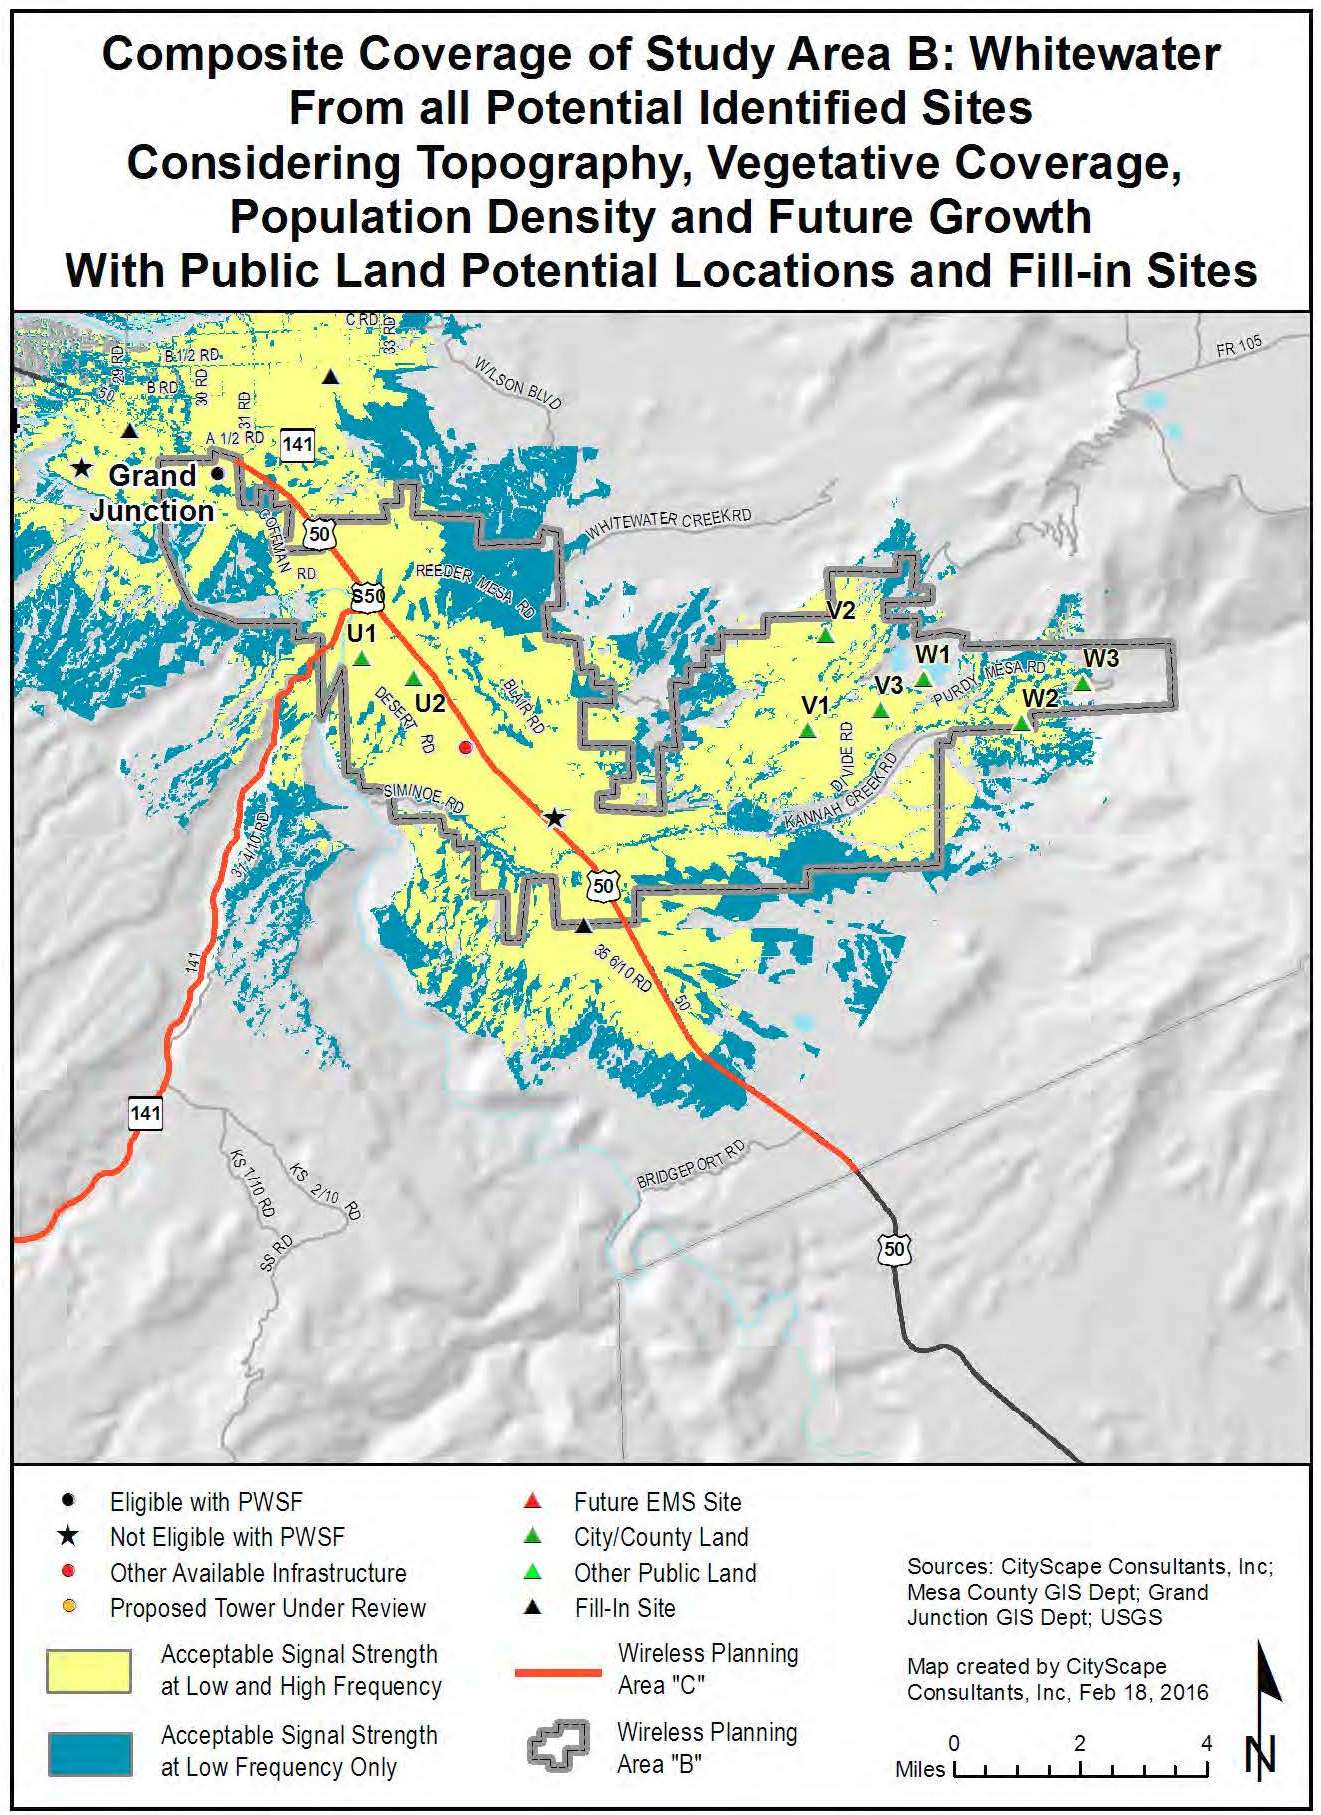
Figure 49: Coverage with Future Fill-In
(Ord. 4703, 6-1-16)
31.12.630 Town of Collbran characteristics.
(a) Rural/Undeveloped.
(b) 251.49 square miles.
(c) 2010 population estimate 2,359.
(d) 2030 population estimate 3,008.
(Ord. 4703, 6-1-16)
31.12.640 Town of Collbran theoretical root mean square maps.
The following maps represent a theoretical build-out of equally distributed antennas, mounted at a tower height of 118 feet, in a perfect radio frequency environment for a single service provider that excludes topographic, vegetative cover and population density considerations. The black dot within each larger circle indicates the ideal antenna location. The smaller circle within the larger circle represents the acceptable search ring for locating the tower and antennas.
Figure 50 illustrates that 19 towers or base stations equally distributed throughout the Town of Collbran Study Area would provide complete low frequency coverage to the defined study area. Figure 51 illustrates that 60 locations would be needed to provide complete high frequency coverage to the same geographic area.
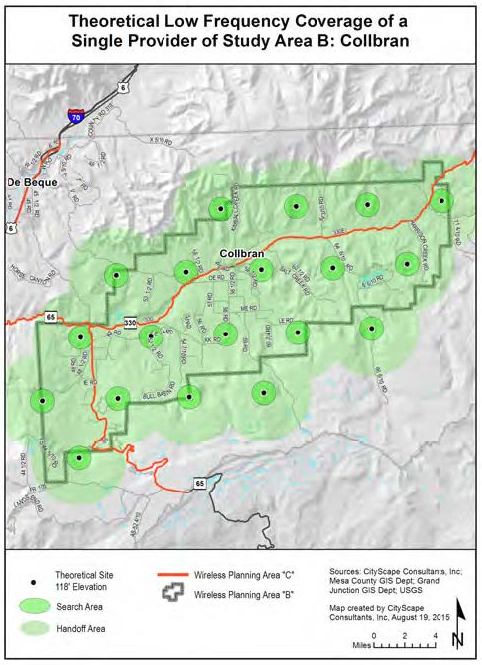
Figure 50: Theoretical Low Frequency Coverage
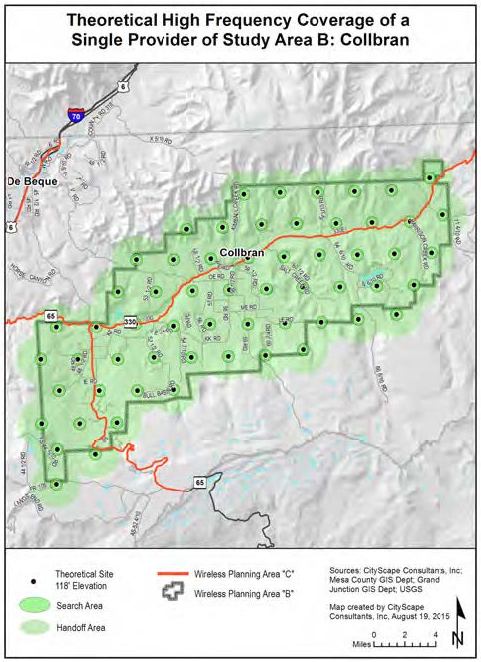
Figure 51: Theoretical High Frequency Coverage
(Ord. 4703, 6-1-16)
31.12.650 Town of Collbran existing antenna locations.
A total of four transmission towers are located within the Town of Collbran Study Area. Only one has PWSF installed. There are tower clusters just west of the study area boundary at Land’s End and Palisade Point. The clusters consist of 37 towers but only two contain PWSF equipment. The majority of the cluster towers contain either broadcast equipment for radio and television or microwave use. Aside from Glade Park, the Town of Collbran Study Area contains the most acreage with the lowest population density. For this reason, the wireless industry has not deployed much infrastructure except at the Powderhorn Ski Resort. This is very similar to the situation in Gateway where the resort and the tourist traffic have provided enough business incentive for the carriers to provide limited service.
|
Existing Total Number of Towers |
In |
Out |
Existing Total Number of Base Stations |
In |
Out |
|---|---|---|---|---|---|
|
Eligible Tower with PWSF |
0 |
1 |
Eligible Base Station with PWSF |
0 |
0 |
|
Noneligible Tower with PWSF |
1 |
1 |
Noneligible Base Station with PWSF |
0 |
0 |
|
Eligible Tower with no PWSF |
0 |
0 |
Eligible Base Station with no PWSF |
0 |
0 |
|
Noneligible Tower with no PWSF |
3 |
37 |
Noneligible Base Station with no PWSF |
0 |
0 |
|
Proposed Eligible Tower |
0 |
0 |
Proposed Eligible Base Station |
0 |
0 |
|
Total |
4 |
39 |
Total |
0 |
0 |
|
Site numbers in the Town of Collbran Study Area: 4, 33, 130, 142 |
|||||
|
Site numbers within the 1.5 mile perimeter of the Town of Collbran Study Area: 7 – 30 |
|||||
Figure 52 identifies the location of the sites listed in Table 22 above and are represented by:
|
• |
Black dot – Eligible towers or base stations with PWSF which have been approved through a prescribed process by the appropriate local government agency. |
|
• |
Red dot – Noneligible towers or base stations (meaning infrastructure built without prior approval for construction by the appropriate local government agency). |
|
• |
Orange dot – Tower or base station that has either been approved but not yet built; or is undergoing review at the time of this publication. |
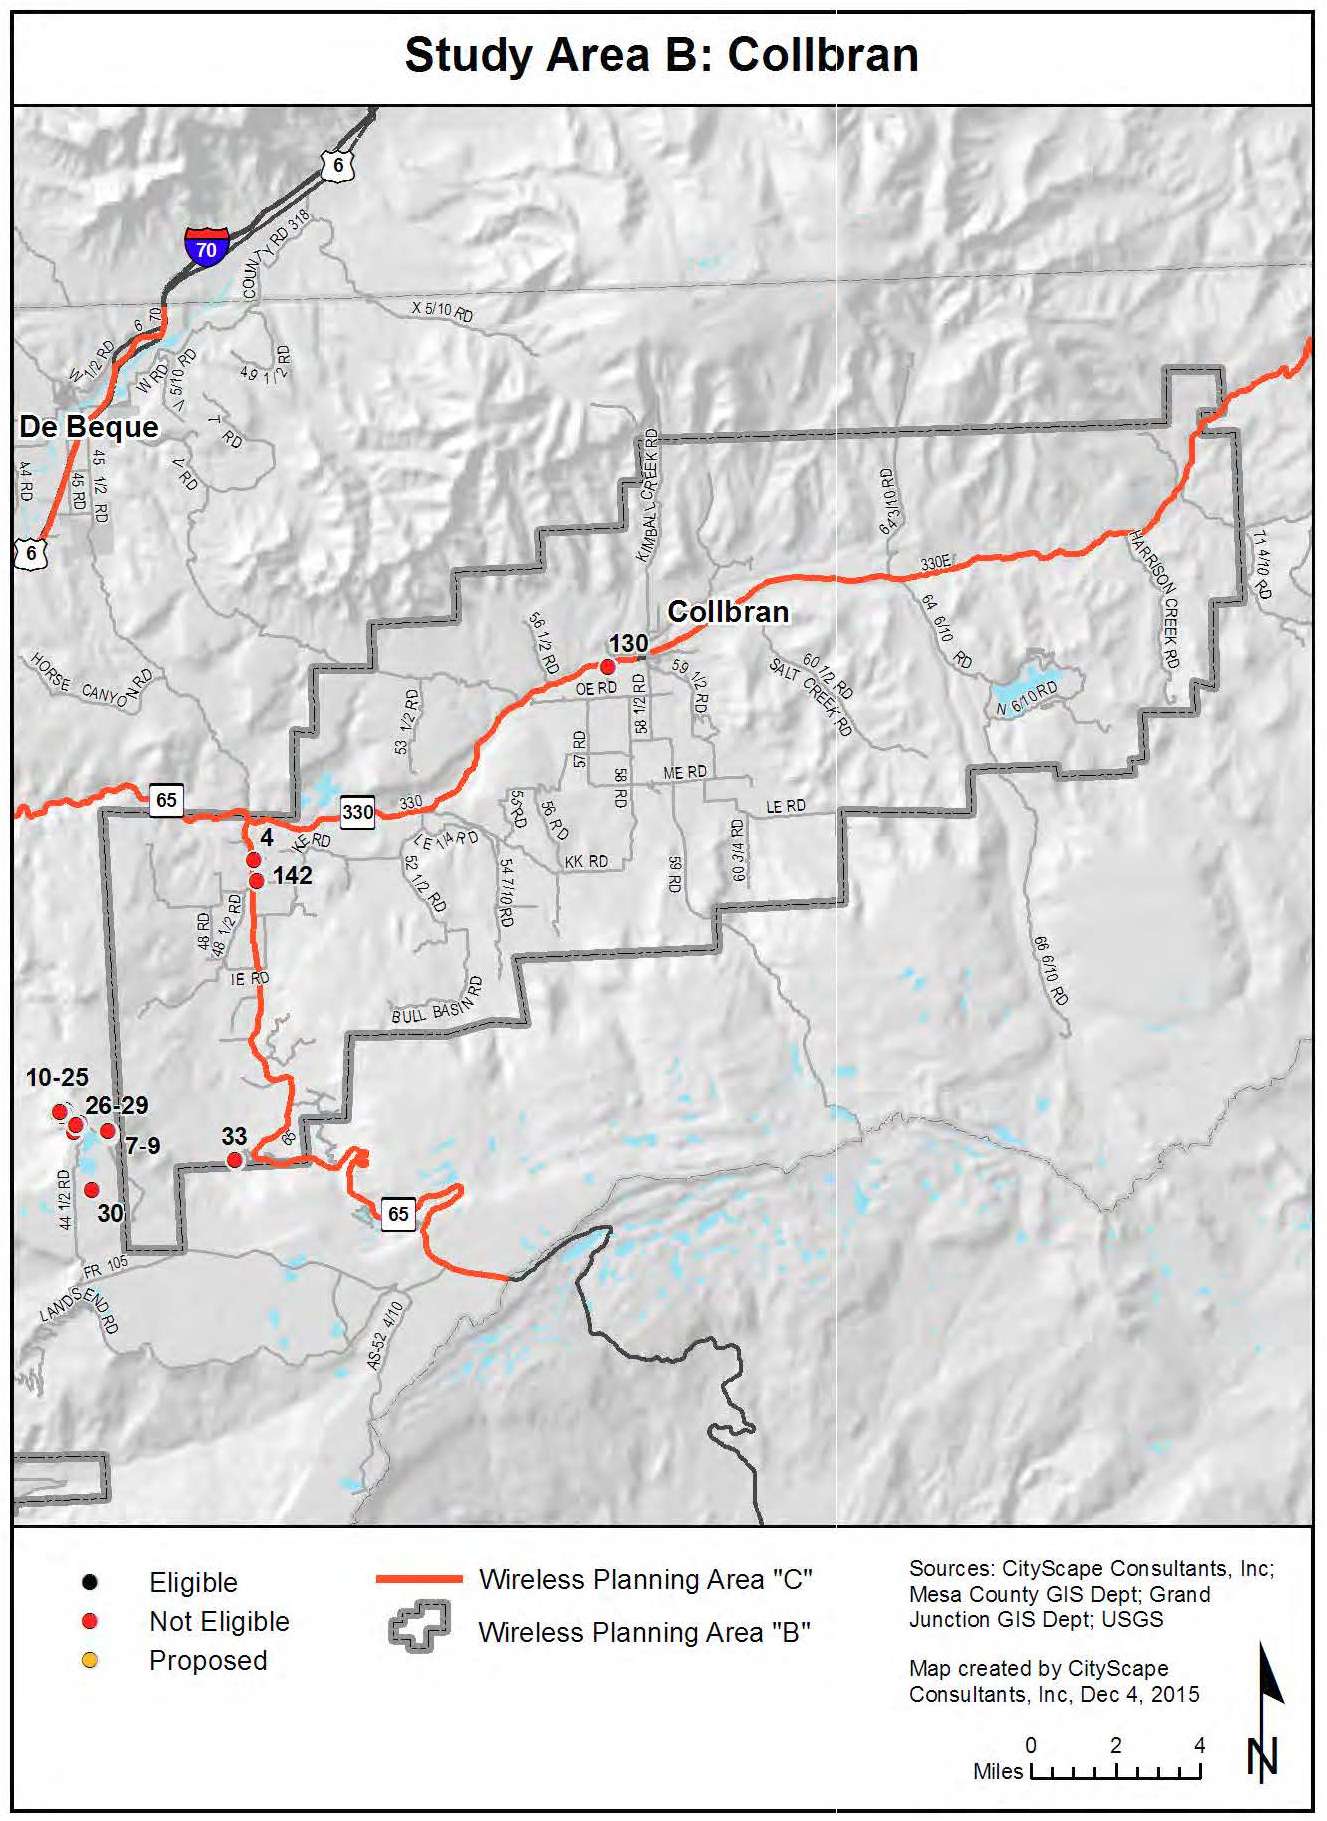
Figure 52: Existing Antenna Locations
(Ord. 4703, 6-1-16)
31.12.660 Town of Collbran composite maps.
The service area coverage based on propagation signal strength modeling is shown for both low band frequency in yellow and high band frequency in blue on the following composite maps. The highlighted areas represent where a generally reliable signal level should be available for indoor use for both low and high bands of service.
Indoor usage is the service threshold utilized for composite modeling because it represents the lowest signal strength acceptable after considering the signal loss that occurs from building penetration. Outdoor signal strength in the same area will usually be higher than indoor signal strength. Generally the closer the subscriber is to the facility the more reliable the service. A subscriber further from the facility will have less reliable service. As the subscriber gets closer to the edge of the yellow or blue area, the signal strength becomes more prone to degradation, particularly as usage in the area increases or environmental conditions worsen. Areas of gray on the map indicate where the subscriber will experience weak, unpredictable levels of signal strength, or no service at all. Filling in these coverage gaps would require the installation of additional antennas and corresponding construction of more towers or the identification of buildings that would serve as base stations.
Figure 53 illustrates current and future theoretical coverage for one service provider operating in the low or high band frequency assuming they had equipment on each facility.
This map includes the expected effects of terrain, vegetative cover, and current population density variables. The antenna mounting elevation in both figures is assumed to be at the top of the towers and base stations where the height is known or at 118 feet where unknown.
Figure 53 identifies the location of the inventory sites categorized as follows:
|
• |
Black dot – Eligible towers or base stations with PWSF |
|
★ |
Black star – Noneligible towers or base stations without PWSF |
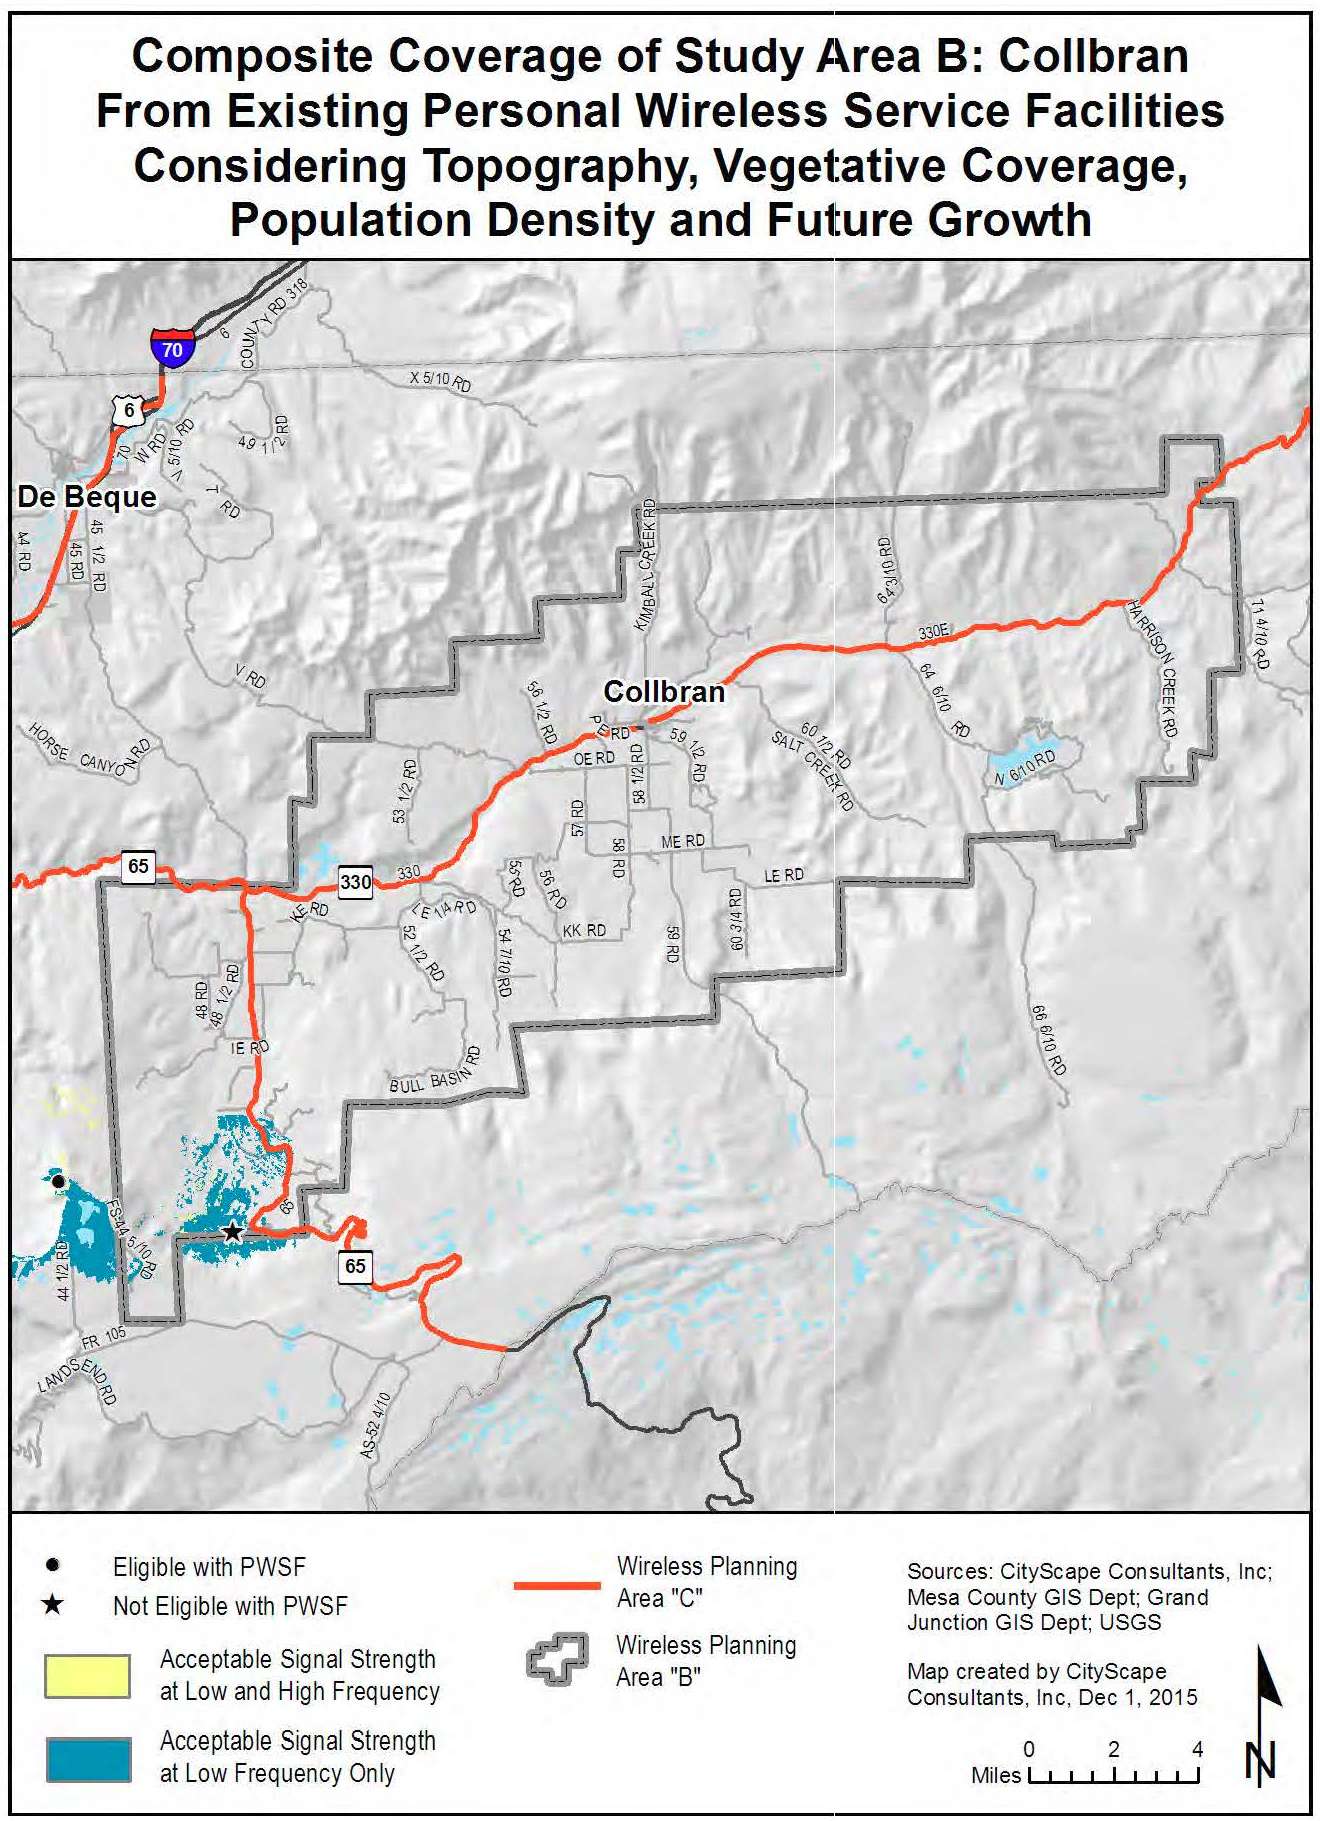
Figure 53: Current Potential Coverage Including Future Growth
(Ord. 4703, 6-1-16)
31.12.670 Town of Collbran estimation of future antenna sites.
There are three concentrations in populations in the Town of Collbran Study Area: Town of Collbran, Mesa Community and Powderhorn Resort. The Town and County desire to have services to connect the residents and vehicular activity between the three places. Recently, a study was completed to identify possible locations for additional emergency services infrastructure. Two of these sites are located in this study area and one is located just east of the Town’s limits. All three sites have been added to the map in Figure 54, identified by red triangles. Temporary towers, often referred to as Cell On Wheels (COW), have been used by the oil and gasoline industries in this region. Unfortunately once a project is finished the COW is removed resulting in a sudden loss of service. In order to provide long-term solutions to network gaps CityScape has identified an additional 12 locations that would provide a blanket of coverage along the Highway 330 corridor and the Town of Collbran. But, CityScape anticipates that only two of those facilities may be constructed over the next 10 to 15 years. Due to the unique circumstances found in this study area, CityScape recommends that residents and local government agencies work with the service providers to create a coordinated effort to develop new sites.
CityScape has reviewed the gaps in network coverage in comparison to the location of publicly owned properties and considered the impact that placing a tower on those properties would have on network and public safety coverage. When publicly owned property is used for new tower or base station construction, the community, represented by their local government agency, is assured that their preferences for tower types and concealment technology are followed. As public properties are developed, the infrastructure installed becomes the precedent for how future sites should be developed on both public and private land. For example, many slick sticks and flagpole towers are available to the industry as are other creative concealment techniques. Some are more aesthetically pleasing and more practical than other types. As the local government adopts preferred products on publicly owned property, their application becomes the standard for future tower sites developed on public and private land within their zoning jurisdiction. Leasing public properties to tower builders and tenant carriers for new wireless infrastructure can also create new sources of public revenue. Additionally, having a tower on public property results in an asset for the local government that is available for emergency services radio and wireless broadband equipment use.
Figure 54 indicates how certain geographic areas would benefit with improved network coverage from the addition of the publicly owned properties. Table 23 identifies potential public property fill-in sites. Tower type preferences are not provided in the recommendation column because the property has not been vetted by the local planning agency.
|
Public Site ID |
Owner |
Location |
Address |
Parcel Number |
Acreage |
Site-Specific Recommendation |
|---|---|---|---|---|---|---|
|
C |
Town of Collbran |
Town of Collbran |
61416 E Hwy 330 |
2665-203-00-941 |
1.196 |
Not Determined |
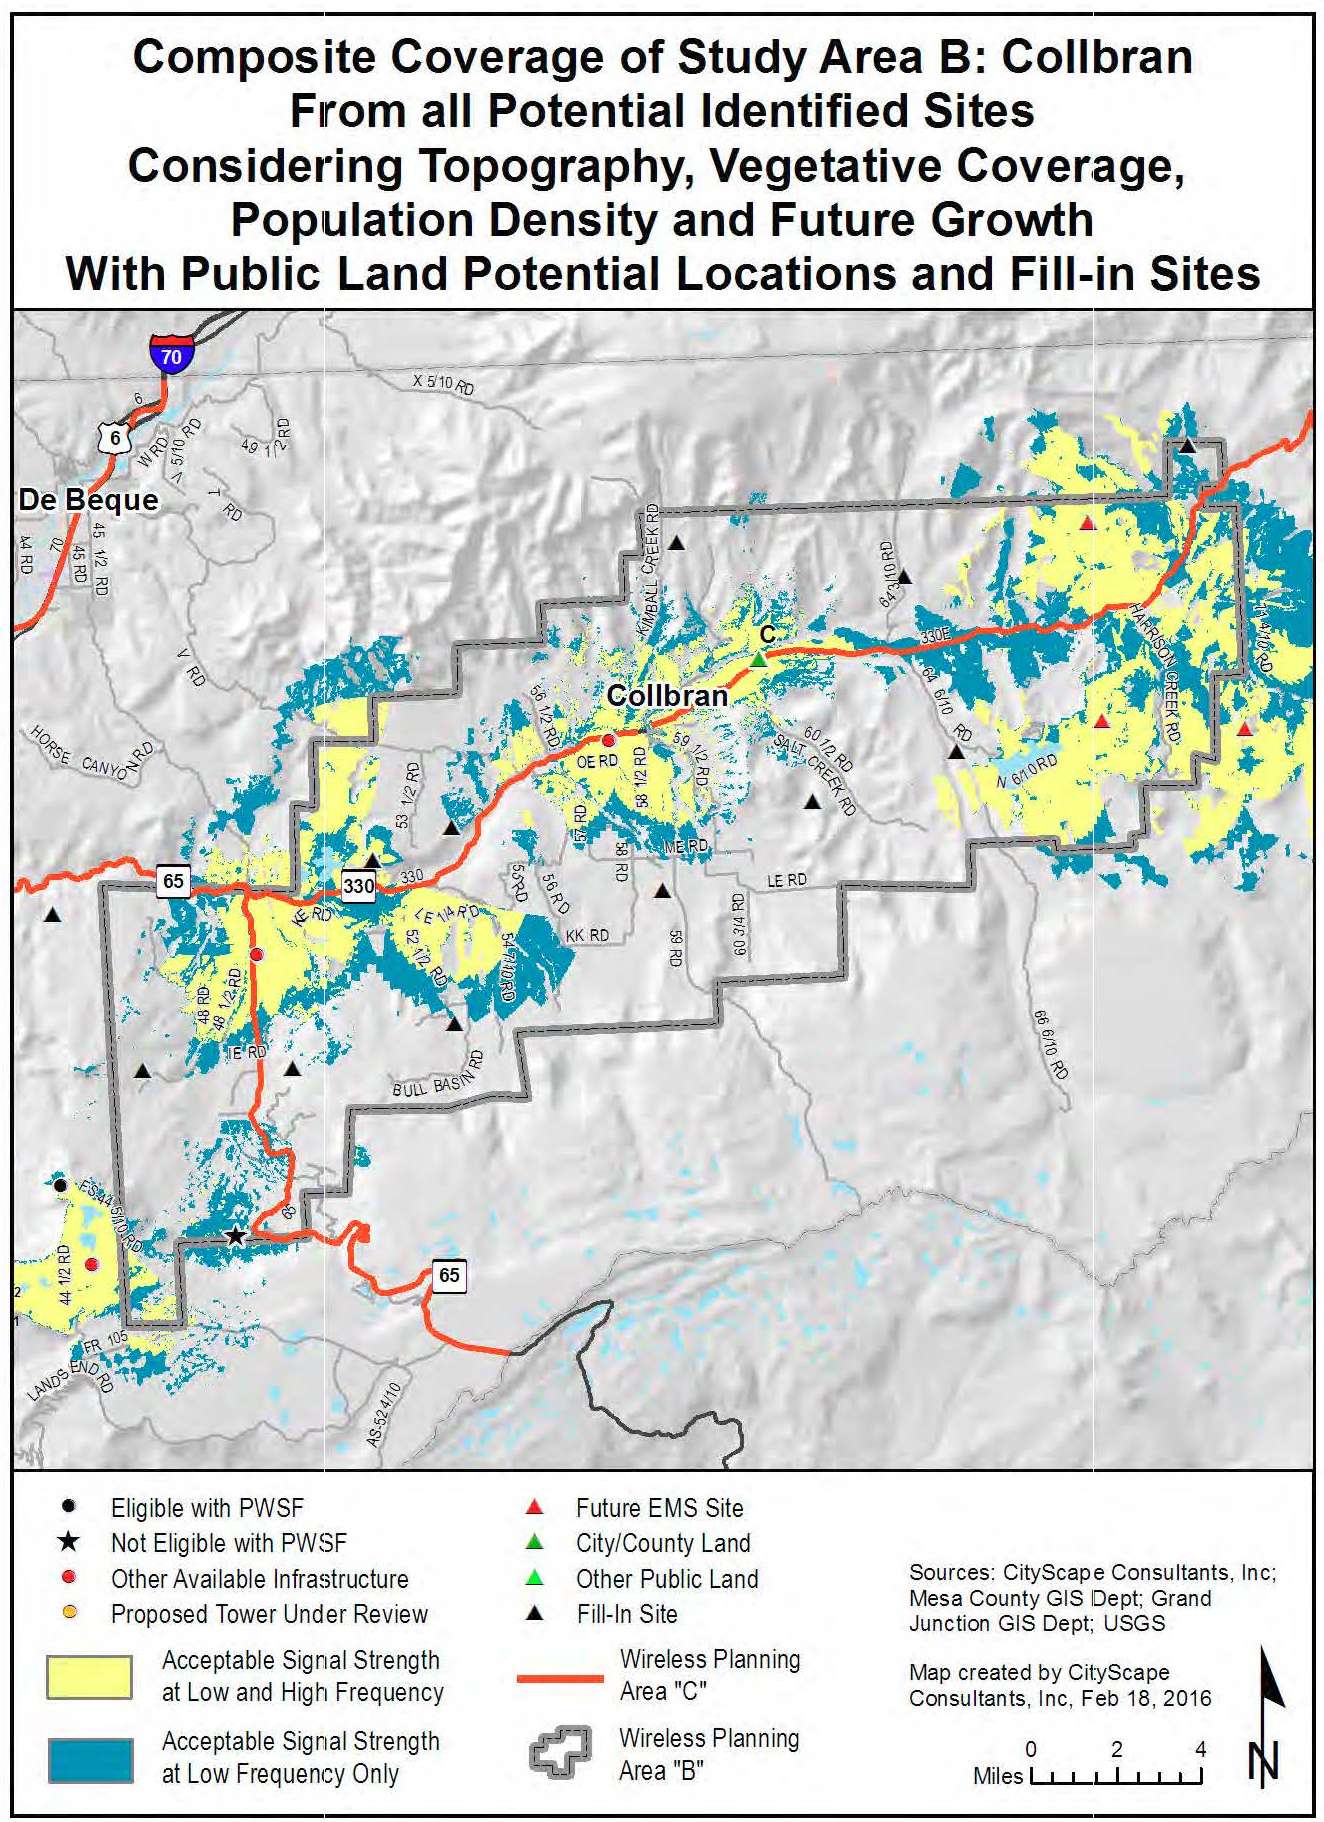
Figure 54: Coverage with Future Fill-In
(Ord. 4703, 6-1-16)
31.12.680 Mesa County Study Area C – Overview.
The third study area specified in the RFP for analysis is identified as Corridors: I-70, Highway 50, Highway 330, Highway 60 and Highway 141. Due to the large geographic area covered by these corridors, Study Area C has been divided into four sections. Since much of the corridor analysis is included in the other study areas, the estimated future antenna sites focus only on the projected fill-in analysis shown in Figure 55, as insets 1, 2, 3 and 4.
The service area coverage based on propagation signal strength modeling is shown for both low band frequency in yellow and high band frequency in blue on the following composite maps. The highlighted areas represent where a generally reliable signal level should be available for indoor use for both low and high bands of service.
Indoor usage is the service threshold utilized for composite modeling because it represents the lowest signal strength acceptable after considering the signal loss that occurs from building penetration. Outdoor signal strength in the same area will usually be higher than indoor signal strength. Generally the closer the subscriber is to the facility the more reliable the service. A subscriber further from the facility will have less reliable service. As the subscriber gets closer to the edge of the yellow or blue area, the signal strength becomes more prone to degradation, particularly as usage in the area increases or environmental conditions worsen. Areas of gray on the map indicate where the subscriber will experience weak, unpredictable levels of signal strength, or no service at all. Filling in these coverage gaps would require the installation of additional antennas and corresponding construction of more towers or the identification of buildings that would serve as base stations.
Figure 56 illustrates current and future theoretical coverage for one service provider operating in the low or high band frequency assuming they had equipment on each inventoried facility. This map includes the expected effects of terrain, vegetative cover, and current population density variables. The antenna mounting elevation is assumed to be at the top of the towers and base stations where the height is known or at 118 feet where unknown.
CityScape has reviewed the gaps in network coverage, as shown in Figures 57 through 60, in comparison to the location of publicly owned properties and considered the impact that placing a tower on those properties would have on network and public safety coverage. When publicly owned property is used for new tower or base station construction, the community, represented by their local government agency, is assured that their preferences for tower types and concealment technology are followed. As public properties are developed, the infrastructure installed becomes the precedent for how future sites should be developed on both public and private land. For example, many slick sticks and flagpole towers are available to the industry as are other creative concealment techniques. Some are more aesthetically pleasing and more practical than other types.
As the local government adopts preferred products on publicly owned property, their application becomes the standard for future tower sites developed on public and private land within their zoning jurisdiction. Leasing public properties to tower builders and tenant carriers for new wireless infrastructure can also create new sources of public revenue. Additionally, having a tower on public property results in an asset for the local government that is available for emergency services radio and wireless broadband equipment use.
Figures 57 through 60 indicate how certain geographic areas would benefit with improved network coverage from the addition of the publicly owned properties. Table 24 identifies potential public property fill-in sites that satisfy both corridor and study area coverage gaps. Tower type preferences are not provided in the recommendation column because the property has not been vetted by the local planning agency.
|
Public Site ID |
Owner |
Location |
Address |
Parcel Number |
Acreage |
Site-Specific Recommendation |
|---|---|---|---|---|---|---|
|
B1 |
DeBeque Fire Protection District |
DeBeque |
4580 I70 Frontage Road |
2445-274-00-944 |
5.86 |
Not Determined |
|
B2 |
Town of DeBeque |
DeBeque |
414 Rouse Avenue |
2445-272-00-943 |
61.767 |
Not Determined |
|
C |
Town of Collbran |
Town of Collbran |
61416 E Hwy 330 |
2665-203-00-941 |
1.196 |
Not Determined |
|
E1 |
Lower Valley Protection District |
Lower Valley/Loma |
1341 13 Road |
2691-334-04-948 |
0.79 |
Not Determined |
|
E2 |
State Department of Highways |
Lower Valley/Loma |
1346 13 3/10 Road |
2691-342-00-924 |
9.762 |
Not Determined |
|
G |
Mesa County |
Lower Valley |
916 19 1/2 Road |
2697-224-00-939 |
5.281 |
Not Determined |
|
Q |
Colorado Department of Highways |
Palisade |
816 35 8/10 Road |
2937-063-00-924 |
10.241 |
Not Determined |
|
U1 |
Mesa County |
Whitewater |
527 Desert Road |
2967-231-00-939 |
116.554 |
Not Determined |
|
U2 |
City of Grand Junction |
Whitewater |
33129 Mill Tailing Road |
2967-243-00-944 |
138.554 |
Not Determined |
|
X |
Mesa County |
Gateway |
42700 Highway 141 |
3477-153-01-936 |
7.663 |
Not Determined |
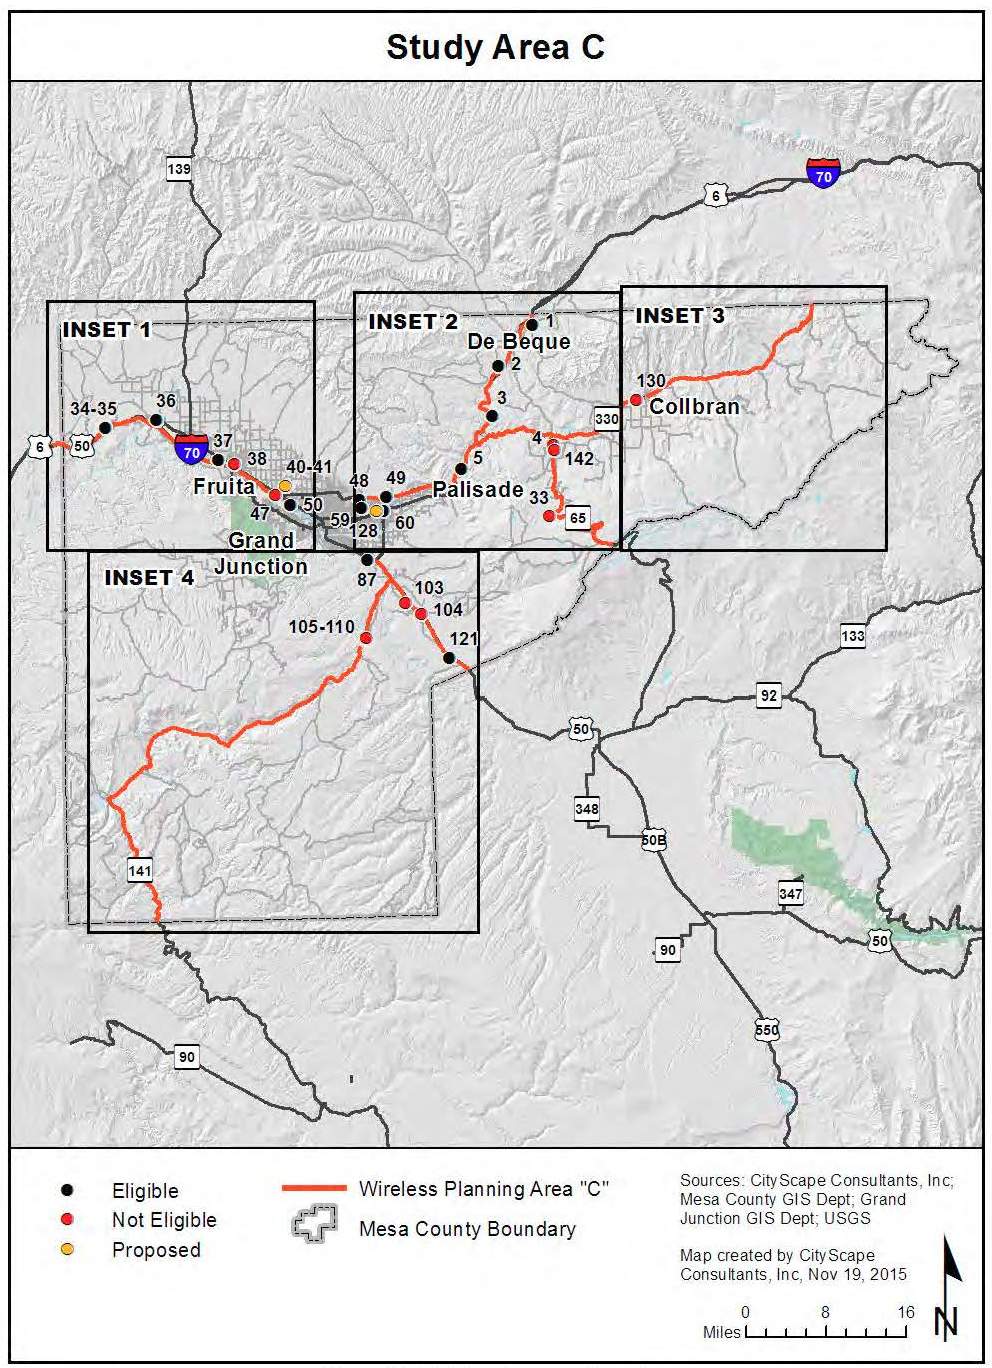
Figure 55: Existing Antenna Locations
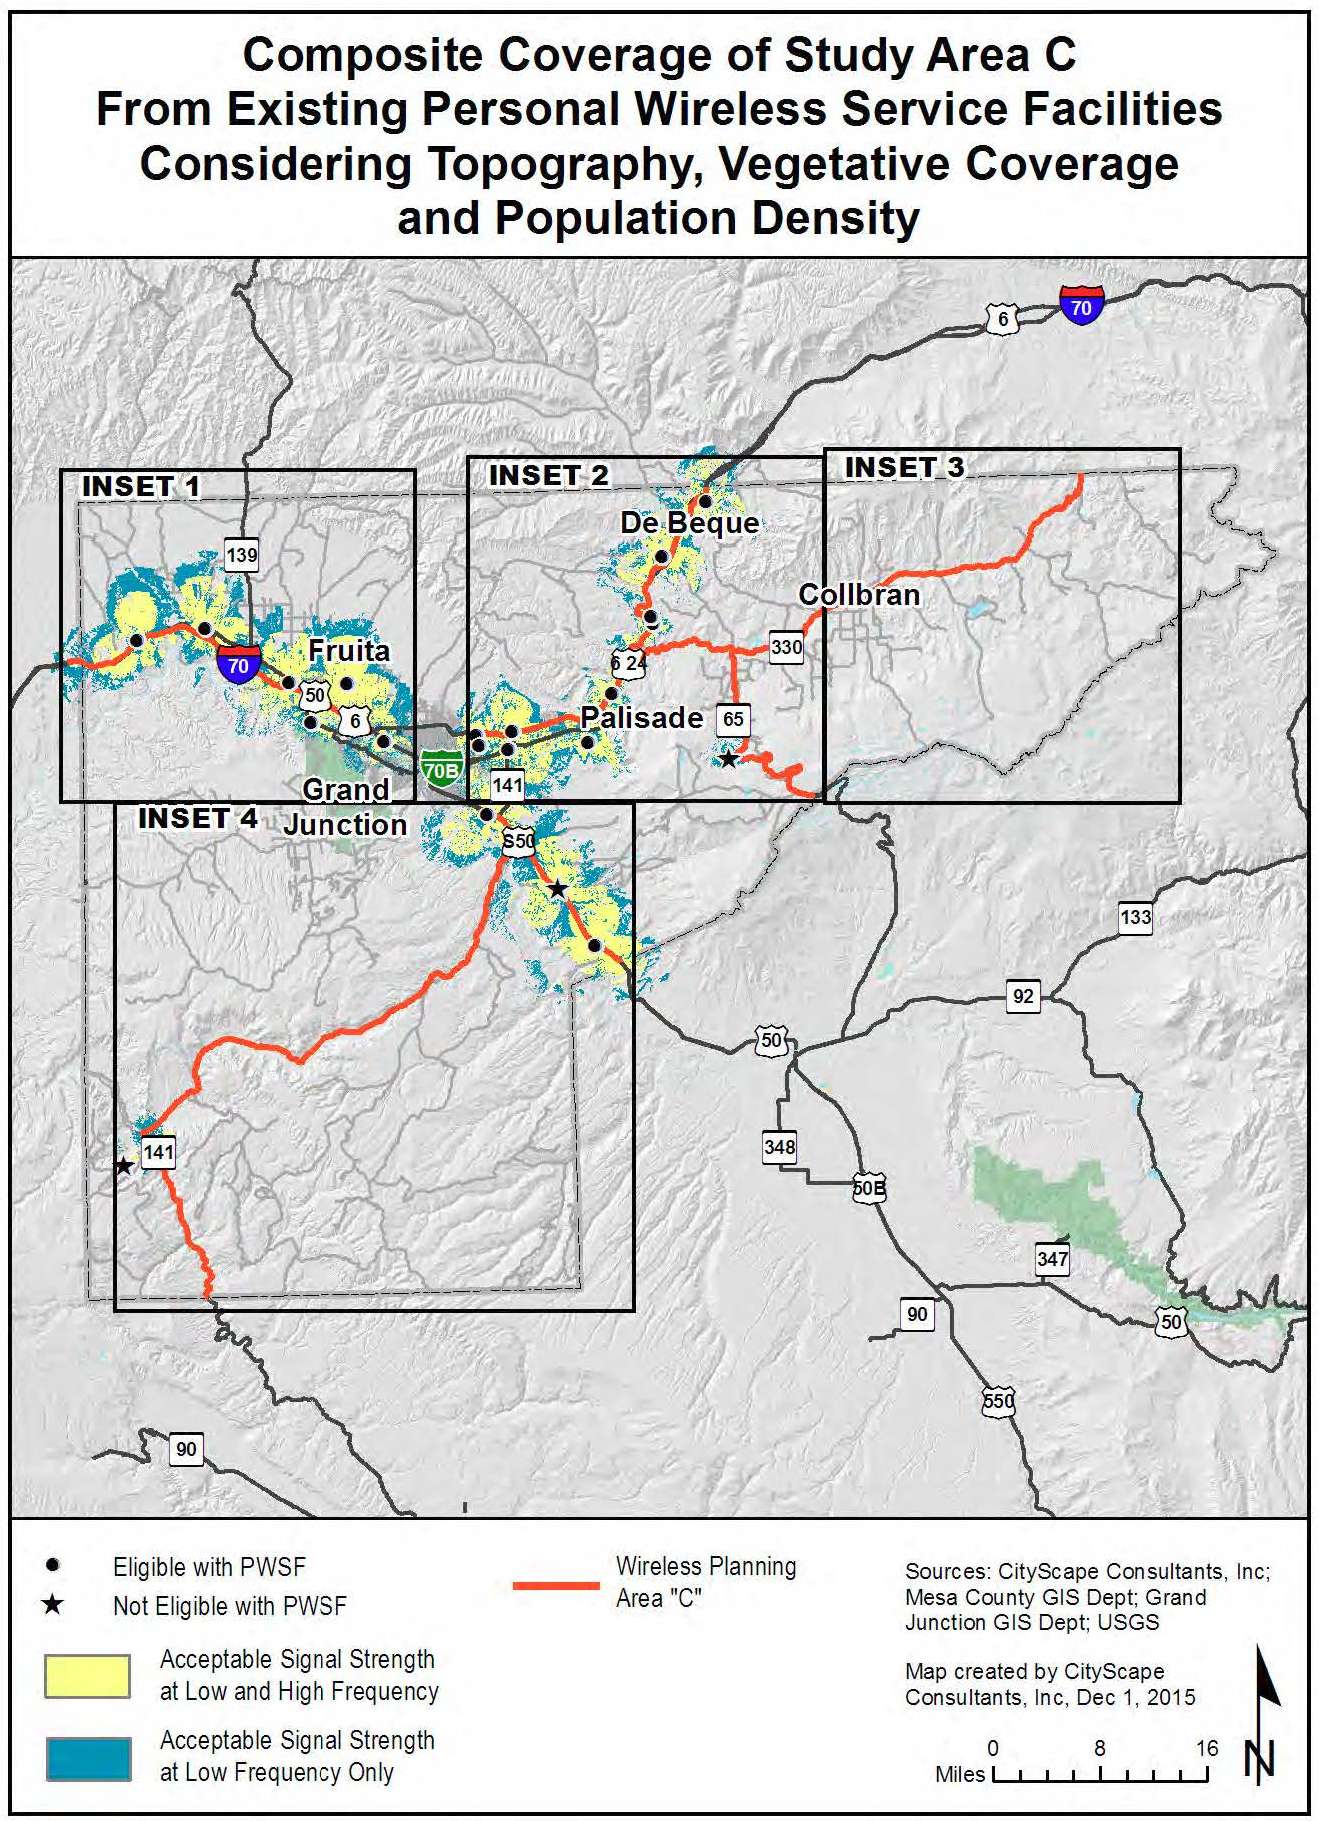
Figure 56: Current Potential Coverage Including Future Growth
(Ord. 4703, 6-1-16)
31.12.690 Estimation of future antenna sites: Inset 1.
CityScape estimates that six new towers or base stations will be needed over the next 10 to 15 years along the I-70 corridor as shown in Figure 57.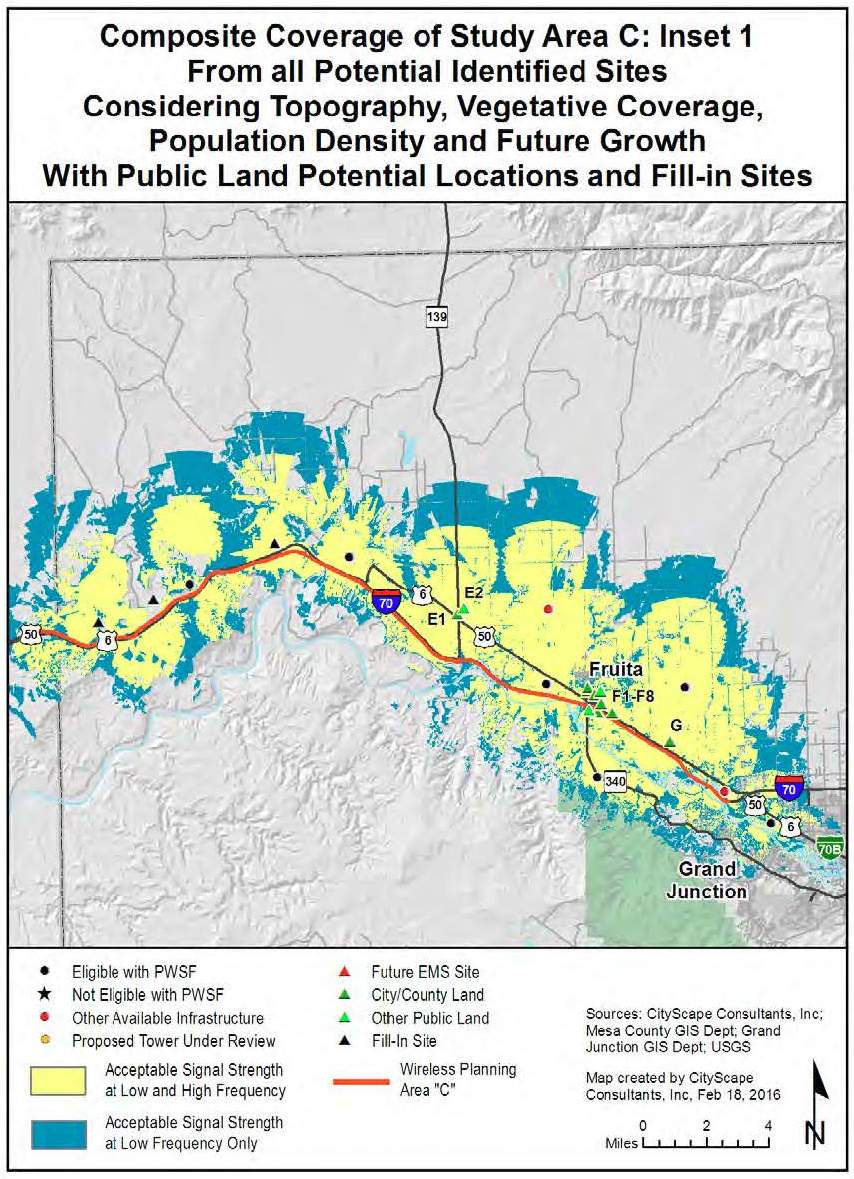
Figure 57: Coverage with Future Fill-In Inset 1
(Ord. 4703, 6-1-16)
31.12.700 Estimation of future antenna sites: Inset 2.
CityScape estimates that, in addition to adding three proposed emergency service facilities, eight new towers or base stations will be needed over the next 10 to 15 years along the corridors shown in Figure 58.
Approximately 15 new sites would be needed to provide complete coverage. However, the sites along Highway 65 and Highway 330 will likely not be a high priority for the industry and therefore, four of the 15 sites have not been turned on.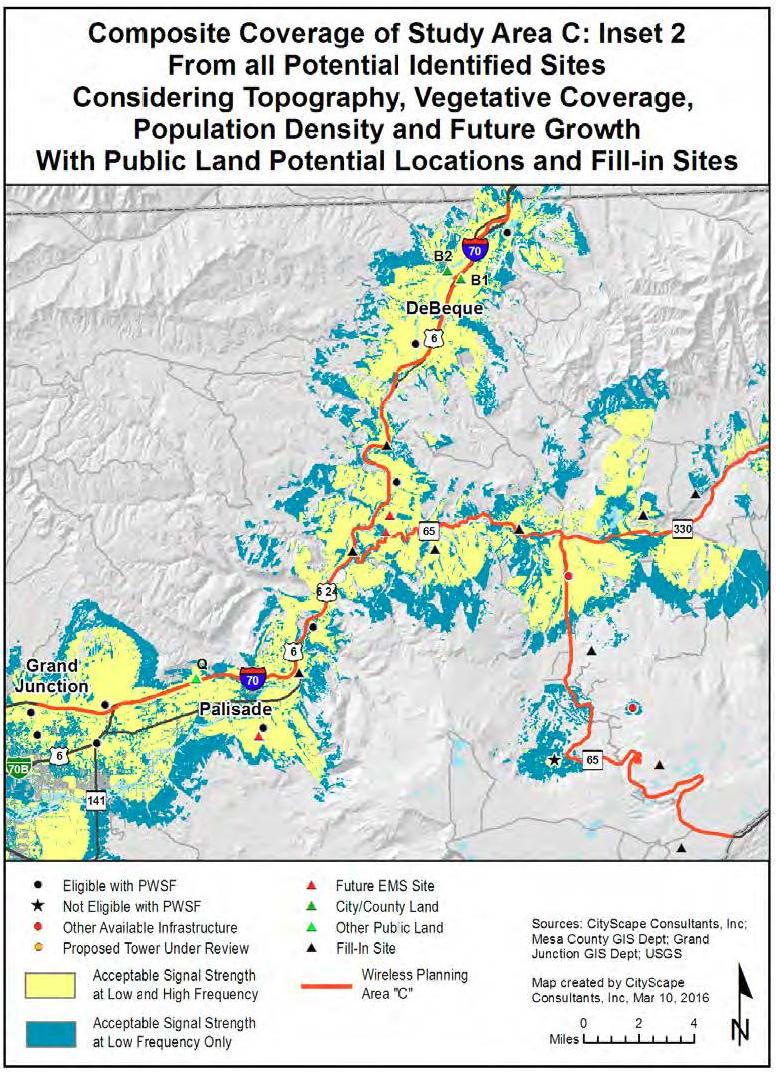
Figure 58: Coverage with Future Fill-In Inset 2
(Ord. 4703, 6-1-16)
31.12.710 Estimation of future antenna sites: Inset 3.
Highway 330 from the Town of Collbran eastward to the County line is a secondary highway and will not likely be a high priority for the service providers over the next 10 to 15 years due to the low subscriber base. CityScape has identified seven facilities to fill in the coverage gaps along the highway but is only turning on Site C (also in the Town of Collbran Study Area) and the three tower locations identified as potential emergency management service facilities shown in Figure 59.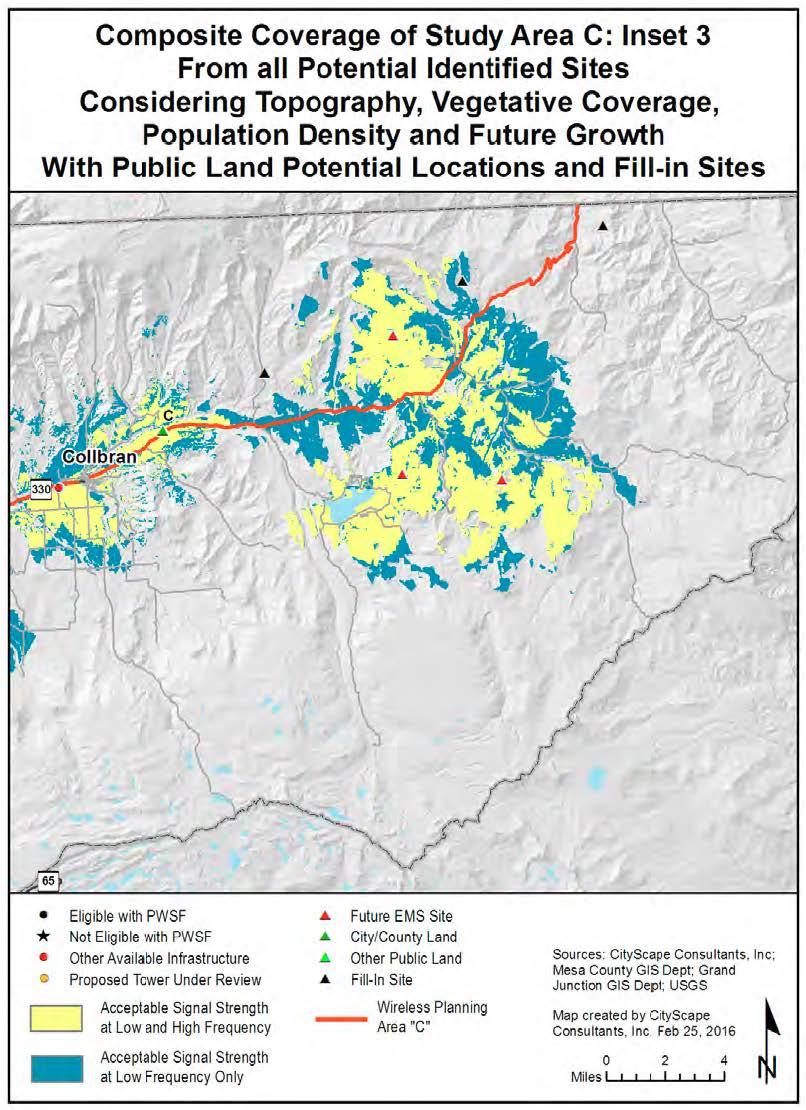
Figure 59: Coverage with Future Fill-In Inset 3
(Ord. 4703, 6-1-16)
31.12.720 Estimation of future antenna sites: Inset 4.
Providing coverage along Highway 141 will be challenging due to the topography of the area. It is not likely the industry will provide near term coverage to this corridor because of the rural and undeveloped nature of the area. CityScape included the use of seven proposed emergency service facilities in the coverage map and forecasts that seven additional towers or base stations would be needed to provide full coverage along the corridors as shown in Figure 60. CityScape anticipates that two of the seven proposed facilities may be built south of the Highway 50 and Highway 141 intersection.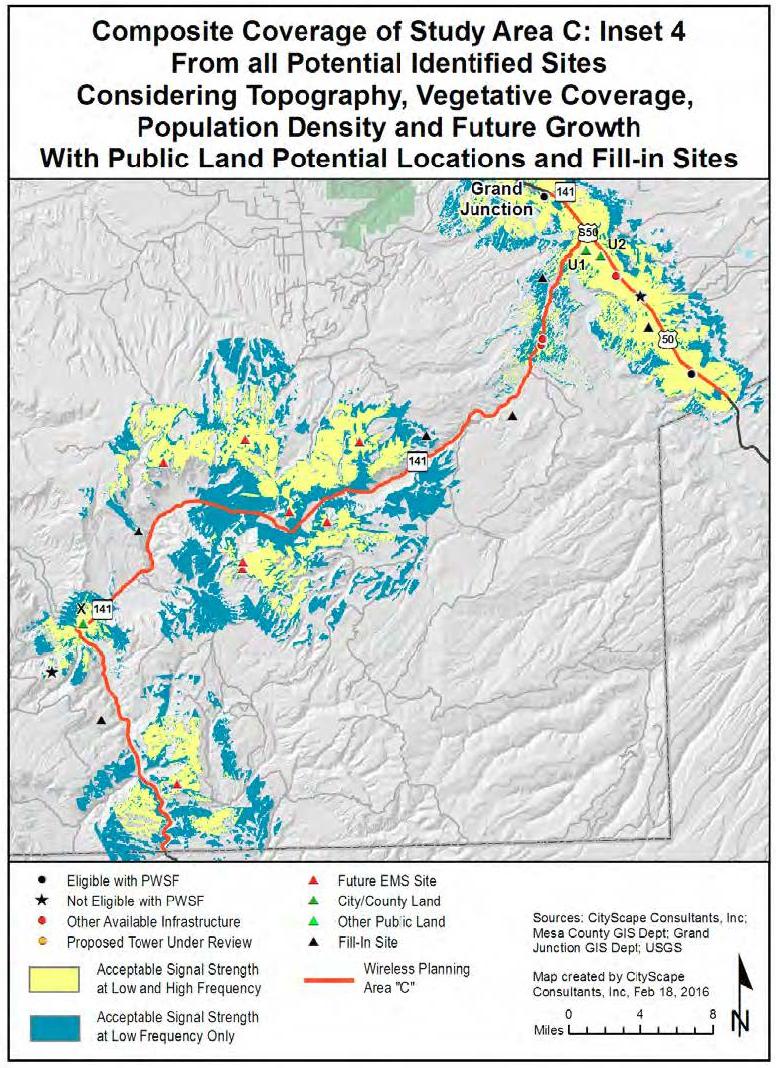
Figure 60: Coverage with Future Fill-In Inset 4
(Ord. 4703, 6-1-16)
31.12.730 Summary.
Wireless connectivity has become an increasingly important part of our everyday lives. Wireless telecommunication technology has evolved rapidly over the past 20 years providing capabilities that have resulted in dramatically increased cellular phone and Internet use. Cellular phones used to be just a way of making a phone call when you were away from home or work. Now we use smartphones and tablets to shop, find restaurants, compare prices, buy movie tickets, bank, navigate, and to stay in touch through social media sites. First responders throughout Mesa County rely more and more on cellular data communication in the field, as do 911 callers in an emergency situation. The demand for wireless Internet and data service coverage and capacity has strained existing telecommunication network facilities and is causing cellular service providers to plan for the construction of new infrastructure.
Due to the semi-remote location of Mesa County, wireless technologies are critical for personal, business and emergency communication, and are heavily relied upon by residents and visitors. The blend of urban and undeveloped areas, year-round recreational activity, communication needs, and canyons, valleys, plateaus and ridge lines all create difficult coverage challenges for service providers. Wireless telecommunications master planning is an approach taken by communities to determine wireless service industry deployment patterns and to identify gaps in network coverage. With this information communities can develop strategies to fill in those gaps.
The benefits of a WMP are multi-faceted, addressing community, economic development, and planning needs, as well as emergency service provider requirements. A comprehensive approach to wireless development will align the needs of personal wireless and broadband service providers with optimal infrastructure solutions that will support government and community objectives, allowing for infrastructure planning and development that will accommodate multiple providers, improve public safety and help to attract and retain residents and businesses.
(Ord. 4703, 6-1-16)
31.12.740 Grand Junction/Persigo 201 study area.
Due to the concentration of population and urban characteristics of the City of Grand Junction, CityScape estimates that the largest number of new sites constructed over the next 10 to 15 years will be built in and around the Persigo 201 Study Area. Approximately 11 to 18 new towers or base stations will be needed to fill in the anticipated coverage gaps. The projection model that CityScape designed assumes that all existing tower and base station locations will be used for maximum co-location and/or replacement opportunities in an effort to reduce the number of new towers and base stations required within a given geographic area. Should the industry not maximize the use of existing facilities, a greater number of towers will need to be constructed over this same time period. It should also be noted that even with this increase in new facilities, some areas within the study area will still be underserved due to the terrain and rural characteristics around the periphery of the study area.
(Ord. 4703, 6-1-16)
31.12.750 Countywide.
CityScape estimates that five to eight co-locations, upgrades or antenna modifications (in any combination) per year can be anticipated over the next 10 years. Over the next 15 years, up to 40 new tower or base station sites will be needed Countywide to fill coverage gaps and/or increase capacity. The more populated areas of the County will likely see the development of “small cell” sites that consist of multiple concealed antennas located relatively close together on shorter towers or existing support structures like light and utility poles. Rural areas are more likely to be served by towers that can provide coverage over larger geographic areas.
(Ord. 4703, 6-1-16)
31.12.760 Ongoing goals and objectives to maximize the benefits of the master plan.
The City of Grand Junction and Mesa County will need to manage the development of wireless telecommunication infrastructure in order to maximize the use of existing towers and base stations and to minimize the total number of new facilities needed to fill in coverage gaps. The Wireless Master Plan recommends the following action items be implemented to meet these goals:
(a) Maintain the wireless facilities inventory, updating it as facilities are added or modified, and make it available to the public online through the City and County websites.
(b) Prepare amendments to the City and County development codes that update zoning requirements and review procedures for wireless telecommunications facilities to make the codes compliant with current FCC regulations.
(1) Update the development codes as needed when regulations change.
(c) Maintain a priority site list of fill-in sites, identifying properties that are both publicly and privately owned, that meet the criteria established for preferred cellular facilities. Properties that are on the priority site list may be eligible for expedited administrative review of wireless facilities, provided the proposed facility meets the concealment requirements identified at the time of inclusion on the priority list, and all other applicable standards of the development code. The criteria for priority sites are:
(1) The property shall be located within the Grand Junction Persigo 201 Boundary or can be included in the Grand Junction Persigo 201 Boundary.
(2) The property shall be one acre minimum in lot size.
(3) The property shall have vehicular access to an improved public right-of-way.
(4) The property shall have access to utilities.
(5) The property shall be outside the 100-year floodplain.
(6) The cellular facility shall meet all City development standards and be subject to all regulations of the zoning code.
(7) Concealment is required and the owner of the property must identify the type of concealment proposed, prior to inclusion on the priority site list, with the understanding that if accepted by the City, then any type of concealment aside from what is proposed and accepted at the time of the Master Plan vetting process would require a conditional use permit (CUP).
(d) Seek out public/private partnerships to encourage the development of wireless facilities in rural areas that are underserved and have significant coverage gaps.
(e) Where feasible, plan for the ability to co-locate private wireless facilities on public safety communication infrastructure, in order to fill coverage gaps and provide better service to residents.
(f) Encourage the development of broadband infrastructure that will help support the development of wireless infrastructure.
(g) Work with economic development partners to seek out opportunities to expand wireless telecommunication facilities to support business development.
(h) Maintain awareness of evolving concealment options so the design and planning processes of new towers will blend visually within the community they serve.
(Ord. 4703, 6-1-16)
Appendix Wireless Infrastructure Inventory.
(Ord. 4703, 6-1-16)