


Chapter 45.04
GRAND VALLEY REGIONAL WATER CONSERVATION PLAN
Sections:
Article I. General Provisions
Article II. The Regional Water Conservation Plan Entities: The City of Grand Junction, Clifton Water District, and the Ute Water Conservancy District
45.04.050 Overview of the Grand Valley.
45.04.060 Water conservation plan.
45.04.070 Water conservation planning process.
45.04.080 City of Grand Junction – History and water rights.
45.04.090 City of Grand Junction – Retail water sales.
45.04.100 City of Grand Junction – Current rate structure and tap fees.
45.04.110 City of Grand Junction – Planned new water facilities.
45.04.120 Clifton Water District – History and water supply.
45.04.130 Clifton Water District – Retail water sales.
45.04.140 Clifton Water District – Current rate structure and tap fees.
45.04.150 Clifton Water District – Planned new water facilities.
45.04.160 Ute Water Conservancy District – History and water supply.
45.04.170 Ute Water Conservancy District – Retail water sales.
45.04.180 Ute Water Conservancy District – Sector water use.
45.04.190 Ute Water Conservancy District – Current rate structure and tap fees.
45.04.200 Ute Water Conservancy District – Planned new water facilities.
45.04.210 Future water demands in the Grand Valley.
Article III. The Grand Valley Regional Water Conservation Plan
45.04.220 Current and ongoing water conservation.
45.04.230 Drought Response Plan.
45.04.240 The Children’s Water Festival.
45.04.250 Low water use landscape programs.
45.04.260 Leak detection programs.
45.04.270 Increasing block rate structures.
45.04.280 Grand Valley Regional Water Conservation Plan – Goals and objectives.
45.04.290 Grand Valley Regional Water Conservation Plan – Plan elements.
45.04.300 Regional water conservation measures and programs.
45.04.310 Modification of water demand forecast.
45.04.320 Monitoring and evaluation of the water conservation program components.
45.04.330 Plan updates and revisions.
Article IV. References
Article V. Maps of Water Providers and Irrigation Systems in the Grand Valley
45.04.350 Grand Valley domestic water providers.
Article VI. Clifton Water District, City of Grand Junction, Town of Palisade and Ute Water Conservancy District Drought Response Plan
45.04.360 Drought Response Plan Introduction.
45.04.370 Drought Response Plan – Stages of drought.
45.04.380 Response to drought.
Article I. General Provisions
45.04.010 Adoption.
The Grand Valley Regional Water Conservation Plan is adopted as the official policy of the City of Grand Junction and by its adoption the City encourages its customers to use water efficiently as detailed in the Plan.
(Res. 24-12, 6-20-12)
45.04.020 Acknowledgements.
This project was funded through a grant provided by the Colorado Water Conservation Board, a division of the Department of Natural Resources in the State of Colorado. The City of Grand Junction, the Clifton Water District, and Ute Water Conservancy District provided oversight of the completion of this project and provided in-kind service as well as cash contributions as a provision of the funding. Rebecca Nichols of RHN Water Resources Consultants, LLC, acted as the project manager and the primary author of this document.
Many people contributed to this project. Especially important to this project was the contribution that Rick Brinkman, representative from the City of Grand Junction, Dave Reinertsen and Kelly McLaughlin, representatives from the Clifton Water District, and Joe Burtard and Steve Ryken, representatives from the Ute Water Conservancy District, made with their time and knowledge. Also important are the contributions that the respective managers made to the project.
(Res. 24-12, 6-20-12)
45.04.030 Acronyms.
|
Name |
Acronym |
|---|---|
|
Acre feet |
af |
|
Cubic feet per second |
cfs |
|
City of Grand Junction |
The City |
|
Clifton Water District |
Clifton |
|
Colorado Water Conservation Board |
CWCB |
|
Commercial and Industrial |
C-I |
|
Gallons per day |
gpd |
|
Gallons per capita per day |
GPCD |
|
Million gallons per day |
mgd |
|
Million gallons per year |
mgy |
|
Municipal and industrial |
M&I |
|
The City, Clifton, and Ute |
The entities |
|
United States Bureau of Reclamation |
BOR |
|
Ute Water Conservancy District |
Ute, the District |
|
Water treatment plant |
WTP |
|
Water conservation plan |
WCP |
(Res. 24-12, 6-20-12)
45.04.040 Mission statement.
To promote water conservation by example, education, and innovation for the purpose of securing the future water needs of the Grand Valley.
(Res. 24-12, 6-20-12)
Article II. The Regional Water Conservation Plan Entities: The City of Grand Junction, Clifton Water District, and the Ute Water Conservancy District
45.04.050 Overview of the Grand Valley.
The Grand Valley is located in western Colorado and encompasses a large portion of Mesa County. Within the Grand Valley are the City of Grand Junction, City of Fruita, Town of Palisade, and the unincorporated areas of Clifton, Loma, and Mack. The Grand Valley was settled in the late 1800s, and by the early 1900s, six major ditch companies and irrigation districts that divert water from the Colorado and Gunnison Rivers, including a Bureau of Reclamation project, were established. These ditch and canal systems provide irrigation water to most of the Grand Valley today. Located in GJMC 45.04.350 is a map of the major irrigation systems in the Grand Valley. Also located in GJMC 45.04.350 is a map of the domestic water providers in the Grand Valley.
The Grand Valley was established as a farming community and is still known for its fruit orchards. Today a thriving wine industry is adding to the agricultural mix; however, recent growth has replaced much of the irrigated farmland with residential development. The climate in the Grand Valley is one of hot summers, temperate falls and springs with mild winters. The average precipitation is nine to 10 inches or less with the irrigation season starting as early as late March and continuing through October.
(Res. 24-12 (1.0), 6-20-12)
45.04.060 Water conservation plan.
A water conservation plan (WCP) is a plan for the development and utilization of a set of strategies. The purpose of a water conservation plan is to help water purveyors improve their overall water use efficiency by addressing issues of supply and demand problem areas and providing a defined method of solving problems and dealing with system inefficiencies. A WCP can also provide both water suppliers and the local communities a means of using their water resources in a wise and prudent manner thus managing this precious exhaustible resource to its maximal responsible use.
This WCP is intended to be broad and flexible so that it can be adapted to changing water conservation efforts over time. Through effort and cooperation of the City of Grand Junction, Clifton Water District, and the Ute Water Conservancy District (the entities), this Regional Water Conservation Plan has been developed for the Grand Valley. The ultimate goal of creating a regional water conservation effort is to provide unified water education and community outreach programs that will aid the public in developing meaningful water conservation practices.
(Res. 24-12 (1.0), 6-20-12)
45.04.070 Water conservation planning process.
(a) Profiling the Water Systems. For each of the entities, information was gathered and documented in this plan to assist with identifying and analyzing water conservation opportunities. Included in each of the water providers’ profiles are descriptions of the water systems including the water rights and the delivery systems as well as the general population served. Each of the entities’ profiles also characterizes current water use and forecasts future demand. Historical data was obtained from water conservation plans produced by each of the entities in 1996.
Population forecasts were developed from the Colorado State Demographer and were derived through economic forecasts, labor supply and demand, and population migration. All variables were modeled and County population forecasts were developed based upon the 2010 U.S. Census. The State Demographer has estimated that growth in Mesa County will be two percent every five years; however, it should be noted that the population in western Colorado has been on the decline for the past two years due to the general economic downturn of the United States.
(b) Current Water Conservation Measures and Programs. Article III of this chapter (GJMC 45.04.220 through 45.04.330) discusses current programs and measures in the Grand Valley that have been developed to educate the public about water conservation and drought management. These programs and measures include all programs developed by both of the domestic water purveyors and the irrigation water providers, as well as institutional interests that include the Mesa County Government and the Colorado State University research center.
(c) The Grand Valley Regional Water Conservation Plan. The development of the Regional Water Conservation Plan includes the formation of water conservation goals, the identification and selection of water conservation measures, the integration and modification of water demand forecasts, and the implementation of the water conservation plan.
(1) Water Conservation Goals. Water conservation goals were set based on the criteria of:
(i) The water conservation plan mission;
(ii) The cost effectiveness of the goals;
(iii) The benefits of the goals.
(2) Defining a Plan of Action. The water conservation measures or plans of action were determined by evaluating proposed alternatives. The water conservation measures that best met the criteria were selected for implementation.
(3) Implementation of the Plan of Action. Each water conservation measure was prioritized for implementation based on its relative importance as determined by the Steering Committee (Rick Brinkman – City, Joe Burtard – Ute, and Dave Reinertsen – Clifton) and the Governing Boards of Directors of the City, Clifton, and Ute. A planning-level budget and schedule were developed as well as prospective funding sources for each measure.
(4) Evaluating and Monitoring the Progress and Updating the Water Conservation Plan. Progress reviews will be conducted annually by the Steering Committee to evaluate the effectiveness of water efficiency measures and conservation plan goals. The water conservation plan will be evaluated, updated to meet additional State requirements, and modified as necessary by the Steering Committee.
(Res. 24-12 (1.0), 6-20-12)
45.04.080 City of Grand Junction – History and water rights.
The City of Grand Junction was founded in 1881 and by 1911 had obtained the paramount water right of 7.81 cfs from Kannah Creek. In 1911 the City constructed a pipeline from Kannah Creek that delivered up to five mgd to the City’s residents. In the late 1930s, the City constructed a treatment plant on “Reservoir Hill” that would treat up to five million gallons per day (mgd). The plant was expanded in 1946 to treat an additional 2.13 mgd.
In 1947 the City constructed Carson Reservoir in the Kannah Creek area to hold 650 acre feet of water. In 1955, the City acquired Hallenbeck No. 1 Reservoir, aka Purdy Mesa Reservoir, Juniata Reservoir, and Reeder Reservoir, all located on the lower slopes of the Grand Mesa, along with direct flow rights to fill the reservoirs. At the same time, the City began plans to construct a second delivery pipeline. The second pipeline increased the delivery capacity to the City of 12.5 mgd. In 1957, the City also acquired water rights from the Gunnison River in the amount of 120 cubic feet per second (cfs) and acquired additional storage in Raber Click and Juniata Reservoirs.
In 1959, the City acquired water rights from the Colorado River in the amount of 120 cfs. During the 1960s, a new water treatment plant was constructed to treat up to 16 mgd. This plant is currently in use and provides the City’s residents high quality water. The City currently has eight mg of potable storage and approximately 13,000 acre feet of raw storage.
During the late 1970s and early 1980s, the City helped the Clifton Water District build a new water treatment plant that would treat up to eight mgd. The benefit to the City was that Clifton would provide up to 4.5 mgd to the City if needed. The City also enlarged Juniata Reservoir and the pumping capacity at the pump station on the Gunnison River. In addition, the City purchased several reservoirs on Grand Mesa and other priority direct flow rights on Kannah Creek. In 1989, the City purchased the Somerville Ranch along with the ranch’s water rights to ensure that the City could provide water to its residents even during the most severe drought. Table 45.04.080(a) and Table 45.04.080(b) are lists of the City of Grand Junction’s water rights.
|
Water Right Name |
Stream Name |
Acre Feet |
Use |
Comments |
|---|---|---|---|---|
|
Anderson Reservoir No. 1 |
North Fork of Kannah Creek |
506.0 |
IM |
|
|
Anderson Reservoir No. 2 |
North Fork of Kannah Creek |
595.0 |
IM |
|
|
Anderson Reservoir No. 6 |
North Fork of Kannah Creek |
118.0 |
IM |
|
|
Bolen A&J Reservoir No. 2 |
North Fork of Kannah Creek |
293.0 |
IM |
|
|
Bolen Reservoir |
North Fork of Kannah Creek |
535.7 |
IM |
|
|
Carson Lake |
Kannah Creek |
637.0 |
M |
|
|
Deep Creek Reservoir #2 |
Kannah Creek |
66.5 |
I |
|
|
Dry Creek Reservoir & Supply |
Kannah Creek |
66.0 |
I |
aka Chambers Reservoir |
|
Flowing Park Reservoir |
Kannah Creek |
782.0 |
IM |
|
|
Grand Mesa Reservoir No. 1 |
Kannah Creek |
559.0 |
I |
|
|
Hallenbeck #1 Reservoir |
Kannah Creek |
659.0 |
IM |
aka Purdy Mesa Reservoir |
|
Hallenbeck #2 Reservoir |
Kannah Creek |
459.0 |
IM |
aka Raber Click Reservoir |
|
Juniata Reservoir |
Kannah Creek |
7,204.0 |
IM |
|
|
Purdy Mesa Reservoir No. 2 |
Kannah Creek |
2.5 |
M |
|
|
Reeder Reservoir |
North Fork of Kannah Creek |
179.7 |
I |
|
|
Somerville Reservoir #1 |
Whitewater Creek |
973.0 |
IM |
|
|
I – Irrigation, M – Municipal |
||||
|
Water Right Name |
Stream Name |
Cubic Feet per Second |
Use |
Comments |
|---|---|---|---|---|
|
Bauer Ditch |
North Fork of Kannah Creek |
13.18 |
IS |
|
|
Brandon Ditch |
Whitewater Creek |
33.40 |
IM |
|
|
City Ditch |
North Fork of Kannah Creek |
22.80 |
M |
|
|
Grand Jct Flowline |
Kannah Creek |
11.72 |
M |
|
|
Juniata Ditch 1st Enlarged |
Kannah Creek |
129.00 |
M |
|
|
Kannah Crk Highline Ditch |
Whitewater Creek |
49.11 |
IM |
|
|
Laurent Ditch |
North Fork of Kannah Creek |
33.72 |
IS |
|
|
Gunnison River Pipeline |
Gunnison River |
120.00 |
M |
|
|
Colorado River Pipeline |
Colorado River |
80.00 |
DM |
|
|
Somerville Ranch Irrigation System |
Whitewater Creek |
3.00 |
IS |
|
|
Somerville Wells No. 1 |
Whitewater Creek |
0.22 |
DS |
|
|
Somerville Wells No. 2 |
Whitewater Creek |
0.44 |
DS |
|
|
D – Domestic, I – Irrigation, M – Municipal, S – Stock |
||||
(Res. 24-12 (2.0), 6-20-12)
45.04.090 City of Grand Junction – Retail water sales.
The City of Grand Junction incorporated area covers 39 square miles with a population of over 58,000. The City water service area covers nine square miles and serves a population of just over 27,000 people. The majority of the service area is in the center of the City, and west Orchard Mesa. The rest of the incorporated portions of the City are served by the Ute Water Conservancy District (see domestic water providers map, GJMC 45.04.350). For 2011 there were 9,185 taps in use with an average water demand of 1,691,000,000 gallons per year for the years of 2005 through 2011. During that same time period, commercial water taps were approximately 14 percent of total taps. For the years of 2005 through 2011, commercial water use ranged between 36 percent and 39 percent of total water demand with almost one-third of the commercial water use allocated to the top five largest commercial water users. The unbilled water was calculated to be 9.7 percent of treated water (the percent difference between treatment plant effluent and metered water sales). “Unbilled water” is unaccounted water used in emergency firefighting, main-line breaks, unfound leaks, unauthorized water use, and metering inaccuracies.
The average daily demand for January for the study period was 2,700,000 gallons per day (mgd) and the average daily demand in July was 7.9 mgd. The ratio of the January daily demand to the July daily demand was 2.9 or water demand for July is 2.9 times that of an average day in January. This difference is mainly due to lawn irrigation and home cooler demand during the hot summer months. Table 45.04.090(a) shows the City’s monthly and annual billed water for the years 2005 through 2011 as well as detailed water use for those years. Figure 45.04.090 illustrates the annual water demand for the years of 2005 through 2011. Table 45.04.090(b) shows the residential and commercial water use, number of taps, and percentage of water use in the City. Table 45.04.090(c) shows the City’s top five largest C-I water users for 2011.
|
Year |
Jan |
Feb |
Mar |
Apr |
May |
Jun |
Jul |
Aug |
Sep |
Oct |
Nov |
Dec |
Total |
|---|---|---|---|---|---|---|---|---|---|---|---|---|---|
|
|
|
|
|
|
|
|
|
|
|
|
|
|
|
|
2005 |
76 |
72 |
72 |
99 |
133 |
212 |
214 |
222 |
220 |
159 |
103 |
77 |
1,659 |
|
2006 |
89 |
79 |
96 |
101 |
152 |
240 |
242 |
214 |
227 |
144 |
88 |
92 |
1,763 |
|
2007 |
77 |
75 |
89 |
93 |
120 |
222 |
242 |
272 |
225 |
151 |
126 |
83 |
1,775 |
|
2008 |
72 |
80 |
76 |
165 |
172 |
279 |
236 |
199 |
195 |
99 |
80 |
96 |
1,748 |
|
2009 |
90 |
79 |
78 |
95 |
137 |
169 |
224 |
236 |
216 |
204 |
102 |
74 |
1,703 |
|
2010 |
95 |
60 |
77 |
85 |
120 |
164 |
245 |
222 |
176 |
205 |
111 |
82 |
1,644 |
|
2011 |
87 |
54 |
79 |
75 |
134 |
154 |
207 |
185 |
233 |
181 |
76 |
78 |
1,543 |
|
|
|
|
|
|
|
|
|
|
|
|
|
|
|
|
Average |
84 |
71 |
81 |
102 |
138 |
206 |
230 |
222 |
213 |
163 |
98 |
83 |
1,691 |
|
Detailed Water Use |
||
|---|---|---|
|
Average Annual Water Use |
1,690.6 |
mg |
|
Average Unbilled Water |
184.3 |
mg |
|
Average Annual Water Loss |
9.7% |
|
|
Average Day Use (July) |
7.9 |
mgd |
|
Average Day Use (January) |
2.7 |
mgd |
|
Average July Day to Average January Day Ratio |
2.9 |
|
Figure 45.04.090 – City of Grand Junction Water Demand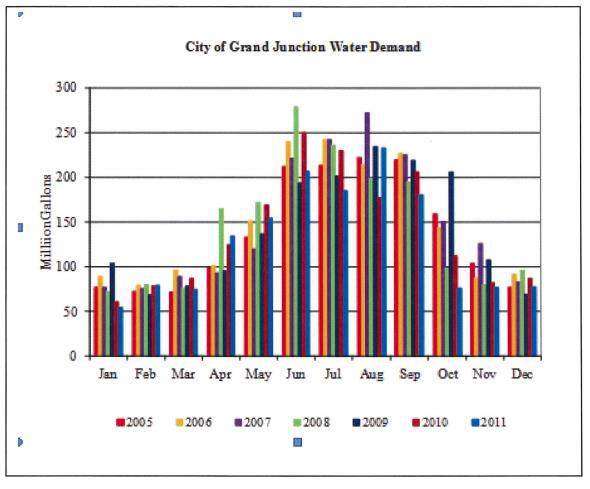
|
Year |
Customer Class |
Total Taps |
Metered Water (1,000 gallons) |
Average per Tap (1,000 Gallons) |
Per Capita |
Water Use % of Total |
|---|---|---|---|---|---|---|
|
2011 |
Residential |
7,897 |
962,291 |
122 |
98 |
62.4% |
|
Commercial |
1,288 |
580,838 |
451 |
|
37.6% |
|
|
Total |
9,185 |
1,543,129 |
|
|
|
|
|
|
|
|
|
|
|
|
|
2010 |
Residential |
7,897 |
1,014,260 |
128 |
104 |
61.7% |
|
Commercial |
1,288 |
629,929 |
489 |
|
38.3% |
|
|
Total |
9,185 |
1,644,189 |
|
|
|
|
|
|
|
|
|
|
|
|
|
2009 |
Residential |
7,977 |
1,059,819 |
133 |
109 |
62.2% |
|
Commercial |
1,316 |
642,728 |
488 |
|
37.8% |
|
|
Total |
9,293 |
1,702,547 |
|
|
|
|
|
|
|
|
|
|
|
|
|
2008 |
Residential |
8,139 |
1,072,170 |
132 |
110 |
61.3% |
|
Commercial |
1,280 |
676,077 |
528 |
|
38.7% |
|
|
Total |
9,419 |
1,748,247 |
|
|
|
|
|
|
|
|
|
|
|
|
|
2007 |
Residential |
8,259 |
1,136,014 |
138 |
117 |
64.0% |
|
Commercial |
1,421 |
638,582 |
449 |
|
36.0% |
|
|
Total |
9,680 |
1,774,596 |
|
|
|
|
|
|
|
|
|
|
|
|
|
2006 |
Residential |
8,124 |
1,126,770 |
139 |
118 |
63.9% |
|
Commercial |
1,420 |
636,025 |
448 |
|
36.1% |
|
|
Total |
9,544 |
1,762,795 |
|
|
|
|
|
|
|
|
|
|
|
|
|
2005 |
Residential |
8,087 |
1,064,358 |
132 |
113 |
64.2% |
|
Commercial |
1,220 |
594,409 |
487 |
|
35.8% |
|
|
Total |
9,307 |
1,658,767 |
|
|
|
|
|
|
||||||
|
Note: |
Residential uses were combined for both single-family and multifamily taps. Commercial: includes City, governmental and commercial accounts. |
|||||
|
Per Capita: |
Calculated residential and multifamily population, 2.34 persons per unit; annual residential billing divided by 365 (days per year) equals gallons per day; gallons per day divided by population equals daily individual use. |
|||||
|
Customer |
Sector |
Percentage |
Water Use (million gallons) |
|---|---|---|---|
|
City of Grand Junction |
Government |
9.8% |
150.5 |
|
Colorado Mesa University |
Education |
2.6% |
43.8 |
|
St. Mary’s Hospital |
Hospital |
2.3% |
39.0 |
|
School District 51 |
Education |
1.8% |
30.0 |
|
Mesa County |
Government |
1.7% |
29.1 |
|
|
|||
|
Total water used by the five largest C-I customers in 2011 |
292 |
||
|
|
|
|
|
|
Total water billed in 2011 |
1,543 |
||
|
Percentage of 2011 billed water |
19.0% |
||
(Res. 24-12 (2.0), 6-20-12)
45.04.100 City of Grand Junction – Current rate structure and tap fees.
Water rates for the City were set to finance operation and maintenance of the water system, capital improvements of the water system, and legal expenses that insure the City’s water rights. The City’s water rates are based on an increasing block rate structure for all taps. Tap fees and plant investment fees provide monies for the operation and maintenance of the water treatment plant. Table 45.04.100(a) and Table 45.04.100(b) show the City’s water rates and tap fees. Taps of three-quarters-inch and one-inch are typically residential taps while all other taps are commercial and industrial taps.
|
Rate |
Gallons |
|---|---|
|
$9.00 (includes 3,000 gal) |
0 – 3,000 |
|
$1.85 (per 1,000 gal) |
3,001 – 10,000 |
|
$2.25 (per 1,000 gal) |
10,001 – 20,000 |
|
$2.65 (per 1,000 gal) |
20,001+ |
|
Tap Size |
Tap |
PIF* |
Total Fees |
|---|---|---|---|
|
3/4" |
$700 |
$300 |
$1,000 |
|
1" |
$875 |
$375 |
$1,250 |
|
1-1/2" |
$2,050 |
$900 |
$2,950 |
|
2" |
$2,900 |
$1,250 |
$4,150 |
|
3" |
$2,975 |
$6,875 |
$9,850 |
|
4" |
$12,850 |
$5,550 |
$18,400 |
|
6" |
$19,850 |
$8,550 |
$28,400 |
|
*Plant investment fees |
|||
(Res. 24-12 (2.0), 6-20-12)
45.04.110 City of Grand Junction – Planned new water facilities.
Because the growth rate in the City has been relatively small, no future expansion of the water treatment facilities or distribution lines is currently planned, though an aggressive capital plan is in place to replace aging infrastructure.
(Res. 24-12 (2.0), 6-20-12)
45.04.120 Clifton Water District – History and water supply.
The Clifton Water District (Clifton) was formed in 1951 to provide domestic water to residents in Mesa County located between the City of Grand Junction and the Town of Palisade, in an unincorporated area of Mesa County commonly referred to as Clifton. Clifton constructed a 0.68 mgd water treatment plant on Orchard Mesa with the water source being the City’s Purdy Mesa Flowline. Clifton began serving water for 451 taps in April of 1958. The treatment plant was expanded to 1.27 mgd; however, it was abandoned in 1989 due to the plant’s inability to produce water quality to meet Colorado primary drinking water standards.
During the late 1970s, a new water treatment plant was constructed with the help of the City of Grand Junction. The plant’s initial capacity was 8.0 mgd but was expanded in 1982 to a 12.0-mgd capacity. The source of raw water for the new treatment plant was the Colorado River. In 2005, the treatment plant was upgraded with a new pretreatment settling system with plans to enhance the operations by constructing new filters and additional settling ponds in the future when growth warrants the expansion. Clifton currently has 10 mg of potable storage in six storage tanks.
Clifton owns 16.99 cfs in the Grand Valley Canal, owned and operated by the Grand Valley Irrigation Company (GVIC). Of the 16.99 cfs, 11.46 cfs, or 7.4 mgd, has been changed to an absolute domestic water right and is limited to 2,618 acre feet during the irrigation season of April through October. The remaining 5.53 cfs in the Grand Valley Canal remains an irrigation water right. The Grand Valley Canal water right is the calling water right on the Colorado River below the Shoshone Dam near Glenwood Springs. Clifton also owns 4.0 cfs at the L.H. Hurt Pump, and 14.1 cfs absolute and 5.9 cfs conditional in the Grand Junction Colorado River Pipeline. Table 45.04.120 is a summary of Clifton’s water rights.
|
Water Right Name |
Stream Name |
Cubic Feet per Second |
Use |
Comments |
|---|---|---|---|---|
|
Colorado River Pipeline |
Colorado River |
20.00 |
DM |
|
|
L.H. Hurt Pump |
Colorado River |
4.00 |
D |
Alt. Point at Grand Valley Canal |
|
Grand Valley Canal |
Colorado River |
16.99 |
DI |
1,100 shares domestic, 678 shares irrigation, Dom. ltd. to 2,618 af Apr – Oct |
|
D – Domestic, I – Irrigation, M – Municipal |
||||
(Res. 24-12 (3.0), 6-20-12)
45.04.130 Clifton Water District – Retail water sales.
Clifton currently provides retail water to residents and businesses that are located within Clifton’s 10,720-acre service area (in-district) as well as 1,600 acres located in the Whitewater area (a mix of both in-district and out-of-district customers). There are currently 10,837 taps with an average water demand of 1,125.90 mgy for the years of 2005 through 2011. Commercial water sales ranged from 5.1 percent to 7.9 percent of total sales and averaged 75,641 mgy for the seven-year period; however, commercial water taps averaged only 2.2 percent of total water taps. Historical water use is predominately residential at 93 percent with commercial use at approximately seven percent. Unbilled water has averaged 13 percent over the past seven years and is a result of water used in emergency firefighting, main-line breaks, unfound leaks, unauthorized water use, and metering inaccuracies.
Approximately 70 percent of homes in the Clifton Water District enjoy the use of direct flow irrigation water from the Palisade Irrigation District (PID), the Mesa County Irrigation District (MCID), and the Grand Valley Canal (GVIC). These self-governing entities control and regulate the supply delivery of the available irrigation water with the Clifton Water District having no jurisdictional control over their operations. Water shares in the PID and MCID are attached to the land by law, with the GVIC providing water shares through a market based ownership system. For those customers that have the opportunity to use the direct flow irrigation water, not all take advantage of the opportunity for whatever reason. Those that don’t use the direct irrigation flow water often utilize treated water for their outdoor irrigation purposes. As identified in GJMC 45.04.140, the Clifton water rate section, the per capita customer use data does include both those customers who utilize direct flow irrigation water and those that use domestic water for outdoor irrigation purposes.
The average daily demand for January for the study period was 2,100,000 gallons per day (mgd) and the average daily demand in July was 4.8 mgd. The ratio of the January daily demand to the July daily demand was 2.3 or water demand for July is 2.3 times that of an average day in January. This difference was due to lawn irrigation, home cooler water demand and other seasonal activities. Table 45.04.130(a) shows Clifton’s monthly and annual demand for the years 2005 through 2011 as well as detailed water use for those years. Figure 45.04.130 illustrates the annual water demand for the same period. Table 45.04.130(b) shows the residential and commercial water use, number of taps, and percentage of water use in the Clifton Water District. It should be noted that while residential taps increased steadily over the seven-year period, commercial taps remained relatively constant and constituted only 2.2 percent of the total water taps and averaged 6.4 percent of water sales for the study period. Table 45.04.130(c) shows the top five C-I sector water users for 2011.
|
Year |
Jan |
Feb |
Mar |
Apr |
May |
Jun |
Jul |
Aug |
Sep |
Oct |
Nov |
Dec |
Total |
|---|---|---|---|---|---|---|---|---|---|---|---|---|---|
|
|
|
|
|
|
|
|
|
|
|
|
|
|
|
|
2005 |
62 |
54 |
57 |
74 |
83 |
118 |
127 |
138 |
117 |
92 |
101 |
68 |
1,089 |
|
2006 |
56 |
57 |
56 |
75 |
99 |
130 |
157 |
133 |
128 |
88 |
59 |
70 |
1,107 |
|
2007 |
65 |
68 |
64 |
77 |
108 |
130 |
159 |
147 |
129 |
85 |
63 |
72 |
1,167 |
|
2008 |
66 |
62 |
68 |
68 |
93 |
132 |
137 |
153 |
134 |
99 |
83 |
63 |
1,160 |
|
2009 |
66 |
68 |
62 |
65 |
105 |
111 |
124 |
152 |
123 |
105 |
75 |
61 |
1,118 |
|
2010 |
67 |
68 |
60 |
66 |
101 |
122 |
148 |
156 |
117 |
104 |
78 |
63 |
1,149 |
|
2011 |
72 |
62 |
59 |
68 |
86 |
108 |
140 |
133 |
131 |
104 |
67 |
61 |
1,091 |
|
|
|
|
|
|
|
|
|
|
|
|
|
|
|
|
Average |
65 |
63 |
61 |
70 |
96 |
122 |
142 |
145 |
125 |
97 |
75 |
65 |
1,126 |
|
Detailed Water Use |
||
|---|---|---|
|
Average Annual Water Use |
1,125.9 |
mg |
|
Average Unbilled Water |
184.0 |
mg |
|
Average Annual Water Loss |
13% |
|
|
Average Day Use (July) |
4.8 |
mgd |
|
Average Day Use (January) |
2.1 |
mgd |
|
Average Peak Day to Average January Day Ratio |
2.3 |
|
Figure 45.04.130 – Clifton Water District Water Demand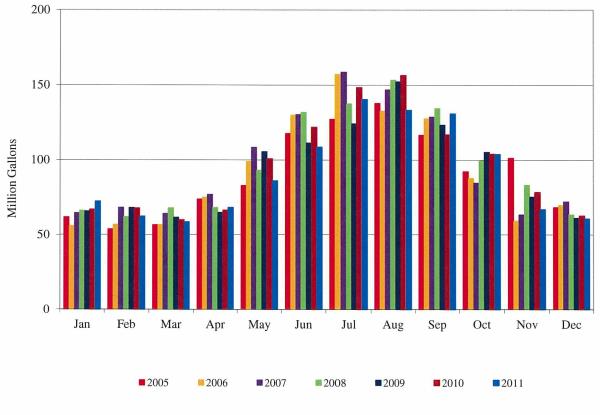
|
Year |
Customer Class |
Total Taps |
Metered Water (1,000 gallons) |
Average per Tap (1,000 Gallons) |
Per Capita |
Water Use % of Total |
|---|---|---|---|---|---|---|
|
2011 |
Residential |
10,787 |
1,003,737 |
93 |
76 |
92.0% |
|
Commercial |
255 |
87,281 |
342 |
|
8.0% |
|
|
Total |
11,042 |
1,091,018 |
|
|
|
|
|
|
|
|
|
|
|
|
|
2010 |
Residential |
10,590 |
1,060,601 |
100 |
79 |
92.7% |
|
Commercial |
247 |
88,479 |
358 |
|
7.3% |
|
|
Total |
10,837 |
1,149,080 |
|
|
|
|
|
|
|
|
|
|
|
|
|
2009 |
Residential |
10,619 |
1,036,822 |
98 |
80 |
92.7% |
|
Commercial |
241 |
81,648 |
339 |
|
7.3% |
|
|
Total |
10,860 |
1,118,470 |
|
|
|
|
|
|
|
|
|
|
|
|
|
2008 |
Residential |
10,499 |
1,068,544 |
102 |
83 |
92.1% |
|
Commercial |
238 |
91,656 |
385 |
|
7.9% |
|
|
Total |
10,737 |
1,160,200 |
|
|
|
|
|
|
|
|
|
|
|
|
|
2007 |
Residential |
10,127 |
1,081,429 |
107 |
88 |
92.7% |
|
Commercial |
227 |
85,161 |
375 |
|
7.3% |
|
|
Total |
10,354 |
1,166,590 |
|
|
|
|
|
|
|
|
|
|
|
|
|
2006 |
Residential |
10,155 |
1,045,642 |
103 |
86 |
94.5% |
|
Commercial |
223 |
60,858 |
273 |
|
5.5% |
|
|
Total |
10,378 |
1,106,500 |
|
|
|
|
|
|
|
|
|
|
|
|
|
2005 |
Residential |
9,925 |
1,033,670 |
104 |
87 |
94.9% |
|
Commercial |
244 |
55,550 |
228 |
|
5.1% |
|
|
Total |
10,169 |
1,089,220 |
|
|
|
|
|
|
||||||
|
Note: |
Residential includes: single-family residential, multifamily residential and trailer parks. Commercial includes: commercial, restaurants, schools, churches, firelines. |
|||||
|
Per Capita: |
Per capita calculations (2010) = unit connections times 2.73 (calculated people per unit) equals Clifton population. Calculated people per unit was 2.65 for the years of 2000 – 2009. Annual residential billing divided by 365 (days per year) equals gallons per day; gallons per day divided by Clifton population equals daily individual use. |
|||||
|
Customer |
Sector |
Percentage |
Water Use (million gallons) |
|---|---|---|---|
|
Haliburton Energy |
Commercial |
0.9% |
9.9 |
|
Coronado Plaza |
Multi-Use |
0.4% |
4.0 |
|
Kroger |
Supermarket |
0.3% |
3.1 |
|
Crystal Clear Car Wash |
Car Wash |
0.2% |
2.3 |
|
IPS New West Station |
Multi-Use |
0.2% |
2.2 |
|
|
|||
|
Total water used by the five largest C-I customers in 2011 |
21.5 |
||
|
|
|
|
|
|
Total water billed in 2011 |
1091.2 |
||
|
Percentage of 2011 billed water |
2.0% |
||
(Res. 24-12 (3.0), 6-20-12)
45.04.140 Clifton Water District – Current rate structure and tap fees.
Clifton’s inclining block water rate structure was developed for two specific purposes: (a) to effectively finance day to day operations; and (b) to encourage water conservation by charging an increased monetary rate for higher use which helps prolong capital investment and improves long range planning efforts. The plant investment fees support the upgrades of the water treatment plant and distribution system. Current rates were set on January 1, 2012, for in-district and out-of-district residential and commercial taps and are based on an increasing block rate structure. These rates are evaluated annually by staff to assure rates collected are sufficient to meet the day to day operational cost with the evaluation being reviewed by the District’s Board of Directors during each year’s budget cycle. Table 45.04.140(a) and Table 45.04.140(b) list Clifton’s current water rates and plant investment fees.
|
Residential: Meters 3/4" x 5/8" through 2" |
|||
|
In District |
Out of District |
||
|
Rate |
Gallons |
Rate |
Gallons |
|
$14.50 (includes 3,000 gal) |
0 – 3,000 |
$21.75 (includes 3,000 gal) |
0 – 3,000 |
|
$2.25 (per 1,000 gal) |
3,001 – 10,000 |
$3.38 (per 1,000 gal) |
3,001 – 10,000 |
|
$2.60 (per 1,000 gal) |
10,001 – 18,000 |
$3.90 (per 1,000 gal) |
10,001 – 18,000 |
|
$3.50 (per 1,000 gal) |
18,000+ |
$5.25 (per 1,000 gal) |
18,000+ |
|
|
|||
|
Nonresidential: Meters 3/4" x 5/8" through 10" |
|||
|
InDistrict |
Out of District |
||
|
Rate |
Gallons |
Rate |
Gallons |
|
$14.50 (includes 3,000 gal) |
0 – 3,000 |
$21.75 (includes 3,000 gal) |
0 – 3,000 |
|
$2.25 (per 1,000 gal) |
3,001 – 10,000 |
$3.38 (per 1,000 gal) |
3,001 – 10,000 |
|
$2.60 (per 1,000 gal) |
10,001+ |
$3.90 (per 1,000 gal) |
10,001+ |
|
|
|
|
|
|
*Demand Charge |
$2.00 (1st 1,000 gal) |
$3.00 (1st 1,000 gal) |
|
|
|
$4.00 (each add. 1,000 gal) |
$6.00 (each add. 1,000 gal) |
|
|
|
|||
|
*A demand charge is assessed when a combination meter is utilized and the usage flow exceeds the “low flow” meter causing the “high flow” meter to register additional usage. |
|||
|
|
|||
|
Metered Fire Hydrant and/or Fill Station Use: $2.30 per 1,000 gallons |
|||
|
Residential PIF* Fee Only |
Nonresidential PIF* Fee Only |
||||
|---|---|---|---|---|---|
|
Tap Size |
In District |
Out of District |
Tap Size |
In District |
Out of District |
|
3/4" |
$5,000 |
$7,500 |
3/4" |
$5,000 |
$7,500 |
|
1" |
$10,000 |
$15,000 |
1" |
$10,000 |
$15,000 |
|
1-1/2" |
$15,000 |
$22,500 |
1-1/2" |
$15,000 |
$22,500 |
|
2" |
$22,500 |
$33,750 |
2" |
$22,500 |
$33,750 |
|
3" |
$33,750 |
$50,625 |
3" |
$33,750 |
$50,625 |
|
|
|
|
4" |
$50,700 |
$76,050 |
|
|
|
|
6" |
$76,050 |
$114,075 |
|
|
|
|
8" |
$114,075 |
$171,113 |
|
|
|
|
10" |
$171,113 |
$256,670 |
|
|
|||||
|
*Plant investment fee – Clifton Water does not install water tap or provide materials for water tap. |
|||||
|
Note: Service of taps greater than three inches requires Board action to determine cost. |
|||||
(Res. 24-12 (3.0), 6-20-12)
45.04.150 Clifton Water District – Planned new water facilities.
The Clifton WTP was upgraded in 2005 and plans to enhance and increase the filtration capacity. These efforts are in process; however, due to the economic downturn and current population decline, plans for future upgrades have been put on hold until population growth increases and funding becomes available.
(Res. 24-12 (3.0), 6-20-12)
45.04.160 Ute Water Conservancy District – History and water supply.
The Ute Water Conservancy District was formed on April 4, 1956, by decree of the Mesa County Court. The District encompasses approximately 85 percent of Mesa County population starting at Cameo east of the Town of Palisade and terminating near the Colorado-Utah State line.
The primary source of supply for the District is the Jerry Creek Reservoirs (Nos. 1 and 2) with a combined capacity of 8,623 af. The Jerry Creek Reservoirs are filled from the Ute Pipeline Headgates No. 1 and No. 2 that have a senior water right for 20 cfs and a junior water right for 30 cfs. The Ute Pipeline Headgate No. 1 diverts water directly from Plateau Creek and Headgate No. 2 diverts water from the Lower Molina Power Plant. The District generally diverts water from Headgate No. 2 due to better water quality and yield. The District has an environmental constraint of 20 minimum stream flows in Plateau Creek when diverting from Headgate No. 1 that was imposed by the U.S. Army Corps of Engineers when the diversion was constructed in 1977 during that year’s drought.
The District has converted their irrigation water rights from the Carver Ranch purchase to municipal use. The water court decree has limited the diversions to 508.9 acre feet per year These water rights are diverted from Mesa and Coon Creeks by a third intake into the Ute Pipeline. The District owns seven other ranch properties that still remain in agriculture. These ranches have numerous direct flow rights, storage rights and Collbran Water Conservancy District shares.
The raw water from the Jerry Creek Reservoirs is delivered to the District’s water treatment plant via an 18.2-mile-long, 48-inch diameter Plateau Creek Pipeline. The Pipeline has a capacity to deliver 40.3 mgd, or 62.2 cfs, from the Jerry Creek Reservoirs. The Pipeline travels along the Plateau Creek valley floor for approximately 11.2 miles before entering the Lower Canyon Tunnel. After exiting the Lower Canyon Portal, the Pipeline alignment follows Plateau Creek for approximately 1.2 miles before entering the 3,300-foot-long Lower Mesa Tunnel. Upon exiting the Lower Mesa Tunnel the Pipeline travels along the southwesterly wall of De Beque Canyon above Interstate 70 for approximately 3.2 miles before entering the District’s water treatment plant.
In addition to the Plateau Creek Pipeline, diversions can also be made from the Colorado River through the Rapid Creek Pumping Pipeline that has a capacity of 12 cfs and a decreed water right of 15 cfs. Since the formation of the Ute Water Conservancy District, Ute has acquired numerous water rights in the Grand Mesa watershed. Table 45.04.160(a) is a list of storage rights and Table 45.04.160(b) is a list of direct flow rights owned by Ute Water Conservancy District.
In 1976 and again in 1985, the WTP was expanded to meet the growing demand for domestic water. The WTP has recently undergone a $35,000,000 expansion that included installation of four new filters. The present WTP capacity is 28.8 mgd with treated storage of approximately 16,000,000 gallons of water. Ute currently has approximately 1,450 miles of distribution pipelines and serves 29,484 residential and commercial taps with an estimated population of about 79,600.
|
Water Right Name |
Stream Name |
Acre Feet |
Use |
Comments |
|---|---|---|---|---|
|
Big Creek Reservoir Company |
Big Creek |
372.8 |
I |
32 shares |
|
Big Park Reservoir |
Leon & Park Creeks |
5,650.0 |
D |
Cond. |
|
Bull Basin Reservoir No. 1 |
Bull Creek |
125.6 |
I |
100% interest |
|
Bull Basin Reservoir No. 2 |
Bull Creek |
96.1 |
I |
Two adjudications |
|
Bull Creek Reservoir Company |
Bull Creek |
33.0 |
I |
33 shares |
|
Buzzard Creek Dam & Reservoir |
Buzzard Creek |
4,500.0 |
D |
Conditional |
|
Coon Creek Reservoir & Canal Co. |
Coon Creek |
396.5 |
I |
781 shares |
|
Coon Creek Reservoir No. 3 |
Coon Creek |
201.0 |
I |
3/8 interest |
|
Cottonwood Lakes Reservoir Co. |
Cottonwood Creek |
316.16 |
I |
52 shares |
|
Jerry Creek Reservoir No. 1 |
Plateau Creek |
1,102.0 |
D |
|
|
Jerry Creek Reservoir No. 2 |
Plateau & Jerry Creeks |
9,591.1 |
D |
7791 af cond. refill rt. |
|
Kirkendall Reservoir |
Leon Creek |
110.0 |
I |
1922.49 af cond. |
|
Mesa Creek Res. And Canal Co. |
Mesa Creek |
44.5 |
I |
89 shares |
|
Monument Reservoir No. 1 |
Leon Creek |
572.7 |
I |
4,682 af cond. |
|
Monument Reservoir No. 2 |
Leon Creek |
254.0 |
I |
|
|
Owens Park Reservoir |
Owens & Buzzard Crk |
6,992.9 |
D |
Cond. |
|
Stubbs McKinney & Clark Res. |
Bull Creek |
206.0 |
I |
aka Long Slough |
|
Twin Reservoir |
Bull Creek |
94.6 |
I |
Half interest |
|
Vega Reservoir |
Plateau Creek |
797.0 |
I |
|
|
Willow Creek Reservoir |
Buzzard Creek |
19,488.0 |
I |
Cond. |
|
Palmer Ditch |
Big Creek |
20.23 |
I |
2/9 int. in 2nd & 3rd adj. |
|
Golden Age Ditch |
Big Creek |
|
|
|
|
Boyle Creek Ditch |
Bull Creek |
0.60 |
I |
Conditional |
|
Bull Basin Highline Ditch |
Bull Creek |
5.90 |
I |
|
|
Stubbs McKinney & Clark Res. Feeder Ditch |
Bull Creek |
7.00 |
I |
|
|
Atwell East Ditch |
Coon Creek |
2.82 |
DI |
Domestic use conditional |
|
Charles A Atwell East Ditch |
Coon Creek |
0.75 |
I |
|
|
Brown Ditch |
Coon Creek |
2.08 |
I |
Additional 1.0 cfs for stock |
|
Coon Creek Pipeline |
Coon Creek |
6.0 |
D |
1.9 cfs is conditional |
|
Craig & Stewart Ditch |
Coon Creek |
4.68 |
I |
|
|
Heely Ditch No. 4 |
Coon Creek |
2.00 |
I |
|
|
Heely Ditch No. 5 |
Coon Creek |
0.66 |
I |
|
|
Pisel Ditch |
Coon Creek |
0.65 |
I |
|
|
Vance & Fortsch Ditch |
Coon Creek |
2.60 |
I |
|
|
Welch Ditch |
Coon Creek |
1.625 |
I |
|
|
Wildcat Ditch |
Coon Creek |
0.153 |
S |
|
|
Kiggins & Salisbury Ditch |
Leon Creek |
31.20 |
I |
Ownership of 300 shares |
|
Leon Ditch |
Leon Creek |
6.69 |
I |
40% ownership in Ditch |
|
Little Finn Ditch |
Leon Creek |
3.25 |
I |
aka Provo Ditch |
|
D – Domestic, I – Irrigation, S – Stock |
||||
|
Water Right Name |
Stream Name |
Cubic Feet per Second |
Use |
Comments |
|---|---|---|---|---|
|
Atwell Waste & Seep Ditch |
Mesa Creek |
3.06 |
I |
0.06 cfs conditional |
|
Carver Ranch Pipeline |
Mesa Creek |
11.00 |
D |
Mesa Intake |
|
Independent Ditch |
Mesa Creek |
8.17 |
I |
7.11 cfs conditional |
|
Mason & Eddy Ditch |
Mesa Creek |
8.842 |
D |
Ltd. 508 af |
|
Mesa Creek Ditch |
Mesa Creek |
6.50 |
D |
|
|
Mesa Creek Ditch |
Mesa Creek |
16.62 |
I |
|
|
Blackman, Dunlap & Clark D. |
Plateau Creek |
0.72 |
I |
|
|
Heely Ditch No. 1 |
Plateau Creek |
0.66 |
I |
|
|
Heely Ditch No. 2 |
Plateau Creek |
0.66 |
I |
|
|
Heely Ditch No. 3 |
Plateau Creek |
0.66 |
I |
|
|
Heely Ditch No. 6 |
Plateau Creek |
0.66 |
I |
|
|
Ute Pipeline |
Plateau Creek |
50.0 |
D |
|
|
Marin Crawford Ditch |
Rapid Creek |
8.0 |
D |
|
|
Cedar Ditch |
Salt Creek |
3.70 |
I |
|
|
Hill-Johnson Ditch |
Salt Creek |
1.57 |
I |
7/24 interest in ditch |
|
Bridges Switch PP & PL |
Colorado River |
30.0 |
D |
Conditional |
|
Grand Valley Canal |
Colorado River |
1.895 |
I |
GVIC, 182 shares |
|
Ute Pumping Station & PL |
Colorado River |
50.0 |
D |
Conditional |
|
D – Domestic, I – Irrigation |
||||
(Res. 24-12 (4.0), 6-20-12)
45.04.170 Ute Water Conservancy District – Retail water sales.
(a) Ute currently provides retail water to residents and businesses that are located its service area (see domestic water providers map, GJMC 45.04.350). This includes approximately 75 percent of the incorporated area of the City of Grand Junction. There are currently 33,881 active taps with an average water demand of just under 3,000,000,000 gallons per year for the years of 2005 through 2011. The unbilled water for the study period was calculated to be six percent of treated water and is a product of flushing in the distribution lines and unauthorized use of firelines.
(b) Approximately 95 percent of homes in the Ute Water Conservancy District enjoy the use of direct flow irrigation water. Residents within the Ute Water District receive irrigation water from the Government Highline Canal, operated by the Grand Valley Water Users Association. Also providing irrigation water in the District is the Redlands Canal, owned and operated by the Redlands Water and Power Company, the Grand Valley Canal, owned and operated by the Grand Valley Irrigation Company, and the Orchard Mesa Canal, owned and operated by the Orchard Mesa Irrigation District.
(c) Monthly Water Demand 2005 Through 2011. The average daily demand for January for the study period was 6,100,000 gallons per day (mgd) and the average daily demand in July was 12.1 mgd. The ratio of the January daily demand to the July daily demand was 2.0 or water demand for July is 2.0 times that of an average day in January. This difference is estimated to be the result of home cooler demand during the hot summer months and lawn irrigation. Unbilled water averaged six percent over the past seven years and is a result of unauthorized fireline use. Table 45.04.180(a) shows Ute’s monthly and annual demand for the study period as well as detailed water use for those years and Figure 45.04.180 illustrates the monthly water demand.
(Res. 24-12 (4.0), 6-20-12)
45.04.180 Ute Water Conservancy District – Sector water use.
Table 45.04.180(a) shows billed water use patterns for residential and commercial-industrial sectors for 2005 through 2011 as well as percentage of water use and percentage of taps by each sector. For the years 2005 through 2011, residential water use averaged 75 percent of water sales and 96 percent of active water taps. The commercial-industrial sector averaged 25 percent of water sales but only 3.5 percent of active water taps. As shown in Table 45.04.180(b) the distribution of water taps for the commercial-industrial (C-I) sector has remained constant over the years.
When looking at the C-I sector, it was noted that the five largest C-I customers were billed for 9.1 percent of the total water use in 2011. The C-I customers include an egg production facility (agricultural use), two manufacturing facilities, and two large retail stores. Table 45.04.180(c) shows the distribution of water use for the five largest C-I customers for 2011.
|
Year |
Jan |
Feb |
Mar |
Apr |
May |
Jun |
Jul |
Aug |
Sep |
Oct |
Nov |
Dec |
Total |
|---|---|---|---|---|---|---|---|---|---|---|---|---|---|
|
|
|
|
|
|
|
|
|
|
|
|
|
|
|
|
2005 |
182 |
158 |
193 |
198 |
211 |
325 |
361 |
316 |
326 |
242 |
199 |
202 |
2,912 |
|
2006 |
207 |
176 |
183 |
214 |
279 |
373 |
397 |
343 |
332 |
234 |
207 |
196 |
3,141 |
|
2007 |
203 |
186 |
185 |
251 |
256 |
342 |
387 |
366 |
357 |
230 |
217 |
189 |
3,168 |
|
2008 |
186 |
181 |
184 |
194 |
254 |
296 |
355 |
386 |
323 |
257 |
203 |
179 |
3,000 |
|
2009 |
199 |
163 |
182 |
202 |
251 |
275 |
331 |
354 |
313 |
247 |
186 |
190 |
2,894 |
|
2010 |
190 |
143 |
162 |
207 |
231 |
286 |
357 |
320 |
302 |
250 |
190 |
176 |
2,815 |
|
2011 |
184 |
170 |
161 |
204 |
212 |
279 |
342 |
296 |
337 |
244 |
187 |
173 |
2,789 |
|
|
|
|
|
|
|
|
|
|
|
|
|
|
|
|
Average |
193 |
168 |
179 |
210 |
242 |
311 |
361 |
340 |
327 |
243 |
198 |
186 |
2,960 |
|
Detailed Water Use |
||
|---|---|---|
|
Average Annual Water Use |
2,959.9 |
mg |
|
Average Unbilled Water |
183.5 |
mg |
|
Average Annual Water Loss |
6% |
|
|
Average Day Use (July) |
12.1 |
mgd |
|
Average Day Use (January) |
6.2 |
mgd |
|
Average July Day to Average January Day Ratio |
2.0 |
|
Figure 45.04.180 – Ute Water Conservancy District Water Use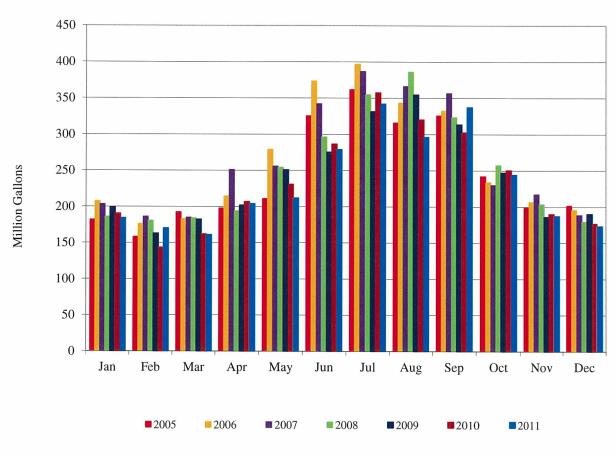
|
Year |
Customer Class |
Total Taps |
Metered Water (1,000 gallons) |
Average per Tap (1,000 Gallons) |
Per Capita |
Water Use % of Total |
|---|---|---|---|---|---|---|
|
2011 |
Residential |
33,057 |
2,107,328 |
64 |
75 |
75.4% |
|
Commercial |
1,249 |
687,649 |
551 |
|
24.6% |
|
|
Total |
34,306 |
2,794,977 |
|
|
|
|
|
|
|
|
|
|
|
|
|
2010 |
Residential |
32,643 |
2,139,267 |
66 |
77 |
76.0% |
|
Commercial |
1,238 |
675,771 |
546 |
|
24.0% |
|
|
Total |
33,881 |
2,815,038 |
|
|
|
|
|
|
|
|
|
|
|
|
|
2009 |
Residential |
31,937 |
2,186,567 |
68 |
72 |
75.5% |
|
Commercial |
1,223 |
707,831 |
579 |
|
24.5% |
|
|
Total |
33,160 |
2,894,398 |
|
|
|
|
|
|
|
|
|
|
|
|
|
2008 |
Residential |
32,253 |
2,232,344 |
69 |
72 |
74.4% |
|
Commercial |
1,156 |
767,198 |
664 |
|
25.6% |
|
|
Total |
33,409 |
2,999,542 |
|
|
|
|
|
|
|
|
|
|
|
|
|
2007 |
Residential |
31,387 |
2,416,643 |
77 |
80 |
76.2% |
|
Commercial |
1,139 |
752,784 |
661 |
|
23.8% |
|
|
Total |
32,526 |
3,169,427 |
|
|
|
|
|
|
|
|
|
|
|
|
|
2006 |
Residential |
30,452 |
2,307,791 |
76 |
79 |
73.5% |
|
Commercial |
1,098 |
833,636 |
759 |
|
26.5% |
|
|
Total |
31,550 |
3,141,427 |
|
|
|
|
|
|
|
|
|
|
|
|
|
2005 |
Residential |
29,495 |
2,165,112 |
73 |
77 |
74.3% |
|
Commercial |
1,037 |
747,361 |
721 |
|
25.7% |
|
|
Total |
30,532 |
2,912,473 |
|
|
|
|
|
|
||||||
|
Note: |
Residential includes: single-family and multifamily units as well as mobile home parks. Commercial includes: commercial, restaurants, schools, churches, firelines. |
|||||
|
Per Capita: |
Per capita calculations (2010) = unit connections times 2.34 (calculated people per unit) equals Ute population; annual residential billing divided by 365 (days per year) equals gallons per day; gallons per day divided by Ute population equals daily individual use. |
|||||
|
Customer |
Sector |
Percentage |
Water Use (million gallons) |
|---|---|---|---|
|
LLG |
Manufacturing |
0.9% |
26.0 |
|
Colorado Egg Producer |
Agricultural |
0.5% |
14.0 |
|
Coors Tek |
Manufacturing |
0.4% |
12.0 |
|
Wal-Mart Stores |
Retail |
0.3% |
9.0 |
|
Safeway Stores |
Retail |
0.2% |
7.0 |
|
|
|||
|
Total water used by the five largest C-I customers in 2011 |
68 |
||
|
|
|||
|
Total water billed in 2011 |
2,815 |
||
|
Percentage of 2011 billed water |
2.4% |
||
(Res. 24-12 (4.0), 6-20-12)
45.04.190 Ute Water Conservancy District – Current rate structure and tap fees.
Ute’s water rate structure was developed to finance the District’s operation and maintenance of the water system and to support the operation and upgrades of the water treatment plant. Rates were set with an aggressive increasing block rate structure. An additional “conservation rate” was instituted in 2008 that was set at $10.00 per 1,000 gallons for water use of over 30,000 gallons per month. Table 45.05.190(a) and Table 45.05.190(b) list Ute Water’s current water rates and tap fees.
|
Meters 3/4" x 5/8" through 1" Residential |
|
|---|---|
|
Rate |
Gallons |
|
$15.00 (includes 3,000 gal) |
0 – 3,000 |
|
$3.50 (per 1,000 gal) |
3,001 – 9,000 |
|
$4.00 (per 1,000 gal) |
9,001 – 15,000 |
|
$4.75 (per 1,000 gal) |
15,001 – 21,000 |
|
$5.50 (per 1,000 gal) |
21,001 – 30,000 |
|
$10.00 (per 1,000 gal) |
over 30,000 |
|
Nonresidential |
Agriculture |
||
|---|---|---|---|
|
Rate |
Gallons |
Rate |
Gallons |
|
$15.00 (includes 3,000 gal) |
0 – 3,000 |
$15.00 (includes 3,000 gal) |
0 – 3,000 |
|
$3.50 (per 1,000 gal) |
3,001 – 9,000 |
$3.50 (per 1,000 gal) |
3,001 – 9,000 |
|
$4.00 (per 1,000 gal) |
9,001 – 15,000 |
$4.00 (per 1,000 gal) |
9,001 – 15,000 |
|
$4.75 (per 1,000 gal) |
over 15,000 |
|
|
|
Nonresidential |
Agriculture |
||
|---|---|---|---|
|
Rate |
Gallons |
Rate |
Gallons |
|
$75.00 (includes 15,000 gal) |
15,000 |
$75.00 (includes 15,000 gal) |
15,000 |
|
$3.50 (per 1,000 gal) |
next 30,000 |
$3.50 (per 1,000 gal) |
next 30,000 |
|
$4.00 (per 1,000 gal) |
next 30,000 |
$4.00 (per 1,000 gal) |
next 45,000 |
|
$4.75 (per 1,000 gal) |
over 75,000 |
|
|
|
Nonresidential |
Agriculture |
||
|---|---|---|---|
|
Rate |
Gallons |
Rate |
Gallons |
|
$120.00 (includes 24,000 gal) |
24,000 |
$120.00 (includes 24,000 gal) |
24,000 |
|
$3.50 (per 1,000 gal) |
next 48,000 |
$3.50 (per 1,000 gal) |
next 48,000 |
|
$4.00 (per 1,000 gal) |
next 48,000 |
$4.00 (per 1,000 gal) |
next 72,000 |
|
$4.75 (per 1,000 gal) |
120,001+ |
|
|
|
Nonresidential |
Agriculture |
||
|---|---|---|---|
|
Rate |
Gallons |
Rate |
Gallons |
|
$262.50 (includes 52,500 gal) |
52,500 |
$262.50 (includes 52,500 gal) |
52,500 |
|
$3.50 (per 1,000 gal) |
next 105,000 |
$3.50 (per 1,000 gal) |
next 105,000 |
|
$4.00 (per 1,000 gal) |
next 105,000 |
$4.00 (per 1,000 gal) |
next 105,000 |
|
$4.75 (per 1,000 gal) |
262,501+ |
|
|
|
Nonresidential |
Agriculture |
||
|---|---|---|---|
|
Rate |
Gallons |
Rate |
Gallons |
|
$450.00 (includes 90,000 gal) |
90,000 |
$450.00 (includes 90,000 gal) |
90,000 |
|
$3.50 (per 1,000 gal) |
next 180,000 |
$3.50 (per 1,000 gal) |
next 180,000 |
|
$4.00 (per 1,000 gal) |
next 180,000 |
$4.00 (per 1,000 gal) |
next 180,000 |
|
$4.75 (per 1,000 gal) |
450,001+ |
|
|
|
Nonresidential |
Agriculture |
||
|---|---|---|---|
|
Rate |
Gallons |
Rate |
Gallons |
|
$1,050.00 (includes 210,000 gal) |
210,000 |
$1,050.00 (includes 210,000 gal) |
210,000 |
|
$3.50 (per 1,000 gal) |
next 420,000 |
$3.50 (per 1,000 gal) |
next 420,000 |
|
$4.00 (per 1,000 gal) |
next 420,000 |
$4.00 (per 1,000 gal) |
next 420,000 |
|
$4.75 (per 1,000 gal) |
over 1,050,001+ |
|
|
|
Residential |
Nonresidential and Agriculture |
||
|---|---|---|---|
|
3/4" x 5/8" |
$5,800.00 |
3/4" x 5/8" |
$5,800.00 |
|
3/4" x 3/4" |
$7,250.00 |
3/4" x 3/4" |
$7,250.00 |
|
1" |
$8,700.00 |
1" |
$8,700.00 |
|
|
|
1-1/2" |
$13,000.00 |
|
|
|
2" |
$19,200.00 |
|
|
|
3" |
$34,500.00 |
|
|
|
4" |
$60,500.00 |
|
|
|
6" |
$151,500.00 |
(Res. 24-12 (4.0), 6-20-12)
45.04.200 Ute Water Conservancy District – Planned new water facilities.
Due to the recent expansion of the District’s WTP, no facilities are planned for the foreseeable future. However, the District is currently undergoing a raw water supply study to determine its needs and potential sources for raw water through 2045.
(Res. 24-12 (4.0), 6-20-12)
45.04.210 Future water demands in the Grand Valley.
(a) Projected Future Water Demand. Ute Water Conservancy District contracted HDR/HLB Decision Economics, Inc. to provide an independent assessment of population forecasts and a risk adjusted population forecast of the District’s service area. The study area encompassed most of Mesa County; however, it excluded some portions of the City of Grand Junction, the Town of Palisade and part of the area known as Clifton. The assessment reviewed population forecasts by the U.S. Census Bureau, the Colorado State Demographer, Pearse and Associates population forecast conducted for Mesa County in 1995, and BBC Research and Consulting. Table 45.04.210(a) is a summary of the forecasts:
|
Name |
Years Forecasted |
Annual Growth Rate (CAGR*) |
Area Forecasted |
|---|---|---|---|
|
U.S. Census Bureau |
2000 – 2035 |
1.00% |
Colorado |
|
Colorado State Demographer |
2000 – 2035 |
2.00% |
Mesa County |
|
BBC Research & Consulting |
2005 – 2035 |
1.98% |
Mesa County |
|
Mesa County Administration |
2000 – 2020 |
2.93% |
Mesa County |
|
HDR |
2010 – 2025 |
2.95% |
Ute District |
*Compound annual growth rate
(b) Future Water Demand – The City of Grand Junction. Because the City of Grand Junction water service area is surrounded by other water providers, growth has occurred at an annual rate of 0.70 percent between 2004 and 2008 with new taps of only 335 taps for the time period. Table 45.04.210(b) is a projection of water demand by the year 2025. Water demand was projected to increase at a 0.70 percent rate between the years 2010 and 2025. Projected water demand was calculated using projected population multiplied by 110 gpcd, then calculated at an annual value and converted to million gallons. The City of Grand Junction’s unbilled water is anticipated to remain constant at a rate of 10.0 percent.
(c) Clifton Water District. The projected future water demand for the Clifton Water District was based on the number of water taps and the water demand for the years 2004-2010. The number of taps increased for that time period by approximately 11 percent or an annual average of 2.25 percent. The per capita water demand for the residential sector averaged 85 gallons per day (gpcd) for that same time. In cases where untreated irrigation water is unavailable, treated water is utilized for outdoor irrigation and is included in the per capita calculation (reference Table 45.04.130(b)). The growth rate and water demand between 2008 and 2010 was flat but optimistic projections are for the growth rate to return to the projected two percent per year by the State Demographer. Table 45.02.210(c) is a calculation of the projected water demand for the Clifton Water District through 2025. Projected water demand was calculated using projected population multiplied by a per capita of 85 (gpcd), then calculated at an annual value and converted to million gallons. The commercial-industrial sector was estimated to remain at the historic five-year high and the unbilled water was anticipated to remain constant at a rate of 13 percent. Note: the unbilled water for 2010 was unusually high at 14.7 percent.
(d) Ute Water Conservancy Water District. Projected water demand for the Ute Water Conservancy District was based on the population study conducted by HDR/HLB Decision Economics, Inc. Values for estimated populations were based on an anticipated growth rate of 2.95 percent per year. Table 45.04.210(d) is a calculation of the projected water demand for Ute Water Conservancy District through 2025. Projected residential water demand was calculated at the current per capita rate of 77 (gpcd) multiplied by the forecasted population, then calculated at an annual value and converted to million gallons. In cases where untreated irrigation water is unavailable, treated water is utilized for outdoor irrigation and is included in the per capita calculation (reference Table 45.04.180(b)). The commercial-industrial sector was estimated to remain at the historic five-year high and unbilled water was estimated to be six percent of total treated water.
|
|
Year |
2010 |
2015 |
2020 |
2025 |
|---|---|---|---|---|---|
|
|
Historic: |
|
|
|
|
|
1 |
Population |
27,161 |
|
|
|
|
2 |
Residential Demand |
1,014 |
|
|
|
|
|
Commercial-Industrial Demand |
630 |
|
|
|
|
3 |
Unbilled Water |
164 |
|
|
|
|
4 |
Total Water Demand |
1,808 |
|
|
|
|
|
|
|
|
|
|
|
|
Projected: |
|
|
|
|
|
5 |
Population |
|
28,125 |
29,123 |
30,157 |
|
|
Projected Sector Demand: |
|
|
|
|
|
6 |
Residential Demand |
|
1,140 |
1,180 |
1,222 |
|
7 |
Commercial-Industrial Demand |
|
651 |
651 |
651 |
|
8 |
Projected Unbilled Water |
|
179 |
183 |
187 |
|
9 |
Projected Total Water Demand |
|
1,970 |
2,014 |
2,060 |
|
1 |
2010 census |
|
2 |
Billed water by sector |
|
3 |
Unbilled water was 10.0 percent of total treated water for 2010 |
|
4 |
Billed water plus unbilled water |
|
5 |
Growth to average 0.7 percent per year |
|
6 |
Annual increase calculations: Population increase times 110 gpcd times 365 divided by 1,000,000 |
|
7 |
C-I demand historical range of 600 mg – 651.8 mg; estimated to remain at historical high values |
|
8 |
Projected unbilled water is 10.0 percent of total demand |
|
9 |
Sum of sectors and unbilled water |
|
|
Year |
2010 |
2015 |
2020 |
2025 |
|---|---|---|---|---|---|
|
|
Historic: |
|
|
|
|
|
1 |
Population |
33,000 |
|
|
|
|
2 |
Residential Demand |
1,061 |
|
|
|
|
|
Commercial-Industrial Demand |
88 |
|
|
|
|
3 |
Unbilled Water |
198 |
|
|
|
|
4 |
Total Water Demand |
1,347 |
|
|
|
|
|
|
|
|
|
|
|
|
Projected: |
|
|
|
|
|
5 |
Population |
|
36,363 |
40,384 |
44,282 |
|
|
Projected Sector Demand: |
|
|
|
|
|
6 |
Residential Demand |
|
1,159 |
1,276 |
1,390 |
|
7 |
Commercial-Industrial Demand |
|
88 |
92 |
92 |
|
8 |
Projected Unbilled Water |
|
186 |
204 |
221 |
|
9 |
Projected Total Water Demand |
|
1,434 |
1,572 |
1,703 |
|
1 |
2010 census |
|
2 |
Billed water by sector |
|
3 |
Unbilled water was 14.7 percent of total treated water for 2010 |
|
4 |
Billed water plus unbilled water |
|
5 |
Growth estimated to average two percent per year |
|
6 |
Annual increase calculations: Population increase times 80 gpcd times 365 divided by 1,000,000 |
|
7 |
C-I demand historical range of 88.5 – 91.7 mg; estimated to remain at historical high after 2015 |
|
8 |
Projected unbilled water is 13 percent of total demand |
|
9 |
Sum of sectors and unbilled water |
|
|
Year |
2010 |
2015 |
2020 |
2025 |
|---|---|---|---|---|---|
|
|
Historic: |
|
|
|
|
|
1 |
Population |
79,600 |
|
|
|
|
2 |
Residential Demand |
2,139 |
|
|
|
|
|
Commercial-Industrial Demand |
676 |
|
|
|
|
3 |
Unbilled Water |
141 |
|
|
|
|
4 |
Total Water Demand |
2,956 |
|
|
|
|
|
|
|
|
|
|
|
|
Projected: |
|
|
|
|
|
5 |
Population |
|
92,278 |
106,976 |
124,014 |
|
|
Projected Sector Demand: |
|
|
|
|
|
6 |
Residential Demand |
|
2,496 |
2,909 |
3,387 |
|
7 |
Commercial-Industrial Demand |
|
834 |
834 |
834 |
|
8 |
Projected Unbilled Water |
|
200 |
225 |
253 |
|
9 |
Projected Total Water Demand |
|
3,529 |
3,967 |
4,474 |
|
1 |
2010 census |
|
2 |
Billed water by sector |
|
3 |
Unbilled water was five percent of total treated water for 2010 |
|
4 |
Sector billed water plus unbilled water |
|
5 |
HDR population estimated as a 2.95 percent annual growth rate |
|
6 |
Annual increase calculations: Population increase times 76.7 gpcd times 365 divided by 1,000,000 |
|
7 |
C-I demand estimated to remain at historical high of 833.6 mg |
|
8 |
Projected unbilled water is six percent of total demand |
|
9 |
Sum of sectors and unbilled water |
(e) Table 45.04.210(e) is a summary of anticipated water demand in the Grand Valley from 2010 through 2025. It should be noted that the values used for the projected water demand are planning values only and are based on current research by both HDR and the State Demographer. The entities, however, are experiencing a reduction in water demand and active taps due to the temporary downturn in the local economy and the general nationwide recession.
|
Year |
2010 |
2015 |
2020 |
2025 |
|---|---|---|---|---|
|
|
|
|
|
|
|
Projected: |
|
|
|
|
|
City of Grand Junction |
1,808 |
1,970 |
2,014 |
2,060 |
|
Clifton Water District |
1,347 |
1,434 |
1,572 |
1,703 |
|
Ute Water Conservancy District |
2,956 |
3,529 |
3,967 |
4,474 |
|
Projected Total Water Demand |
6,111 |
6,933 |
7,553 |
8,237 |
(Res. 24-12 (5.0), 6-20-12)
Article III. The Grand Valley Regional Water Conservation Plan
45.04.220 Current and ongoing water conservation.
In 1996, the City of Grand Junction (the City), the Clifton Water District (Clifton), and the Ute Water Conservancy District (Ute), collectively referred to as the entities, each developed a water conservation plan. The City, Clifton, and Ute have taken proactive positions on water issues and view water conservation as not only necessary for the future but also responsible management of their water resource. The City Council for the City and the Boards of Directors for Clifton and Ute support water conservation as part of their general mission and are taking the lead in promoting water conservation in the Grand Valley and are now participating in a Regional Water Conservation Plan for the Grand Valley. The current water conservation activities include the Drought Response Information Project (DRIP), the Annual Children’s Water Festival, low water use landscape projects, leak detection programs, and increasing block rate structures.
(Res. 24-12 (6.0), 6-20-12)
45.04.230 Drought Response Plan.
As a result of the 2002-2003 drought, the City, Clifton, and Ute along with the Town of Palisade collectively embarked upon the development of a regional Drought Response Plan. The Drought Response Plan (DRP) was designed to provide Governing Boards and City Council with a set of options to consider when dealing with a prolonged drought event. Article VI contains a copy of the Drought Response Plan. Implementation of the Drought Response Plan was and is accomplished through an ongoing annual effort, budgeted and paid for by the four domestic water providers. One of the key components of the DRP was to initiate a Drought Response Information Project (DRIP) to provide public education through all sources of media on why and how to reduce per capita consumption across all water use classes in the respective service areas. The DRIP group consists of staff members of the four domestic providers (the City, Clifton, Ute, and the Town of Palisade) as well as representatives of the Colorado State University Extension Service. This group has run an active media campaign on water conservation for the past eight years. The media campaign includes water conservation video presentations on the local public access channel, interviews with various DRIP members on local radio and television stations, weekly water conservation columns in the local newspapers, and face to face presentations to local service groups, homeowner’s associations, and community gatherings to further spread the Grand Valley water conservation message. During the summer months, the group participates in the local farmer’s markets sponsored by the Grand Junction Downtown Association and the Town of Palisade. DRIP members provide information on household and lawn water conservation. A year-round water conservation reference base is provided on the DRIP website (www.thedripwebsite.com).
Additionally, as a part of the DRIP, the domestic water managers meet monthly to discuss storage levels, potential water shortages and local and regional water issues. Representatives from the City, Clifton and Ute participate in the Mesa County Wise Water Use Council. This Council is made up of parties in Mesa County (staff members from local governments, domestic water providers, irrigation water providers, soil conservation entities, mosquito control entities, CSU Extension Service, local agricultural groups, and federal agencies) that have interests in local water use issues. The City of Grand Junction, Ute Water District, and Clifton Water District contribute $5,000 per entity per year to fund DRIP efforts.
(Res. 24-12 (6.0), 6-20-12)
45.04.240 The Children’s Water Festival.
Ute, Clifton, and the City sponsor the Children’s Water Festival held each year at Colorado Mesa University in Grand Junction. Each year for the past 18 years over 1,800 fifth-grade students attend the two-day program to learn the different roles that water plays in their lives, in their community, and the world. Over 300 water experts participate in the festival by providing workshops and exhibits. Indoor and outdoor classes range in topic from water rights, water conservation, water pollution, water treatment and distribution, water and wildlife including the endangered species in the Colorado River, and everyone’s dependency on clean water supplies. Exhibits show the water cycle, modern irrigation systems, water measurement, the benefits of water conservation, and many other displays. The Children’s Water Festival is underwritten and sponsored by many businesses and agencies in the Grand Valley.
(Res. 24-12 (6.0), 6-20-12)
45.04.250 Low water use landscape programs.
Within the City of Grand Junction are three major golf courses, parks and ball fields, schools, trails, open space, and street medians. The golf courses are irrigated with nonpotable water provided by the Grand Valley Irrigation Company, The Redlands Water and Power Company, and Ridges Irrigation District. The parks and baseball fields, schools, trails, open space, and street medians are all irrigated with treated water from the City of Grand Junction. Seven years ago the City invested in the Maxi-Com Irrigation Program which is a centralized program that runs and monitors all of the irrigation systems in the City including the golf courses. The program is tied to a satellite that downloads information regarding evapotranspiration (ET). The centralized computer program then sets the clocks for each irrigation system according to estimated ET. Each of the 125 clocks that run each irrigation system also has rain gauges attached to it which trigger a stop action when a rain event occurs. Through the use of the Maxi-Com Irrigation Program and other improvements in the irrigation system, the irrigation water use in parks, schools, trails, open space, and street medians was reduced by 27.07 mg from 2008 through 2010. In 2008 the City parks, etc. used 176.43 mg of water, in 2009 the parks, etc. used 166.05 mg of water, and in 2010, the parks, etc. used 149.36 mg of water. This was accomplished through higher efficiency and accuracy of irrigation output as well as the monitoring of each system for leaks and breaks. Also, in 2008, the Lincoln Park football field was converted from grass to sports turf.
(Res. 24-12 (6.0), 6-20-12)
45.04.260 Leak detection programs.
The City, Clifton, and Ute leak detection efforts all utilize various methods and techniques to pinpoint water loss either on the customer’s meter or within their respective distribution systems. These methods and techniques include: listening devices, visual observations, usage evaluations and customer notifications.
Due to the Grand Valley’s soil composition, service and main leaks almost always surface, helping in the rapid response of fixing leaks before major structural or road damage occurs. For those leaks not surfacing, the entities use several different manufacturers’ equipment for investigative purposes. This equipment includes General Gen-Ear Water Leak Locator, Heathscope, and Subsurface Leak Detection Inc. Currently none of the entities possess system-wide leak evaluation equipment; however, in the past, various third party vendors have performed these evaluations within limited areas of the entities’ service areas. Past attempts at using third party leak detections vendors were inconclusive. Mainline leak and break history data were tracked for capital expenditure evaluations for future pipe mainline replacements and upgrades. All three entities have pipe replacement capital plans that will further reduce unbilled water losses, as older pipes are replaced.
Meter reading and billing software used by the entities includes Neptune, Caselle, Springbrook and Northstar. The various software programs allow for high/low meter reading comparisons between other existing historical data sets. Additionally, month-to-month comparisons are performed by billing staff and, for those accounts that show atypical usage increases, field technicians are notified via work orders to perform follow-up site visits to investigate potential customer leaks. Monthly meter collection data is also used in system-wide trend evaluations for help in determining unaccounted-for water. WTP personnel are continuously monitoring plant output versus tank levels and system pressures which provide potential major line break information to distribution personnel for immediate investigation and follow-up.
(Res. 24-12 (6.0), 6-20-12)
45.04.270 Increasing block rate structures.
All three entities have an increasing block rate billing structure as explained in previous chapters.
(Res. 24-12 (6.0), 6-20-12)
45.04.280 Grand Valley Regional Water Conservation Plan – Goals and objectives.
The City, Clifton, and Ute have taken proactive positions on water issues and view water conservation as not only necessary for the future but also responsible management of their water resource. As stated earlier, the City Council for the City and the Board of Directors for Clifton and Ute support water conservation as part of their general mission and have taken the lead in promoting water conservation in the Grand Valley. The entities have come together to develop a Regional Water Conservation Plan for the Grand Valley and have identified the following goals and objectives to be achieved through the implementation of measures and programs outlined in this WCP:
(a) Goal 1: Continue to educate the community, landscape contractors, and customers regarding codes and ordinances that promote xeric landscapes and water conservation.
(b) Goal 2: Continue to create public awareness of wise water use and conservation.
(c) Goal 3: Reduce residential sector water demand in the Grand Valley by 10 percent over the next seven years.
(d) Goal 4: Promote water saving awareness in the commercial/industrial sectors.
(Res. 24-12 (7.0), 6-20-12)
45.04.290 Grand Valley Regional Water Conservation Plan – Plan elements.
The Colorado Water Conservation Board (CWCB) has listed elements that must be considered in a water conservation plan. Below is a list of minimum required water conservation plan elements that must be fully considered:
(a) Water-efficient fixtures and appliances.
(b) Low water use landscapes.
(c) Water-efficient industrial and commercial water-using processes.
(d) Water reuse systems.
(e) Distribution system leak identification and repair.
(f) Dissemination of information regarding water use efficiency measures.
(g) Water rate structures and billing designed to encourage water use efficiency.
(h) Regulatory measures designed to encourage water conservation.
Following are measures and programs designed to address the plan elements and achieve the goals and objectives of this water conservation plan.
(Res. 24-12 (7.0), 6-20-12)
45.04.300 Regional water conservation measures and programs.
(a) Water-Efficient Fixtures and Appliances. A regional toilet retrofit program for residential customers in the Grand Valley will be initiated. The toilet retrofit program will be administrated through DRIP, which is the entities’ water conservation information program. The toilet retrofit will target high residential water users based on their billing records. The goal is to offer rebates of $75.00 for the replacement of 50 high water use toilets, 3.5 or greater gallons per flush (gpf), with 1.28-gpf toilets in residential homes each year. The estimated annual cost is $3,750 for fixtures and $1,500 for administrative costs. We are estimating 2.6 people per residence and approximately four flushes per person per day. According to Vickers, the replacement of a 3.5-gpf toilet with a 1.6-gpf toilet will save 9,337 gallons per year per household. It is estimated that a 20 percent water saving is realized by the replacement of a 1.6-gpf toilet with a 1.28-gpf toilet. The estimated annual water savings is 11,200 gallons per household or 560,000 gallons per year for 50 toilet retrofits. Each entity will track the water use of the accounts within their service area where the retrofit toilets were installed. The tracking results will be reviewed annually by the DRIP Committee for documented water savings and program effectiveness as well as public response. It is estimated that most of the demand for fixture upgrades will be within the City of Grand Junction water service area and the Clifton water service area since those communities have the oldest homes.
(b) Low Water Use Landscapes. Annually, landscape audits will be offered to the 10 highest water use residential customers that utilize domestic water for outdoor irrigation. Over the next seven years this will result in a minimum of 70 landscape audits in the identified regional plan area. The estimated annual cost will be $1,000 and the audits will be conducted by a trained staff and consultants. The estimated water saving for landscape audits is considered to be a 10 percent to 15 percent reduction in water use (Vickers). Since a greater share of the irrigation in the City is from treated water, the City’s water use values were used as a base for calculating potential water savings from landscape audits. In 2010, there were 7,897 active residential water taps in the City service area with an average base demand of 10,000 gallons per month per home. Peak season, July and August, demand per home has been calculated to be 28,800 gallons per month. The difference between winter and summer water use was 18,800 gallons that was attributable to lawn irrigation and evaporative cooling in homes. A conservative estimated savings of 10 percent is 1,880 gallons per home per month and may be as high as 2,500 gallons per month per home depending upon the seasonal rainfall. The annual water savings from audits for the months of May through September may be as high as 25,000 gallons for each home with a total of 250,000 gallons for 10 homes per year. It is estimated that most of the irrigation audits demand will be from homes in the City of Grand Junction water service area.
(c) Water-Efficient Commercial and Industrial Water-Using Processes. Water audits will be offered to the top 10 C-I water users over the next seven years. Since it is unknown how much water savings will be realized by the commercial water use audits, it was estimated that the results of the audits may be a conservative water savings of three percent to five percent per C-I audit. The estimated cost of a water use audit for a C-I customer will be $750.00 per audit with a total of $7,500 for the program. The C-I audits will be performed by internal staff utilizing the best management practices as identified by the Colorado WaterWise Guidebook of Best Practices for Municipal Water Conservation in Colorado. Below is Table 45.04.300(a), a listing of the top 10 C-I water users in the region showing the 2011 water use and the potential three and five percent water savings from the audits. At the three percent water savings from audits, the Grand Valley could see a savings of 16.4 mg. At the five percent water savings from audits, the Grand Valley could see a savings of 27.4 mg. It is estimated that most of the demand for the C-I audits will be in the City and in Ute’s service area. The program for the C-I water audits will be reviewed annually by the DRIP Committee for documented water savings and program effectiveness.
|
Customer |
Sector |
Water Use (mg) |
3% Savings |
5% Savings |
|---|---|---|---|---|
|
City of GJ parks |
Government |
150.5 |
4.5 |
7.5 |
|
Colorado Mesa University |
Education |
43.8 |
1.3 |
2.2 |
|
St. Mary’s Hospital |
Hospital |
39.0 |
1.2 |
2.0 |
|
School District 51 |
Education |
30.0 |
0.9 |
1.5 |
|
Mesa County |
Government |
29.1 |
0.9 |
1.5 |
|
LLG |
Manufacturing |
26.0 |
0.8 |
1.3 |
|
Colorado Egg Producer |
Agricultural |
12.0 |
0.4 |
0.6 |
|
Haliburton |
Commercial |
9.9 |
0.3 |
0.5 |
|
Wal-Mart Stores |
Retail |
9.0 |
0.3 |
0.5 |
|
Safeway Stores |
Retail |
8.0 |
0.2 |
0.4 |
|
|
|
|
|
|
|
Total |
|
357.3 |
10.7 |
17.9 |
(d) Water Reuse Systems. Statutorily, water diverted through each of the entities’ delivery systems is prohibited from reuse; therefore, this plan element has not been included for further consideration.
(e) Distribution System Leak Identification and Repair. Measures and programs are presently in place as explained in GJMC 45.04.220 through 45.04.270, current water conservation planning.
(f) Dissemination of Information Regarding Water Use Efficiency Measures. Measures and programs are currently in place as explained in GJMC 45.04.220 through 45.04.270, current water conservation planning.
(g) Water Rate Structures and Billing Designed to Encourage Water Use Efficiency. Measures and programs are currently in place as explained in GJMC 45.04.220 through 45.04.270, current water conservation planning.
(h) Regulatory Measures Designed to Encourage Water Conservation. Regulations or ordinances that strictly prohibit the wasting of water are in place for each of the entities.
(1) The City. The City currently has an ordinance, GJMC 13.08.370, Wasting water, which states:
The owner or lessee of any premises to which any water shall be conducted from the water mains shall keep all pipes and their fixtures from the curbline to his premises and on such premises in good repair and protected from the frost, and tight, so as to prevent waste of water. Upon any waste resulting from a breakage of such pipes or fixtures, or any imperfection of such pipes or fixtures, the owner or lessee shall forthwith stop such waste of water by repairing the old work or by laying new work. It shall be unlawful to use water so that it is wasted by flowing off lawns and gardens into the street gutters. (Code 1994 § 38-132; Code 1965 § 31-34).
The City is currently developing standards for the installation of irrigation systems in new developments. New subdivisions that have irrigation water available will need to design and install irrigation systems to standard and undergo inspection as part of the infrastructure in the development. These systems will also be included in as-built construction drawings on file with the City, and will have a one-year warranty – the same as the rest of the infrastructure required with new development. After construction the irrigation system will then be owned and maintained by the subdivision’s homeowner’s association (HOA). The standards should be completed sometime this summer.
(2) Clifton. Policy No. 420, Water Usage Fees, Unintentional Water Use and Water Meter Testing. The District is not responsible for water on the customer’s side of the meter. When a leak is detected on the customer’s side of the meter, the customer should notify the District as soon as possible. Once a leak is detected on the customer side of the meter it is the customer's responsibility to repair the leak as expeditiously as possible. The District will read the meter as soon as possible after receiving notice of the leak. The customer must contact the District within 180 calendar days of detection of a leak to request an adjustment. Clifton is currently looking at developing a more extensive policy regarding wasting of water.
(3) Ute. The following statement is in Ute’s District Rules and Regulations:
Each customer shall be responsible for maintaining the entire length of their service line from the road right-of-way property line to the structure(s) or property served. Leaks or breaks in the customer’s service line shall be repaired by the customer in a timely manner. If District personnel discover, determine or confirm the existence of a leak, the customer will be so notified. If satisfactory progress toward repairing the leak has not been accomplished within a reasonable length of time, as determined by the District, the District may shut off the service until the leak(s) or break(s) have been repaired. Only the loss of metered water that is a direct result of underground leaks or breaks in the customer’s service line will be considered for leak adjustments, and only after the District confirms the repair. An individual customer shall be entitled to no more than one leak adjustment to their water bill in any consecutive twelve (12) month period and, when approved, leak adjustments will cover a period of water loss not to exceed sixty (60) days.
(4) Mesa County. Mesa County has recently adopted a new landscape code for new construction development projects. The DRIP members provided input and document reviews in support of Mesa County’s efforts to develop the new landscape code. The new code utilizes a “point system” that encourages the use of low water demand landscapes that encourage long term water conservation. The code allows for projects to include undisturbed native landscapes as key components to the overall landscape plan requirements. There is a heavy emphasis on utilizing drought tolerant plant species that meet the published cold-hardiness zones unique to Mesa County. For proposed developments in areas that have no access to irrigation ditch water, the governing domestic water utility have a major say in the final approved landscape plan as it pertains to potable water use for outdoor irrigation. The specific requirement of the code can be found at the Mesa County website, www.mesacounty.us/planning, within the Landscape Handbook Quicklink.
(i) Table 45.04.300(b) outlines the three water conservation programs, time frames for each program and estimated costs.
|
Water Conservation Program |
Start Date |
End Date |
Number |
Water Savings |
Program Cost |
|---|---|---|---|---|---|
|
Toilet Retrofit Program |
2012 |
2018 |
50/yr. |
11,200 gallons per home, 560,000 gallons per year |
$5,250/yr. |
|
Landscape Audits |
2012 |
2018 |
10/yr. |
25,000 gallons per home, 250,000 gallons per year |
$1,000/yr. |
|
C-I Water Audits |
2012 |
2018 |
10 |
3% – 10.7 mg 5% – 17.9 mg |
$7,500 |
(Res. 24-12 (7.0), 6-20-12)
45.04.310 Modification of water demand forecast.
Modification of the demand forecast was calculated using the estimated water savings from the outlined programs above. Table 45.04.310 is a summary of estimated water savings in the Grand Valley from water conservation programs.
|
|
|
2010 |
2015 |
2020 |
2025 |
|---|---|---|---|---|---|
|
|
|||||
|
1 |
Total Water Demand |
6,111 |
6,933 |
7,553 |
8,237 |
|
|
|||||
|
|
Estimated Water Savings: |
|
|
|
|
|
2 |
Landscape Audits |
|
1.00 |
2.25 |
3.50 |
|
3 |
Fixture Retrofits |
|
1.68 |
4.48 |
7.28 |
|
4 |
C-I Audits |
|
8.95 |
17.90 |
17.90 |
|
5 |
Total Estimated Water Savings |
|
11.63 |
24.63 |
28.68 |
|
|
|||||
|
6 |
Projected Water Demand with Savings |
|
6,921 |
7,528 |
8,208 |
|
1 |
Water demand from the City, Clifton, and Ute. |
|
2 |
Estimated annual water savings for 10 homes May – Sept.: 250,000 gallons. Irrigation audits to begin in the summer of 2012. |
|
3 |
Toilet retrofit savings is 560,000 gallons per year for 50 homes. Program to begin 2012. |
|
4 |
Estimated C-I water savings at five percent; audits will begin in 2013. |
|
5 |
Total of all program savings. |
|
6 |
Estimates water demand with program water savings. |
(Res. 24-12 (7.0), 6-20-12)
45.04.320 Monitoring and evaluation of the water conservation program components.
The water conservation programs will be announced and implementation will begin during 2012. Monitoring the success of the water conservation program components will include measuring water use as well as money spent on the selected conservation measures and programs. The program elements will be audited annually for effectiveness and water savings. Each entity will be responsible for their individual effectiveness audits and will then be compiled, reviewed, and presented in an annual report by the DRIP Steering Committee. This annual report will be posted for public review on the DRIP webpage and be presented to each of the governing bodies of the three entities. Specific data tracking and monitoring will be established as each individual water conservation program measure is implemented. Additionally, the following data will be compiled annually for each entity:
(a) Monthly metering data, both raw and delivered potable water;
(b) Annual data on new development for each entity, including number of new single-family dwelling units, multifamily units, commercial and industrial properties developed;
(c) Annual accounting of new landscape installations;
(d) Public feedback regarding the water conservation measures implemented.
(Res. 24-12 (7.0), 6-20-12)
45.04.330 Plan updates and revisions.
The required schedule for updating the water conservation plan is seven years. The progress towards achieving the water savings goals will be monitored on an annual basis, as stated above, by the entities through the DRIP program. The entities may opt to update the plan prior to the seven-year requirement if the annual plan review indicates actual water savings deviating beyond the anticipated projections. The deviations could result from numerous factors which could include greater or lower customer participation in the offered water conservation programs or greater or lower than projected service population growth and resultant water demands.
(Res. 24-12 (7.0), 6-20-12)
Article IV. References
45.04.340 References.
AWWA Manual M52, 2006. Water Conservation Programs – A Planning Manual, Denver, CO.
Colorado Water Conservation Board, Conservation Plan Development Guidance Document, 2007, Denver, Colorado.
NOAA (National Oceanic and Atmospheric Administration), 1991. Climatology of the United States, No. 81, Monthly Station Normals of Temperature, Precipitation, and Heating and Cooling Degree Days, 1961-1990, Colorado. National Climatic Data Center, Ashville, N.C.
City of Grand Junction Personnel: Personal Communication.
City of Grand Junction, Water Conservation Plan, 1996.
Clifton Water District: Personal Communication.
Clifton Water District, Water Conservation Plan, 1996.
Ute Water Conservancy District: Personal Communication.
Ute Water Conservancy District, Water Conservation Plan, 1996.
Vickers, Amy, 2002. Handbook of Water Use and Conservation, Amerherst, Massachusetts.
Water Conservation Planning and Implementation Training, 2008. REI Flagship, Denver, Colorado.
(Res. 24-12, 6-20-12)
Article V. Maps of Water Providers and Irrigation Systems in the Grand Valley
45.04.350 Maps.
(a) Grand Valley Domestic Water Providers.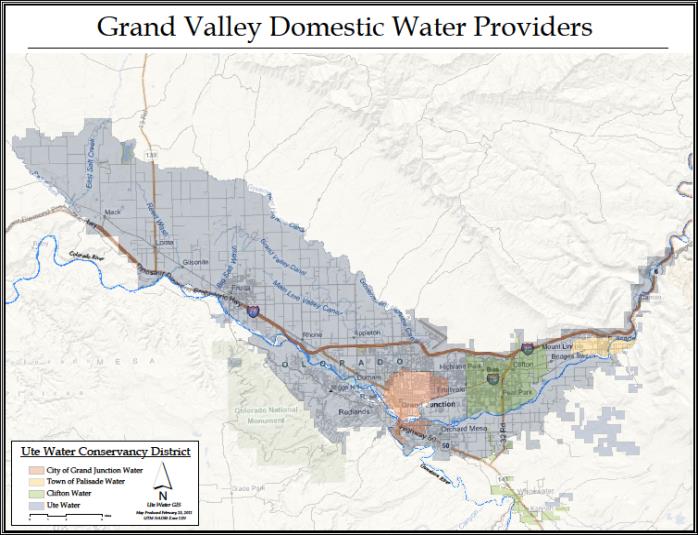
(b) Irrigation Providers.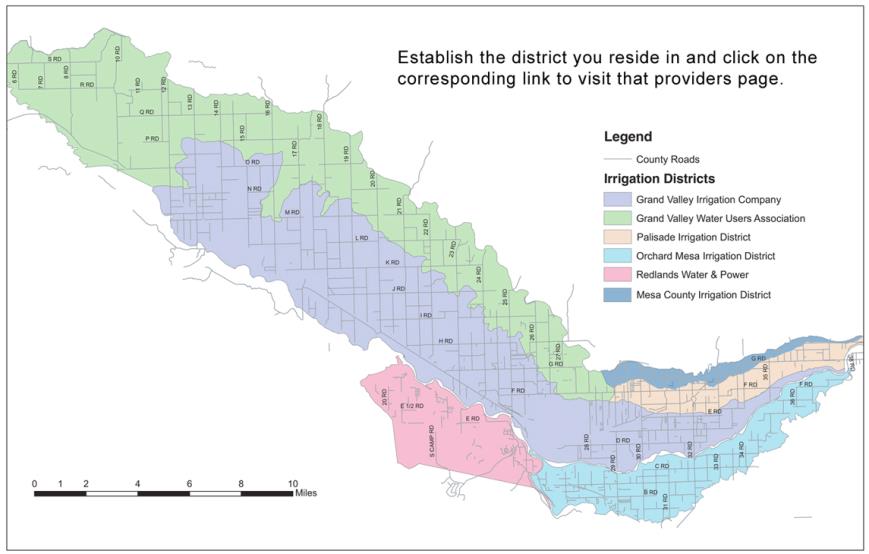
(Res. 24-12 (Appendix A), 6-20-12)
Article VI. Clifton Water District, City of Grand Junction, Town of Palisade and Ute Water Conservancy District Drought Response Plan
45.04.360 Drought Response Plan Introduction.
Drought can be defined as an extended period of below-average precipitation and/or stream flow that stresses a water supply. Drought is a natural, ongoing situation in Colorado – a phenomenon that has recurred regularly throughout Colorado’s history.
For planning purposes, the City of Grand Junction, Ute Water Conservation District, Clifton Water District and the Town of Palisade water supply strategy is to have enough water to meet unrestricted customer usage during a period similar to the 1977 or 2002 drought.
No one can predict how long a drought will last or if it will be worse than those used in our calculations. Therefore, even though Grand Valley domestic water supply currently exceeds its use, the providers must be prepared to recognize drought conditions early and respond appropriately. The Drought Response Plan (DRP) codified in this chapter is designed to provide governing boards and city councils with a set of options to consider in dealing with a prolonged drought.
Each domestic water provider has developed a water conservation plan. Implementation of this plan will be accomplished through an ongoing annual effort, budgeted and paid from the four domestic water providers. These plans include, but are not limited to, the following items:
(a) Initiate drought response information project to provide public education through all sources of media on why and how to reduce per capita consumption;
(b) Encourage all customer classes to evaluate, redesign and reconstruct existing landscapes and outdoor water uses to reduce overall consumption;
(c) All public institutions to take the lead in evaluating indoor and outdoor water use practices. Parks, open spaces, medians, golf courses, fountains, etc. to be audited for current consumption and redesigned or re-operated to reduce consumption;
(d) Examine all municipal and County code provisions that affect water usage, such as landscape standards, storm water best management practices, and building codes provisions and amend, if appropriate, these code provisions to meet not only the objectives of the code as originally intended but also to reduce water consumption;
(e) Campaign proclamation to alert public to the need to conserve water;
(f) Acquaint customers with measures they can expect if Stage I or Stage II drought occurs;
(g) Monitor potential drought response effectiveness; recommend adjustments as needed to the city councils and governing boards and report to the public regularly;
(h) Highlight unusually high use on customers’ bills. Contact these customers and special interest groups with heavy water use to get their ideas and suggestions for obtaining long-term reductions (golf courses, parks, hospitals, schools, government);
(i) Suggest water use surveys (comprehensive water use analyses) for high volume water users in all customer classes, advise them on ways to reduce water use and, where appropriate, suggest retrofit devices;
(j) Coordinate with Mesa County; invite to meetings;
(k) Meet with citizens groups and convey messages of basic water conservation and Stage I and Stage II drought conditions;
(l) Publish “water waste reduction” suggestions for households and aggressively promote them by including them with water bills, putting them on web sites, and using other effective distribution methods, including billboards and public service announcements;
(m) Train customer service employees to respond to conservation-related questions and give information;
(n) Communicate with the irrigation districts and companies to cooperatively work with them to ensure that adequate irrigation water will be available throughout irrigation season;
(o) Develop some demonstration Xeriscape™ areas for customers to identify with;
(p) Encourage xeriscaping and low-water consumption practices;
(q) Quarterly meetings of domestic water providers to review water supply projections, current reservoir capacity and ongoing conservation efforts;
(r) Consider incentives by the domestic water providers to customers to replace outdated, water-consuming indoor plumbing fixtures, faucets and shower heads;
(s) Each provider considers adjusting increasing block rate (separation of residential from commercial/industrial rates); and
(t) Train and assign field and customer service personnel to:
(1) Monitor outdoor use;
(2) Offer suggestions to customers on water wise use; and
(3) Identify and work with high water users.
Denver Water holds the trademark for the term Xeriscape. The word Xeriscape was created in 1981 for landscape water conservation education programs. The name is a combination of “landscape” and the Greek word “xeros,” which means “dry.”
(Res. 24-12 (Appendix B), 6-20-12; Memorandum of Understanding, April, 2003. Formerly 45.04.020)
45.04.370 Drought Response Plan – Stages of drought.
The Drought Response Plan is based on two stages of drought, each of which is triggered by either a combination of the historic user pool projections, water provider storage, or stream flow projections.
(a) Stage I Drought – Ongoing Intensive Water Conservation. Conditions are similar to 2002 drought, but no real impacts to area domestic water providers; Statewide drought conditions may or may not exist that affect area irrigators. Some voluntary water use reductions anticipated. Actions undertaken involve predominantly sharing water supply.
The 2002 drought had a Statewide drought declaration; Ute Water Conservancy District’s primary water source and the Lower Molina power plant were out of water by mid July; Vega reservoir did not fill. The Town of Palisade’s Cabin Reservoir had only 75 percent of normal but springs remained steady. The City of Grand Junction’s Purdy Mesa and Juniata Reservoirs started out about 75 percent full with about 1,100 acre feet of municipal water available on top of Grand Mesa. The historic user pool (HUP) received approximately 75 to 80 percent of full allocation but had water for full irrigation season.
(b) Stage II Drought. At least one of the four water providers’ supply is at or near minimum target levels (to be determined) for either storage or stream flows requiring drastic water conservation measures to ensure water needs for the most essential uses for all Valley water customers. Mandatory water use reductions and a drought rate imposed.
(c) Moving from a Stage I drought to a Stage II drought will be dependent on several factors. During a Stage I drought all water providers will have gone from meeting on a quarterly basis to meeting on a monthly basis and all water supplies, either storage or stream flows, will be monitored very closely. If it is anticipated that the Historic User Pool (HUP) is expected to only receive 75 percent of entitlement and irrigation districts are anticipating they will not be able to stretch available water supplies throughout the entire irrigation season we will need to take stronger action to ensure our domestic supplies are not overburdened. Domestic water suppliers usually have enough water resources to supply their current water demands; if outside irrigation demand that has normally been supplied by one of the irrigation canals is suddenly added to the domestic demand it will cause both treatment and capacity delivery problems. Individual triggers for each domestic water provider have been discussed and will be modified as weather and demand dictate. Currently the Ute Water District trigger for moving to Stage II will be when they will be at 75 percent of storage capacity in Jerry Creek reservoirs by midsummer. The Town of Palisade’s Cabin Reservoir is below 75 percent capacity right after spring runoff and Ute Water may not have capacity to keep them whole. Clifton Water District will use the 75 percent of Historic User Pool storage available as their trigger as they do not anticipate any numeric triggers; the only hardship may be getting water to treatment facility from the river. The City of Grand Junction is anticipating a trigger of 50 percent of storage for Juniata and Purdy Mesa Reservoirs by end of irrigation season.
(Res. 24-12 (Appendix B), 6-20-12; Memorandum of Understanding, April, 2003. Formerly 45.04.030)
45.04.380 Response to drought.
This plan identifies two ways to respond to a drought: increasing water supply and decreasing water use.
(a) Increasing Water Supply. The four area water providers can possibly augment their water supply from other sources. There are several options for doing this, each presenting its own set of intergovernmental and technical considerations. Among the possibilities:
(1) Call back water rights we allow others to use (ranch lessees);
(2) Augment raw water sources through river pump stations if river water is in priority;
(3) Pay an upstream water user to allow us to divert more water;
(4) Seek waivers from State agencies to allow us to divert and use irrigation water decrees if available; and
(5) Purchase municipal water contracts from federal projects if available (possibly must do in advance).
(b) Decreasing Water Use. The prime drought response is to budget water use for the most essential uses for the drought’s duration. There are a wide variety of options that could be used to decrease water use. In general, we expect that reductions would be voluntary as outlined in the introduction, GJMC 45.04.360. Voluntary measures would continue with a Stage I drought. Mandatory measures would be implemented during a Stage II drought. We believe it is important to ensure that any discomfort, difficulty or potential loss is shared as equitably as possible across all customer classes.
(Res. 24-12 (Appendix B), 6-20-12; Memorandum of Understanding, April, 2003. Formerly 45.04.040)
45.04.390 Stage I drought.
Based on past experience of other domestic water providers, we can expect to achieve between zero percent and 10 percent reduction in water consumption with the following measures:
(a) Monthly meetings of domestic water providers to review water supply projections, current reservoir capacity and ongoing conservation efforts;
(b) Continue all measures outlined in the ongoing water conservation plan implementation as outlined above;
(c) Initiate campaign to alert public of Stage I drought conditions;
(d) Monitor drought response effectiveness; recommend adjustments as needed to the city councils and governing boards, and report to the public regularly;
(e) Request all government entities to reduce their own short-term domestic water use by 30 percent of last five-year average to demonstrate leadership in dealing with the crisis, and then publicize the results;
(f) Publicize creative water saving efforts of individuals and business customers as examples of leadership;
(g) Assist City and County Health Departments in distributing guidelines for using gray water where legal and appropriate;
(h) Suggest the following ideas to reduce indoor water use:
(1) Serve water in restaurants only upon request;
(2) Encourage all hotels, motels, inns and bed and breakfast establishments to have only shower heads meeting maximum flow rates of 2.5 gallons per minute and faucet aerators meeting maximum flow rates of 2.2 gallons per minute; and
(3) Promote the reduction of water-cooled air conditioning;
(i) Suggest the following ideas to reduce outdoor water use:
(1) Cut back on street cleaning, sidewalk and driveway washing, except where spills of toxic or hazardous substances or where public health and safety issues can only be resolved by washing the impermeable surface;
(2) Suggest to customers other ways to clean sidewalks or driveways and any other hard surfaces without the use of hoses;
(3) Suggest to customers other ways to wash vehicles to minimize water waste;
(4) Suggest that home owners not fill private swimming pools; and
(5) Require that ornamental fountains in buildings and parks be turned off;
(j) Provide information and assistance to customers planning for post-drought landscape revival or replacement.
(Res. 24-12 (Appendix B), 6-20-12; Memorandum of Understanding, April, 2003. Formerly 45.04.050)
45.04.400 Stage II drought.
Based on past experience of other domestic water providers, we can expect to achieve between 10 percent and 20 percent reduction in water consumption with the following measures:
(a) Continue all measures initiated in Stage I droughts;
(b) Increase meeting frequency from monthly to weekly;
(c) Adjust drought water rates to increase financial incentives for using less water;
(d) Intensify public information to reinforce the need for extreme measures (generate awareness of drought status, response, policy recommendations, requirements and penalties);
(e) Provide information and assistance to customers planning for post-drought landscape revival or replacement;
(f) Eliminate all fire hydrant uses except those required for public health and safety;
(g) Reduce indoor water use:
(1) Eliminate serving water in restaurants except upon request;
(2) Require all hotels, motels, inns and bed and breakfast establishments to have only shower heads meeting maximum flow rates of 2.5 gallons per minute and faucet aerators meeting maximum flow rates of 2.2 gallons per minute; and
(3) Assist County Health Department in distributing guidelines prohibiting use of gray water;
(h) Intensify reductions of outdoor water use:
(1) Increase penalties for wasting water, violating any permits or ignoring restrictions;
(2) Prohibit street, sidewalk and driveway washing by flushing methods, except where spills of toxic or hazardous substances or where public health and safety issues can only be resolved by washing the impermeable surface;
(3) Prohibit curbside car/truck washing by all customers;
(4) Prohibit car/truck washing on dealers’ lots;
(5) Prohibit filling private swimming pools;
(6) Require that ornamental fountains in buildings and parks be turned off;
(7) Impose restrictions in landscape water use in proportion to the severity of the drought;
(8) Prohibit all new landscaping including planting of trees and shrubs; and
(9) Train and assign field and customer service personnel to:
(i) Police outdoor water use;
(ii) Issue warnings; and
(iii) Impose penalties for water waste, violations of any permits and noncompliance with restrictions;
(i) Prohibit outdoor water use (as a last resort in an extremely severe drought) except for subsistence irrigation of trees and shrubs.
(Res. 24-12 (Appendix B), 6-20-12; Memorandum of Understanding, April, 2003. Formerly 45.04.060)
45.04.410 Public outreach.
During a drought, it is essential that the four area water providers communicate effectively not only with their customers, but also with other area water suppliers, local governments, and other groups who may be affected by this drought response. An intense water conservation effort was developed in 2003 and has support from Ute Water Conservancy District, Town of Palisade, Clifton Water District and the City of Grand Junction. The outreach campaign is administered through the four water providers and is the Drought Response Information Project or DRIP.
(Res. 24-12 (Appendix B), 6-20-12; Memorandum of Understanding, April, 2003. Formerly 45.04.070)
45.04.420 Summary.
While the options listed in the Drought Response Plan are based on lessons learned here and from other water utilities during past droughts, it is important to understand that every drought is different and that the governing boards and City Council will adjust and refine measures based on actual drought conditions. This plan is intended to help staff, customers, stakeholders and the boards and Council be better prepared when a drought occurs.
(Res. 24-12 (Appendix B), 6-20-12; Memorandum of Understanding, April, 2003. Formerly 45.04.080)