


Chapter 8 BUSINESS PLAN
WHAT IS A BUSINESS PLAN?
The vision created in this Plan for parks, facilities, recreation, and arts is crucial to Olympia. The business of providing and managing the delivery of services the public expects from the Olympia Parks, Arts and Recreation Department is equally critical. Annually, through the City’s Operating and Capital budgets, millions of dollars are invested in staff, equipment and supplies to provide facilities and activities which shape the quality of life in Olympia.
The Business Plan has two parts-the CAPITAL INVESTMENT STRATEGY (CIS) and DEPARTMENT PERFORMANCE MEASUREMENT. The CIS forecasts future new facilities and lands needed to serve a growing Olympia community. In addition to new facilities, the CIS will include major facility renovations that are identified through the Department’s Capital Asset Management Program. The CIS forecasts park investments out to the year 2035, but projects beyond 2021 are conceptual. Of critical importance is the role the CIS serves in guiding the annual Capital Facilities Plan, which in turn, becomes the OPARD’s annual capital budget.
Secondly, the Business Plan is about performance measurement. It includes a description of what services are provided, how the Department is organized to deliver services, and how performance measures are employed to determine the success of the business conducted. The Business Plan is organized around the Divisions in the Department. Within each Division, the public will be able to see what services are provided and how the Department is performing in providing those services. Through a commitment to performance measurement, the Department strives to achieve the following:
• Promote community involvement and actively seek input in the operation of the Department
• Offer quality recreational and educational activities aimed at satisfying the needs of varying age levels and interests
• Maintain and improve the appearance and safety of parks and facilities at the highest level possible within available resources
• Develop data to efficiently manage delivery of quality services to the community
• Serve as a critical partner in planning for growth in Olympia
• Sustain and expand the role of arts in shaping the quality of life in Olympia and community culture.
The Department has a priority of using data to assist in making decisions. The establishment of a department annual Performance Report will assist in developing a business culture that clarifies the expectations of staff in a measurable way. This report will include measurable data that is not only important to the business of the department but also acknowledges key metrics defined by the community.
WHO WE ARE AND WHAT WE DO
The Olympia Parks, Arts and Recreation Department is organized into six divisions. The organizational chart below shows how the Department is organized and includes key services and current staffing levels.
 View Parks Department Organization Chart.
DIVISION OVERVIEW
The key to successful public service is understanding what the community needs and values, and the ability to respond with a system of service delivery that meets public expectations within available resources. Outlined below is an overview of each Division and the major areas of service each provides the City.
The ADMINISTRATION division is leadership. Leadership is delivered in the form of policy guidance, human resources planning and budget development and management. The Administration Division provides direct support to the City Council, City Manager and City Executive Team. The Administration Division also sets the work program for the Department and establishes the work culture. Members of the Administration Division are conduits to and from the community and serve as communicators of Department direction on major issues.
The PLANNING AND DESIGN division is long range facility planning, land acquisition, park design and development, condition assessment and major infrastructure rehabilitation. This Division prepares the Olympia Parks, Arts and Recreation Plan, and participates in other long range planning efforts conducted by other Departments. The Division provides policy guidance and direction on all issues related to parks.
The Planning and Design Division is responsible for the Department Capital Budget which is the funding source for turning plans into projects. The Division oversees the revenues and expenses of capital funding and the financial accounting for land acquisition and park construction projects. Once capital funds are secured, staff in this Division work with the community to design and build parks and park amenities. As a result, they track acres of parkland, types and number of park facilities, park amenities, and park condition.
A Capital Asset Management Program (CAMP) has been developed to assess the condition of park infrastructure and prioritize park major maintenance projects to keep parks safe and accessible. The culmination of rating condition and estimating costs for repairs for each park results in a performance measure titled “Facility Condition Index” or FCI. The FCI is a formula where the total cost of repairs (the maintenance backlog) is divided by the current estimated replacement value of the park assets (not including land). The FCI approach is used by the National Park Service and other communities as a way to communicate the overall condition of a park system.
There is a vital relationship between the Planning and Design division and the Park Maintenance division. Olympia, like many communities, has built new facilities without concurrently setting aside the funds for maintenance. In the future, it is critical that each new park project contain both a capital and operations/maintenance cost estimate before a project goes beyond design. Both divisions must commit to securing these funds to ensure that the maintenance backlog doesn’t increase and the FCI for the park system doesn’t slide any lower.
The PARK MAINTENANCE division maintains parks so that they are clean, safe and accessible for public use and enjoyment. Over the last year, the Park Maintenance leadership team has invested heavily in the creation of a Park Asset Management Program. This Program is all about understanding the costs involved in maintaining each park in Olympia’s park system.
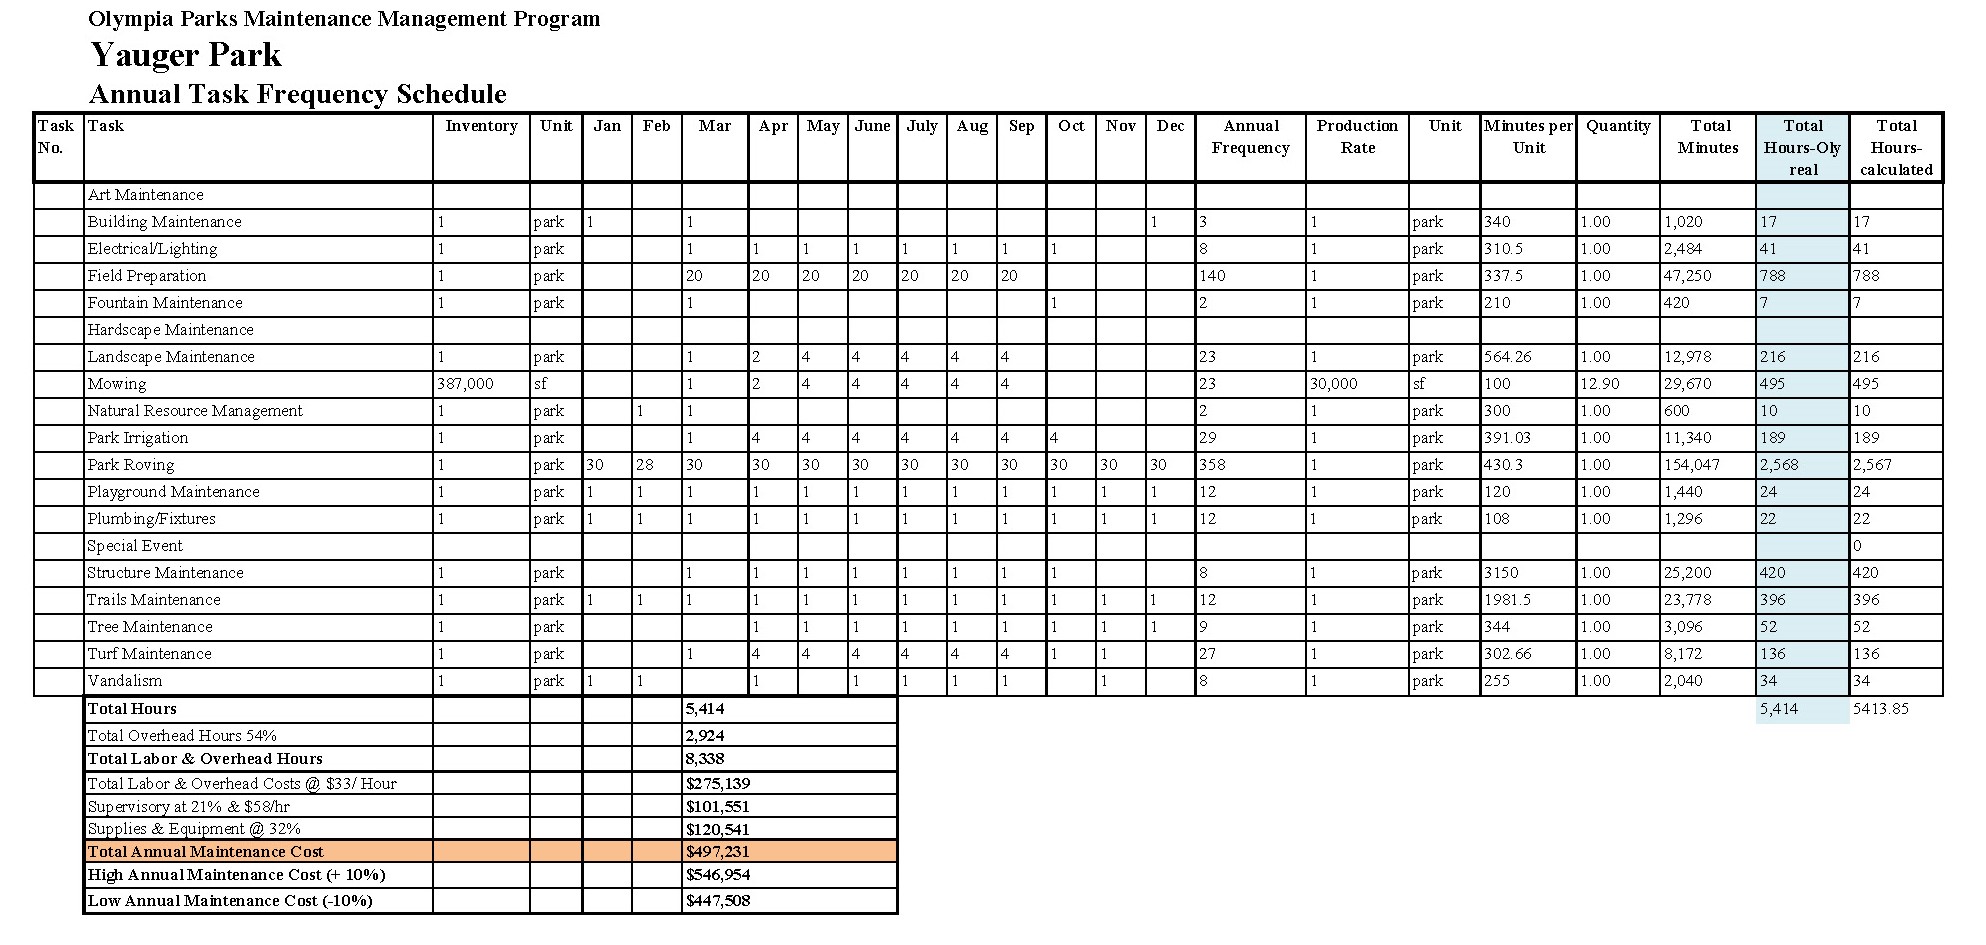
The first step in developing the Park Asset Management Program was to create a Maintenance Management Plan (MMP) for each park. The MMP is a spreadsheet listing 19 maintenance tasks and the frequency, expressed in staff hours per each task, over a calendar year. An example of an MMP for Yauger Park is shown in Table 1. The MMP methodology will also be used to analyze service levels and maintenance methods to find the most cost-effective ways to maintain parks.
The second step in creating the Park Asset Management Program was to track the actual hours staff spent on park maintenance for an entire year. As a result, we have an excellent understanding of the current labor and expense to maintain each park and our total park system.
 View Olympia Parks Management Program Yauger Park
The final step is to establish a service level for each park. The service level gives the community an understanding of how parks are intended to be maintained. Service levels differ based on the use, liability and aesthetic anticipated for each park. Once the service level for each park is assigned, then the MMP for each park is adjusted to ensure the hours and supplies (and ultimately funding) are sufficient to maintain each park. If funding is not sufficient to maintain each park to the assigned service level, then either the service level needs to drop, hours reduced from one park to cover another, or new funding is provided to makeup what is needed to meet the service level. This analysis is expected to be complete in 2016.
The Park Maintenance division also includes the Park Stewardship Program which provides two key services. The first is Volunteers In Parks which manages hundreds of volunteers every year that contribute thousands of hours to improve parks by pulling ivy in forests, restoring/planting native plants, weeding in parks, and spreading gravel on trails. Volunteerism in parks is a wonderful expression of people’s love for their community and its park system.
The second key service in the Stewardship Program is the Park Ranger function. The Park Ranger’s responsibilities are many, but authority is limited. The OPARD Park Ranger is not a fully commissioned police officer and has no authorization to make arrests. However, the Park Ranger is uniformed and spends a limited amount of time patrolling parks, coordinating with the Olympia Police Department on civil and criminal issues, and reminding park users about park rules.
The RECREATION division provides access to recreational opportunities for the community. Recreation has five primary areas of service; Youth, Teen, Athletics, Classes and Outdoor Adventures. Unlike any other division in OPARD, the majority of the recreation activities provided to the community are fee-based in nature, and require a high level of financial self-sufficiency. A successful recreation program requires professional staff, creative marketing and safety awareness.
In 2015, the Recreation Division contracted with a nationally based agency called the “Learning Resources Network” to provide a thorough audit of existing Recreation Division business practices. This audit utilized activity registration data, organizational structure and marketing practices, and compared those results to national benchmarks. The summary of the report is that OPARD Recreation Division is operating at a very high level with three consecutive years of revenue growth. It also highlights clear opportunities for continued growth in the following areas:
1. Community Engagement – The recreation program will benefit from improved and consistent connections to the community beyond the staff/customer relationship. Staff time must be dedicated to establishing new market segments, engaging customers in focus groups, developing win/win partnerships and exploring new special events. Maintaining a customer repeat rate of 40% while increasing New Offerings to 15% are realistic goals for the next five years.
2. Effective Organization – Staffing levels must be consistent with the demands of the services being offered. The primary focus of the City’s Recreation Program staff should be on (1) delivery of high quality programs and (2) program development and growth of new programs. An assessment of the capacity of the Customer Service Team and taking advantage of skills and abilities in that work unit will ultimately build a more sustainable program for the City. A Staff Productivity (Total Revenue/Total FTE Engaged in Revenue Generation) goal of $150,000+ is a reasonable goal that will make Olympia Parks, Arts and Recreation an industry leader.
3. Marketing Commitment – A continued emphasis on smart marketing and using industry best practices is important to continue strong registration numbers in the recreation program. In addition, the Department should find additional resources to improve the quantity and quality of marketing materials. A goal of 8% of the recreation budget is a sound and attainable goal to strive towards.
The FACILITIES division facilitates access to a variety of reservable facilities in the department inventory. These facilities include athletic fields, park shelters, Artesian Commons Park, The Olympia Center, Percival Landing moorage and the Harbor House. Staff designs and implements policies and procedures that guide the public’s use, including regulations, use prioritization, and fees.
Meeting the customer’s expectations from reservation through event cleanup is a strong focus for the department. Staff and equipment/supply resources must be available to meet the needs of a user before a facility can be considered for public rental. Because of this, facilities (and connected services) available for reservation are reviewed annually and adjustments are made to ensure a good experience for all that are involved.
As with Recreation, marketing is an important function to ensure current and potential customers are aware of the variety of facility rentals provided by the Parks, Arts & Recreation Department. Staff will allocate time in the upcoming plan cycle to find ways to dedicate a minimum of 5% of the overall facility budget to marketing. Currently marketing resources are less than 1% of this division’s budget.
The ARTS division creates community identity and civic engagement through public art and Arts Walk. The Arts division manages a growing collection of (currently) 100 individual pieces of public art. This includes acquisition, maintenance and education programming. These artworks, both sculpture and flatwork, are found in public parks and buildings throughout the city. Programs and policy are shaped by the Olympia Arts Commission, a nine-member advisory committee to City Council. Direction is also given by the City’s Comprehensive Plan and the Municipal Art Plan, which proposes annual projects which draw from the Municipal Art Fund and provides a 5 year planning horizon for new public art projects. The focus of the division is two-fold:
1. Public Art- Olympia’s public art programs and purchases are funded through two sources: a $1 per Capita allocation from the City’s General Fund that was initiated in 1990, and a 1% for Art set-aside for City construction projects over $500,000 in value that are visible and usable by the public. Funds from these sources are deposited in a Municipal Arts Fund. The Municipal Art Plan establishes budgets for new public art projects undertaken by the City, whether in conjunction with new capital projects or independent of them. Projects range from small (less than $15k) to major (over $50k) installations involving design teams, and may include visual, literary and performing arts.
2. Art Walk- In addition, the twice annual Arts Walk, currently in its 26th year, brings together 100+ downtown businesses and 400+ area artists to celebrate the creativity in our community. Voted “Best Art Event” in 2013 and 2014 by readers of The Weekly Volcano, Arts Walk is often credited as a defining event for Olympia, one that invites 10,000+ visitors into our downtown core to engage in the arts, play, shop and dine.
OTHER AREAS OF EMPHASIS
The SAFE AND SECURE PARKS INITIATIVE is the highest priority of the Department. Its purpose is to keep Olympia parks, facilities and activities safe. In 2015, the Department initiated the initiative in response to growing trends of vandalism, drug and alcohol use, illegal camping, and threatening behavior occurring in parks. All Department Divisions are currently working together to adjust policies, procedures, and operations in ways that improve safety of our parks and facilities.
OPARD will continue to be aggressive in pursuing GRANTS AND DONATIONS from all available funding sources in order to maximize the public investment in Parks, Arts & Recreation facilities and services. The Department will specifically target County, State, and Federal funding opportunities to enhance projects identified throughout the plan. OPARD will also continue to work with non-profit agencies such as the PARC Foundation of Thurston County to solicit local funding opportunities, sponsorships, and donations.
CAPITAL INVESTMENT STRATEGY
The Plan’s Capital Investment Strategy (CIS) is a table that shows anticipated revenue and proposed capital projects during the Plan’s 20-year planning horizon. The first six years of the CIS table (2016-2021) is titled the “Capital Facilities Plan” and includes the year each project is anticipated to be funded. The remaining 14 years (2022-2035) is titled “Long Range Options.” Since the Parks, Arts and Recreation Plan is updated every 6 years, it is anticipated that the next plan (anticipated to be completed in 2022) could include a project list that varies from this Plan’s list; The community may express different priorities at that time. Other considerations when reviewing the CIS table:
• The table shows OPARD’s revenue sources for capital projects: Voted Utility Tax, Non-Voted Utility Tax, Park Impact Fees, SEPA Mitigation Fees, and Metropolitan Park District revenue. General Fund Support is not shown but is the primary source of the Department’s operating budget.
• Each revenue stream is shown separately in the table in a slightly different shade of green. Park acquisition projects are highlighted to make them easier to locate.
• The CIS table is based on projected revenue streams, planning-level cost estimates, and land acquisition costs that may vary significantly from actual costs. While every effort has been made to make the figures in this table as accurate as possible, there are many unknowns that could have a significant impact on implementation.
 View 2016 Parks Arts and Recreation Plan Capital Investment Strategy
DEPARTMENT PERFORMANCE MEASUREMENT
The Department is striving to improve its use of performance measures to determine and to communicate levels of success in delivering services to the community. This data-based approach will account for meeting expectations in many different areas: park acres, park condition, recreation activities, and park asset management to mention a few. Performance can be measured in many ways and methods and will likely evolve over the years ahead. The performance measures, outlined below by Division, are a starting point to improve community understanding on how the Department is working to manage public investment in parks, arts and recreation.
The performance measures listed under each Division below are monitored and the results published in the annual Business Performance Report. Some performance measures may be goal oriented and the actual performance goal is noted. Some performance measures are not goal oriented and only measure the actual numeric change on an annual basis.
PLANNING AND DESIGN
Performance measures in this division focus on key services such as: land acquisitions, park levels of service tied to Park, Arts and Recreation Plan and park impact fees, and the Capital Asset Management Program, whose success is expressed by the Facility Condition Index.
• Total Park Acreage-measure of total acres of each park type neighborhood, open space and community park acres comprising Olympia’s park system.
• Neighborhood Park Level of Service (LOS) - measure of the current level of service for neighborhood parks defined as a ratio of acres per 1000 population. Current LOS is .71 acres per thousand population. The 2035 Goal LOS is 1.09 acres/thousand population.
• Community Park LOS - measure of the current level of service for community parks defined as a ratio of acres per 1000 population. The current LOS is 2.304 acres per thousand population. The 2035 Goal LOS is 3.00 acres/thousand population
• Open Space LOS - measure of the current level of service for open space parks defined as a ratio of acres per 1000 population. The current LOS is 11.49 acres per thousand population. The 2035 Goal LOS is 11.19 acres /thousand population.
• Area Walking Distance to a Park – percentage of land within the city and Urban Growth Area located within walking distance (one-half mile) of an open space or neighborhood park.
• Developed vs. Undeveloped Parks – measure the ratio of how many total city park acres are developed vs. undeveloped. Currently there are 1015 acres of park in Olympia’s park system.
• Miles of Trails – Measure annually total miles of non-motorized trails managed by OPARD.
• Facility Condition Index - measure of park system condition. This measure is derived by dividing the backlog cost of maintenance by the current estimated replacement value of the park assets (not including land).. This rating is a simple way to communicate how well facilities are being maintained, and is used by many other park systems.
• Major Maintenance Backlog -based on the FCI above, determine on annual basis the total dollar amount of the deferred maintenance backlog of needed repairs to park features and facilities.
PARK MAINTENANCE
The performance measures in this division focus on asset management service levels and volunteerism.
• Maintenance Service Level Rating - measure by a criteria based field inspection how well parks are maintained. A goal of this survey is to determine if the public feels that parks are maintained to the service level assigned.
• Maintenance Management Plan Actual Hours - measure of how total actual park maintenance hours were expended on each park compared to the estimated hours identified in each park maintenance management plan.
• Preventative Maintenance Percentage – measure how much of the overall park maintenance work effort is preventative and not demand oriented. Basing a park maintenance system on a strong foundation of preventative maintenance will increase the useful life of facilities, which in turn, improves the overall FCI for the park system. This measure will be developed in 2016.
• Number of Volunteers - measure total volunteers working in parks.
• Volunteer Work Hours - measure the total hours of volunteer activity in parks.
• Special Events Supported by Parks Stewardship - measure the total number of special events park maintenance supports annually. This will include major city events like Harbor Days, as well as park stewardship events such as National Trails Day and Arbor Day.
• Total Parks Maintenance Expenditure/Acres of Park –measure on an annual basis, the cost of park maintenance on a per acre basis.
RECREATION
• New Activity Offerings-new courses divided by total courses. Tracking new activities is important to show that we are keeping up with trends and, indirectly, eliminating activities that are no longer relevant or exciting to our customers.
• Participant Repeat Rate-total of unique individuals registering for two consecutive years divided by total of first year unique individuals. Repeat rate is important to show the number of returning customers. Customer retention is less expensive than recruiting new customers and is an indicator of high quality programs.
• Activity Cancellation Rate-cancelled offerings divided by total offerings. This measurement shows whether or not we are offering enough options for our customers. A rate that is too high indicates too many, or not the right, offerings. A rate that is too low indicates we are not offering enough.
• Brochure: Participant Ratio-brochures distributed divided by total registrations. Knowing how many registrations are generated by the number of brochures distributed helps us determine if we are marketing to the right customers or potential customers.
• Cost Recovery Percentage-final revenue divided by final expenses. This figure helps us be less reliant on general fund resources and, in some circumstances, may be an avenue to help us create new low or no cost programs.
• Quality Rating-average rating by survey returns of activity participants.
• Customer Service Rating-average rating by survey returns of activity participants. Both the Quality Rating and Customer Service ratings are direct barometers relating to the experience that our actual customer receives. These are the only two subjective measurements but are important to our overall performance.
ARTS
• Artworks in Public Collection – Currently the number of works in the public collection stands at 100. This number increases by 3 to 4 new pieces each year. The number is not only a workload indicator for accession of new works but also maintenance, as an aging collection necessitates more annual and major upkeep each year.
• Condition reports on public art pieces that result in a positive rating - The goal is that 80% of the artworks examined yearly receive a good or better rating.
• Businesses and Artists Registered in Spring Arts Walk - This number can fluctuate from 115-130 and indicates an investment in the arts and downtown.
• Businesses and Artists Registered in Fall Arts Walk - This number can fluctuate from 85-95 and indicates an investment in the arts and downtown.
• Participants in Art Classes Offered by OPARD – Hours of participation by registrants in OPARD-offered classes in cooking, dance & music, and fine arts & crafts.
• Arts Digest Recipients – Currently at 944, this measurement indicates the number of engaged artists or arts supporters engaged and interested in our arts programs.
• Art Maintenance Hours – This measure indicates annual maintenance hours of the City’s public art collection.
FACILITIES
• Games Annually Scheduled on City Fields - measure the number of league games and tournaments scheduled on fields at Yauger, Stevens and LBA
• Community Use on Olympia School District (OSD) Fields – measure the number of hours OPARD schedules community use on OSD fields.
• Community Rental at The Olympia Center - measure the number of hours annually the community rents rooms at The Olympia Center.
• Transient Moorage at Percival Landing – measure the number of nights boaters moor at Percival Landing.
• Park Shelter Rentals - measure the number of hours that park shelters are reserved for picnics, weddings and educational programs.
• Harbor House Rentals - measure the number of hours the Harbor House at Percival Landing is rented by the community.
All of the above measurements are work load indicators that can also be used as a tool for maintenance prioritization, additions to inventory and determining our value to customers using each facility type.
OTHER KEY MEASURES
SAFETY AND SECURE INITIATIVE
• Encampments Removed from Park Property - measure total number of encampments posted for eviction in parks.
• Loose Needles Collected from Olympia Park Property - measure the total number of hypodermic found left in parks.
• Needles Collected from Sharps Containers – measure the total number of hypodermic needles collected from needle disposal containers.
• Verbal Notifications – measure the total number of verbal notifications given for code violations including illegal dumping and off-leash dogs.
• Encampment Notifications Served – measure the total number of notices served for illegal park encampments.
• Number of Encampments Removed – measure the total number of illegal encampments removed from parks.
• Number of Days Patrolled – measure the total number of days patrolled by the park ranger.
GRANTS AND DONATIONS
• Grant Applications Submitted - measure the number of grants applied for by OPARD. This will include grants to the state, county, or federal governments, as well as any other funding agencies whether public, tribal, corporate or non-profit.
• Grants Received - measure the number of actual grants received.
• Acres of Land Donated-measure the total number of acres of land donated and accepted into the Olympia park system inventory.
• Total Value of Grant Funds and Donations Received - measure the dollar amount of grant funds and donations received by the City for parks, arts and recreation facilities or activities.
In summary, the Department is now utilizing data collected through performance measurement to manage work and services in a manner that responds to customers. We can learn through the collections of certain information how to improve services and facilities to meet the changing needs of our community. Performance measurement is an investment building a common understanding of service delivery.
BUSINESS EVALUATION
Performance measures will become routine in OPARD. It will become evident that in doing the public’s business, OPARD will embrace data to provide an objective way of measuring progress.
As a companion to this business plan, staff will prepare a separate Business Performance Report to inform the community how well we performed. The Business Performance Report will be published annually and document the results of the performance measures listed above. It is hoped that by evaluating performance annually, it will lead to service efficiencies and improvements. This evaluation will also guide the preparation of operating and capital budgets which ultimately determine how the Department meets public expectations. This report will be shared with the general community, City Manager, Park and Recreation Advisory Committee and City Council to demonstrate the progress of the Department.
MORE INFORMATION
• Olympia’s Comprehensive Plan articulates our community’s values and vision for the future
• Olympia’s Capital Facilites Plan shows how park projects will be funded during a six year period
• For a complete list of all of Olympia’s parks and trails, see Parks and Trails
• For a comprehensive look at regional trail planning, see the Thurston Regional Trails Plan
• Information on the City’s Public Art Collection can be found at Public Art
• In 2007, the Arts Commission participated in an Arts Center Feasibilty Study
• The Municipal Art Plan lays out a 5 year horizon for public art
• To learn more about the City of Olympia’s recreational programs and classes, see Recreation