Chapter 10 Capital Facilities Plan
Both operations and maintenance and capital facility planning are fundamental to the infrastructure-dependent Wastewater Utility. The lift stations, pipes, maintenance holes and STEP systems that make up the wastewater infrastructure vary in age, materials and structural integrity. At some point in its life, infrastructure is best replaced or upgraded through the capital facilities planning process.
Ongoing work to systematically televise and evaluate the condition of the individual pipes helps prioritize repair and replacement needs. As needed, pipes can be repaired or replaced by City crews, or for more involved work, by contractors. Contractor work is typically funded through the City's Capital Facilities Plan (CFP). Pipe capacity upgrades lift stations rehabilitations, and sewer extensions to facilitate conversion of septic systems, also known as onsite sewage systems (OSS) to public sewer are also included in the CFP. These work efforts will continue in the years to come.
The projects contained in the CFP are funded annually through Utility rates and General Facilities Charges (GFCs). The Utility pursues bonds and Washington State-managed low interest loan and grant programs when needed and available. Chapter 11 details a financial strategy involving a combination of cash and debt financing of capital projects.
This chapter discusses programs and systems that characterize the condition of existing infrastructure, identify infrastructure deficiencies and prioritize capital projects for both a six and a 20-year planning horizon. The prioritized projects for both six and 20 years are summarized at the end of this chapter in the basic format of the CFP.
10.1 Physical Condition of the Gravity Sewer System
Assessing the condition of existing infrastructure is a necessary component of effective asset management and capital planning. The vast majority of the wastewater system consists of gravity sewer pipes and maintenance holes. Sewer pipes are televised using remote tractor-mounted cameras that travel through pipes and send video images to above-ground personnel. The video files are stored and evaluated at a later date.
The condition of gravity sewer pipes is assessed using the Pipeline Assessment and Certification Program (PACP) developed by the National Association of Sewer Service Companies (NASSCO), an accepted industry standard. Utility staff store and manage sewer pipeline video files and descriptive data using GraniteNet software from Cues, Inc.
The condition of gravity sewer pipes is assessed on an ongoing basis, using the following criteria:
• Pipeline integrity (physical structure, slope and alignment).
• Inflow and infiltration (inflow of stormwater from catch basins and roof drains, and infiltration of groundwater through pipe and maintenance hole leaks).
• Operating efficiency (extent to which the system operates as designed with minimal input of energy or operation and maintenance).
• Potential for illicit cross connections (discharges to stormwater pipes and surface waters)
• Risk and vulnerability (effect of potential failure on public or environmental health).
The Utility began ongoing condition assessment work in July 2005. In 2006, staff estimated it would take six years to complete an initial detailed assessment of the 185 miles of gravity sewer pipes. The Utility has completed the initial assessment of the gravity sewer pipes and are implementing a re-inspection program for the highest risk pipes and those in the worst condition.
In partnership with the LOTT Clean Water Alliance (LOTT), computerized flow monitors are installed in key pipes in order to track flows over time. The data provides information on wastewater, also known as sewage, flows as well as inflow and infiltration and operating efficiency. Lift stations are monitored continuously through the Utility’s supervisory control and data acquisition (SCADA) system.
The general characteristics of the sewer pipes are summarized as follows.
Pipeline Integrity
Due to the full implementation of PACP-based video pipe inspections since 2005, the structural integrity of the sewer pipe network is now well-understood. Approximately 30 percent of the gravity sewer pipes were installed prior to 1970 and are near or past their 50-year design life. The likelihood of leaks due to settlement, deterioration, sediment accumulation and root intrusion may increase over time in these pipes. About 3% of the gravity sewer pipes have been lined, extending their design life.
The concrete and asbestos cement pipes that were widely used during this period are susceptible to corrosion and deterioration from hydrogen sulfide gas, such as that produced by STEP systems. Several acute corrosion problems related to STEP systems have been identified over the years and addressed with maintenance hole and concrete pipe liner projects. Several additional projects to address corrosion are needed and are included in this Plan.
The pipe condition assessment indicates the following:
• 81% of the pipes are in good condition
• 13% are in fair condition
• 5% are in poor condition
• 1% remain to be inspected. Many of these pipes are relatively new and are assumed to be in good condition.
These data suggest that the gravity sewer system is in manageably good condition. The pipe re-inspection program indicates that pipes are deteriorating at a slow rate. Significant changes in pipes with repeat inspections have not been observed over the last twelve years. Repairs can be completed proactively in order to avoid costly and/or extensive emergency repairs. Often times, repairs are needed to only a small section of the pipe. Repairs to problematic pipes are completed by in-house or contractor crews. With planning, cost-effective trenchless repair technology is the preferred choice for repairs. With this technology, an epoxy impregnated sock is pulled through the faulty pipe, expanded to meet the sides of the pipe and cured in-place. The pipe is repaired at a fraction of the cost of pipe excavation and subsequent street reconstruction.
The pipe televising and condition rating program indicates that needed pipe replacements and repairs can be addressed proactively and at manageable costs.
Pipe inspections and condition rating are a key work element of the Utility. Operations and maintenance crews in concert with engineering staff provide dedicated resources for pipe cleaning and inspection.
Inflow and Infiltration
Inflow and infiltration (I&I) mainly occur in combined storm/sanitary pipes in the downtown, South Capitol neighborhood and portions of northeast and west Olympia and in older faulty pipes. Inflow is precipitation that enters sewer pipe mainly from catch basins within the roadway and roof downspouts. Infiltration results from groundwater entering sewer pipes through cracks, bad joints, or leaky maintenance holes. These inputs of storm and groundwater can result in significant excess flows and surcharging of the pipes during the wet season. On rare occasions, surcharges during large storms can extend above the maintenance hole rim with wastewater discharging to the street.
The Utility reduced I&I in the 1990s through several extensive pipe replacement projects in West Olympia. The work was undertaken as part of an agreement with LOTT that addressed wet season flow reduction.
Currently, flow monitoring at most of the lift stations tracks seasonal variations in pipe flows. LOTT's Budd Inlet Treatment Plant can typically handle the high flows generated during wet weather events. In the future, wet weather flows due to infiltration may decrease as pipes and maintenance holes are rehabilitated through the condition rating program. Additionally, combined pipes responsible for inflow are separated as feasible and cost effective. The Utility is adequately managing I&I.
Operating Efficiency
Older areas of the City with smaller diameter pipe, separated joints and other challenges can require more frequent maintenance, particularly pipe cleaning and root control. These areas are identified through periodic review of the work order system and the scheduled maintenance program. In recent years, high frequency maintenance has consumed approximately 5% of operation and maintenance resources on an annual basis.
On a case-by-case basis, the cost of increased maintenance needs is compared to the cost of rehabilitation or reconstruction of aging or inadequate infrastructure. For example, one well-known high maintenance area-the South Capitol neighborhood-is being adequately served by careful flow evaluation, extra maintenance, and isolated, small-scale rehabilitation projects. This highly managed approach to capacity limitations is cost effective, given the high costs of extensive rehabilitation / reconstruction. Other localized areas of high maintenance in Olympia are best served, however, by reconstruction. Depending upon the scale of the work effort, construction projects are completed in-house or by contractors through capital facilities funding.
Accumulation of fats, oils, and grease (FOG) in sewer pipes, primarily from food service establishments, is also a maintenance problem. Accumulation of grease can clog pipes, reduce operating capacity and result in sewer overflows. Proper restaurant procedures for managing FOG onsite can prevent this problem. LOTT and the City provide educational materials to restaurant owners and issue citations for grease containment violations. A rigorous program to enforce grease abatement, including the enforcement of existing pretreatment regulations in OMC 13.20, is well underway.
Illicit Cross Connections
The Wastewater Utility partners with the City Storm and Surface Water Utility to actively inspect their pipe systems for unintentional cross-connections. Improperly constructed pipes and maintenance holes can result in ongoing discharges of wastewater to the stormwater system. The wastewater and stormwater systems have been evaluated for design features that are correlated with cross-connections such as pipes in close proximity to each other, unclear construction blueprints, and sewer pipes passing through stormwater pipes. Potential problem areas have been field investigated. In recent years, inspections have revealed one or two of these cross connections per year, especially in older areas of the City.
Other areas that may be susceptible to unintentional cross-connection during future construction have been flagged on utility maps. These work efforts and the coordination between Wastewater and Storm and Surface Water Utilities will continue.
Risk
Structural failures in wastewater pipes can result in sewer overflows impacting public and environmental health. Evaluation of the sewer pipe network has focused on improving older pipes susceptible to problems. Additionally, ensuring the non-stop operation of lift stations is a program priority (see below).
Given the current knowledge of pipe and lift station condition, the risk of infrastructure failure is modest. High risk infrastructure is well-managed. Systems in close proximity to surface waters are prioritized. However, the extensive scale of the wastewater system suggests that failures will occur. Utility staff plan for emergency response to failures thereby minimizing impacts.
Summary of Sewer Pipe Condition
Overall, the sewer pipe network is well-understood and in manageable condition. Future work can focus on proactive maintenance and timely repairs. Results suggest the need for ongoing scheduled repairs, but not catastrophic failure or unanticipated expenditures. Operation and maintenance resources may need to be augmented as the City grows and the infrastructure continues to age.
10.2 Capacity Analysis of the Gravity Sewer System
City staff, with the help of consulting engineers, analyzed the capacity of wastewater infrastructure, principally pipes and pumps. Capacity limitations in the gravity sewer system may develop for several reasons:
• New development “upstream” may increase demand on existing “downstream” pipes and pumps,
• Pipes may have been designed, usually many years ago, smaller than they should have been, or
• Pipes may receive excess flows due to I&I.
A computer model was constructed to simulate sewer flows throughout the city. The sewer model includes approximately 60 miles of pipe, 1,372 maintenance holes and 24 pump stations. The model was designed to simulate a 10-year peak hour storm event and estimates wastewater flows based on the current and projected population, land use and I&I entering the system.
Flow calculations and the associated computer simulations were calibrated based on actual data collected at the LOTT Budd Inlet Treatment Plant and over 30 flow monitoring locations spread throughout the LOTT service area. See Appendix L for a description of the model and methodology used.
The model identified areas of the system currently over capacity or projected to be over capacity by the year 2050, projected buildout for the City. In general, future conditions mirror those currently observed, except that several of the large LOTT interceptors begin to experience capacity limitations. These include the Indian Creek Interceptor, the State Street Interceptor, and the Martin Way Interceptor. LOTT has plans to address these limitations in its capital program.
Capacity Limitations
The model helps us understand potential capacity limitations that might occur within this Plan's 20-year planning horizon. Population growth is based on projections from the Thurston Regional Planning Council. In general, sewer capacity limitations are driven by existing I&I. Future population growth tends to contribute far less peak flow to the system than is generated through I&I, particularly in portions of the conveyance system with combined sewers.
Figure 10.1 shows locations predicted to have some risk of flooding.
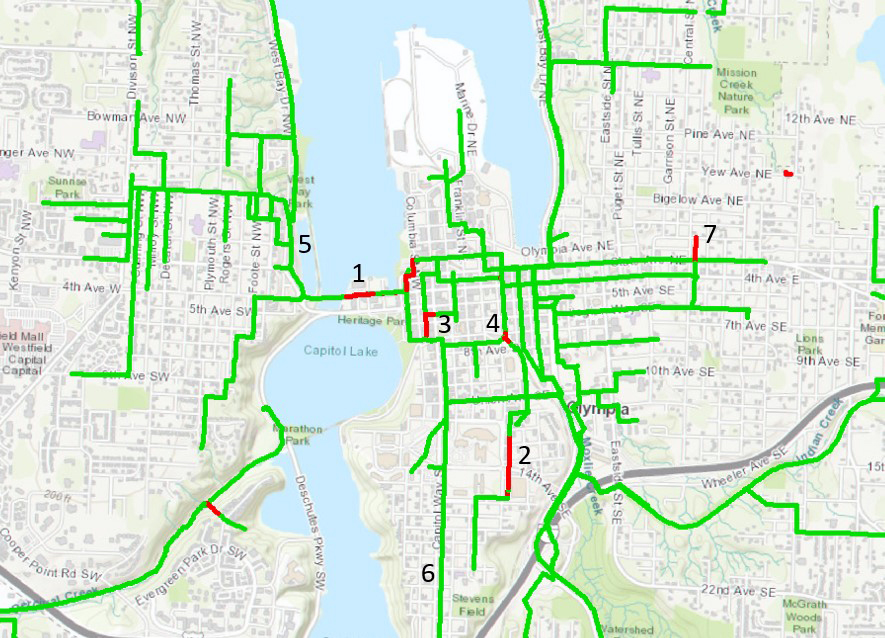
View Figure 10.1 Areas with risk of flooding under peak hour conditions for a 10-year storm.
Seven areas with anticipated risk of flooding are shown on Figure 10.1 These locations are prioritized into four tiers, based upon risk of flooding and confidence in the projections.
Tier 1. High risk of flooding and high confidence in projections (plan for action within 10 years):
1. The 4th Avenue bridge. Flow from the west side of Olympia is conveyed across the bridge via an 18” diameter sewer. On the east side of the bridge, flow splits between the 18” main line and a 15” overflow line. Both the 18” and 15” pipelines are projected to backup and flood under the modeled conditions due to limited capacity in these pipes and high I&I.
2. Jefferson Street SE (Phase 1). This pipeline conveys flow generated between Stevens Field and Union Avenue, including a large amount of combined storm flow. This pipeline has limited capacity to convey high flows because it is only 10-inches in diameter. Several bottlenecks were identified, along the 1100 to 1500 blocks of Jefferson Street, the 500 block of 11th Avenue and the 1000 block of Cherry Street, that result in predicted backups and risk of maintenance hole flooding.
Tier 2. Moderate risk of flooding, less confidence in data (monitoring with near-term remediation):
3. Columbia Street. A large amount of combined storm flow enters the sewer in this part of downtown Olympia. The Columbia Street sewer, a 12-inch diameter pipe with relatively flat slope, can cause a bottleneck at peak flows. Much of this pipeline is buried deep; however, the upstream portion is relatively shallow, with only 2-3 feet of cover, posing a risk of flooding.
4. Jefferson Street SE (Phase 2). Flow generated between Capitol Way and the railroad, north of Union Avenue, is conveyed north along Jefferson Street. Much of the pipeline in the 600 and 700 blocks of Jefferson is 12-inch diameter and relatively flat. The high storm flows generated in the combined sewer system in this area lead to a risk of flooding along the railroad near 7th Avenue.
Tier 3. Risk of basement flooding, high confidence in data (long-range monitoring):
5. West Bay Drive. A series of pipelines converge along West Bay Drive, conveying flow to the 4th Avenue Bridge. A relatively flat section of pipe acts as a bottleneck, causing backups as far north as Jackson Avenue. The pipe is deep enough that the risk of maintenance hole flooding is low, but some risk of lateral and basement flooding is predicted in this area.
6. South Capitol. A large amount of storm-related combined flow is generated in this basin and conveyed north along Capitol Way through a 10-inch diameter pipe. The pipe slope is relatively flat south of 19th Avenue, limiting capacity and creating a bottleneck. The pipe is deep enough that the risk of maintenance hole flooding is low, but some risk of lateral and basement flooding is predicted in this area.
Tier 4. Moderate risk of flooding, low confidence in data (long-range monitoring):
7. Central Avenue. The model projects a risk of flooding in this pipeline. However, actual flows at this location are unknown because the contributing basin has not been actively monitored. Future flow monitoring of this basin will determine whether model projections are accurate.
Tier 1 issues will be addressed in the near-term through capacity upgrade projects. Tier 2 issues will require further monitoring, but the Utility will budget for near-term remediation. Tier 3 and 4 issues will require long-range monitoring and be revisited in the next plan update.
10.3 Condition Assessment of Lift Stations and Force Mains
Table 3.2 in Chapter 3 shows the age, type, and upgrade/replacement project date (if applicable) of the 31 City owned lift stations. Typical problems include aging electrical, mechanical, and performance monitoring systems.
This Plan presents the Utility’s current vision of capital projects planned for a 20-year horizon. In 2018, the Utility hired a consultant to perform survey-level condition assessments of 16 priority lift stations with input from operations staff in order to develop planning level cost estimates for needed lift station upgrade projects and associated force main replacements, as applicable.
The stations identified as priorities in the next six years include:
• Old Port 1 (and force main)
• Miller and Central (and force main)
• Miller and Ann
• Rossmoor (and force main)
• Old Port 2 (and force main)
• Roosevelt and Yew (and force main)
Upgrades to the identified lift stations consistent with the schedule provided in Table 10.2 are expected to minimize risks for acute or chronic failure.
Of the 9.5 miles of force mains, 20 percent are constructed with older materials – concrete or asbestos cement (AC). The remaining 80 percent are constructed with more durable PVC or HDPE pipe. The Utility plans to replace concrete and AC force mains in conjunction with lift station upgrade projects as appropriate. Untimely failure of these force mains is not anticipated.
10.4 Capacity Analysis of Lift Stations and Force Mains
The Utility has evaluated the capacity of its lift stations against current and anticipated future demands. No current capacity deficiencies have been identified. Design of lift station upgrades will account for anticipated future demands based on the latest development projections.
The land use build out projections and associated lift station demands assume that the City and its Urban Growth Area (UGA) are allowed to develop to a maximum reasonable population density of eight ERUs per acre.
10.5 Condition Assessment of the STEP Systems
All STEP systems in Olympia have been installed in the past 30 years and have a life expectancy of at least 40 years. Since all STEP system pipes are made with PVC materials, problems with pipeline integrity are unlikely in the near future. Infiltration is also unlikely, since STEP systems are tightly sealed and pressurized, and installed using modern construction techniques.
STEP tanks, however, which are typically constructed of concrete, may over time develop structural issues related to corrosion. Hydrogen sulfide gas produced by STEP effluent is corrosive to concrete. While no active evaluation of the condition of existing tanks has been completed, there have been no documented structural failures of STEP tanks.
Similarly, STEP system pumps have been shown to last 20 or more years, with at most replacement of moving parts during regularly scheduled O&M service. However, given the large number of STEP systems installed in the last 20 years, it is anticipated that the Utility will be replacing STEP pumps at an increased frequency during the 20 year planning horizon. This investment is reflected in the capital facilities planning presented in this Plan. In general, STEP systems are currently performing adequately.
Commercial STEP systems requiring considerable City maintenance will continue to be a priority for conversion to gravity sewer service. These conversion projects will be prioritized as they become feasible.
10.6 Major Sewer Extensions
Major extensions of sewer infrastructure will be needed to serve outlying areas of Olympia and its UGA. These projects are typically prompted by new development and therefore anticipated to be completed with private funding. As discussed under Strategy 1B3 in Chapter 9, the City is exploring options to encourage construction of regional sewer infrastructure in areas where development densities may not favor development-driven infrastructure projects, such as the South Bay Road and the Chambers extensions. Sewer extensions associated with transportation improvements may occur within the 20-year planning period of this Plan; these projects are authorized and managed by the Utility through the capital facility program. A figure showing locations of anticipated sewer extensions and associated lift stations is located in Appendix J.
10.7 Summary
Based on the Condition and Capacity Assessments completed for the various types of wastewater infrastructure, needed projects are identified for funding in the next 20 years. The projects are summarized in Tables 10.1 - 10.5 below utilizing the funding categories currently used in the Capital Facility Plan (CFP).
The list of projects is tentative. It will be evaluated and refined during annual capital facility planning processes. However, it provides a projection of likely projects and their potential funding requirements. Many of the projects are proactive in nature. A discussion of funding of these projects, including whether a project is entirely or partially funded by rates and/or General Facility Charges, is included in Chapter 11.
|
No. |
Project Name |
Description |
Cost ($K) |
Timing |
|---|---|---|---|---|
|
1 |
Prioritized Repairs |
Major repairs using trenchless technologies |
$593 |
Annual |
|
2 |
Spot Repairs |
Minor open-cut repair work |
$134 |
Annual |
|
3 |
Maintenance hole Repair and Replacement |
Repairs of structural deficiencies and leaks |
$134 |
Every 3 years |
|
4 |
Side Sewer Repairs |
Repairs of City-owned laterals in right of way |
$30 |
Annual |
|
5 |
STEP Rehabilitation Equipment |
Replacement of STEP system equipment |
$233 |
Annual |
|
No. |
Project Name |
Description |
Cost ($K) |
Timing |
|---|---|---|---|---|
|
6 |
Old Port 1 LS Construction |
Upgrade station and install new force main |
$1,145 |
2020 |
|
7 |
Miller and Central LS Construction |
Upgrade station and install new force main |
$940 |
2020 |
|
8 |
Miller and Ann LS Design |
Design upgrades to lift station |
$110 |
2020 |
|
9 |
Miller and Ann LS Construction |
Upgrade station |
$455 |
2021 |
|
10 |
Rossmoor LS Design |
Design station upgrades and new force main |
$228 |
2021 |
|
11 |
Rossmoor LS Construction |
Upgrade station and install new force main |
$948 |
2022 |
|
12 |
Old Port 2 LS Design |
Design station upgrades and new force main |
$354 |
2023 |
|
13 |
Old Port 2 LS Construction |
Upgrade station and install new force main |
$1,475 |
2024 |
|
14 |
Roosevelt and Yew LS Design |
Design station upgrades and new force main |
$292 |
2025 |
|
No. |
Project Name |
Description |
Cost ($K) |
Timing |
|---|---|---|---|---|
|
15 |
Neighborhood Sewer Extensions |
Extension of public sewer into neighborhoods |
$426 |
Annual |
Table 10.4 Summary Table of Wastewater Projects for 2020 - 2029
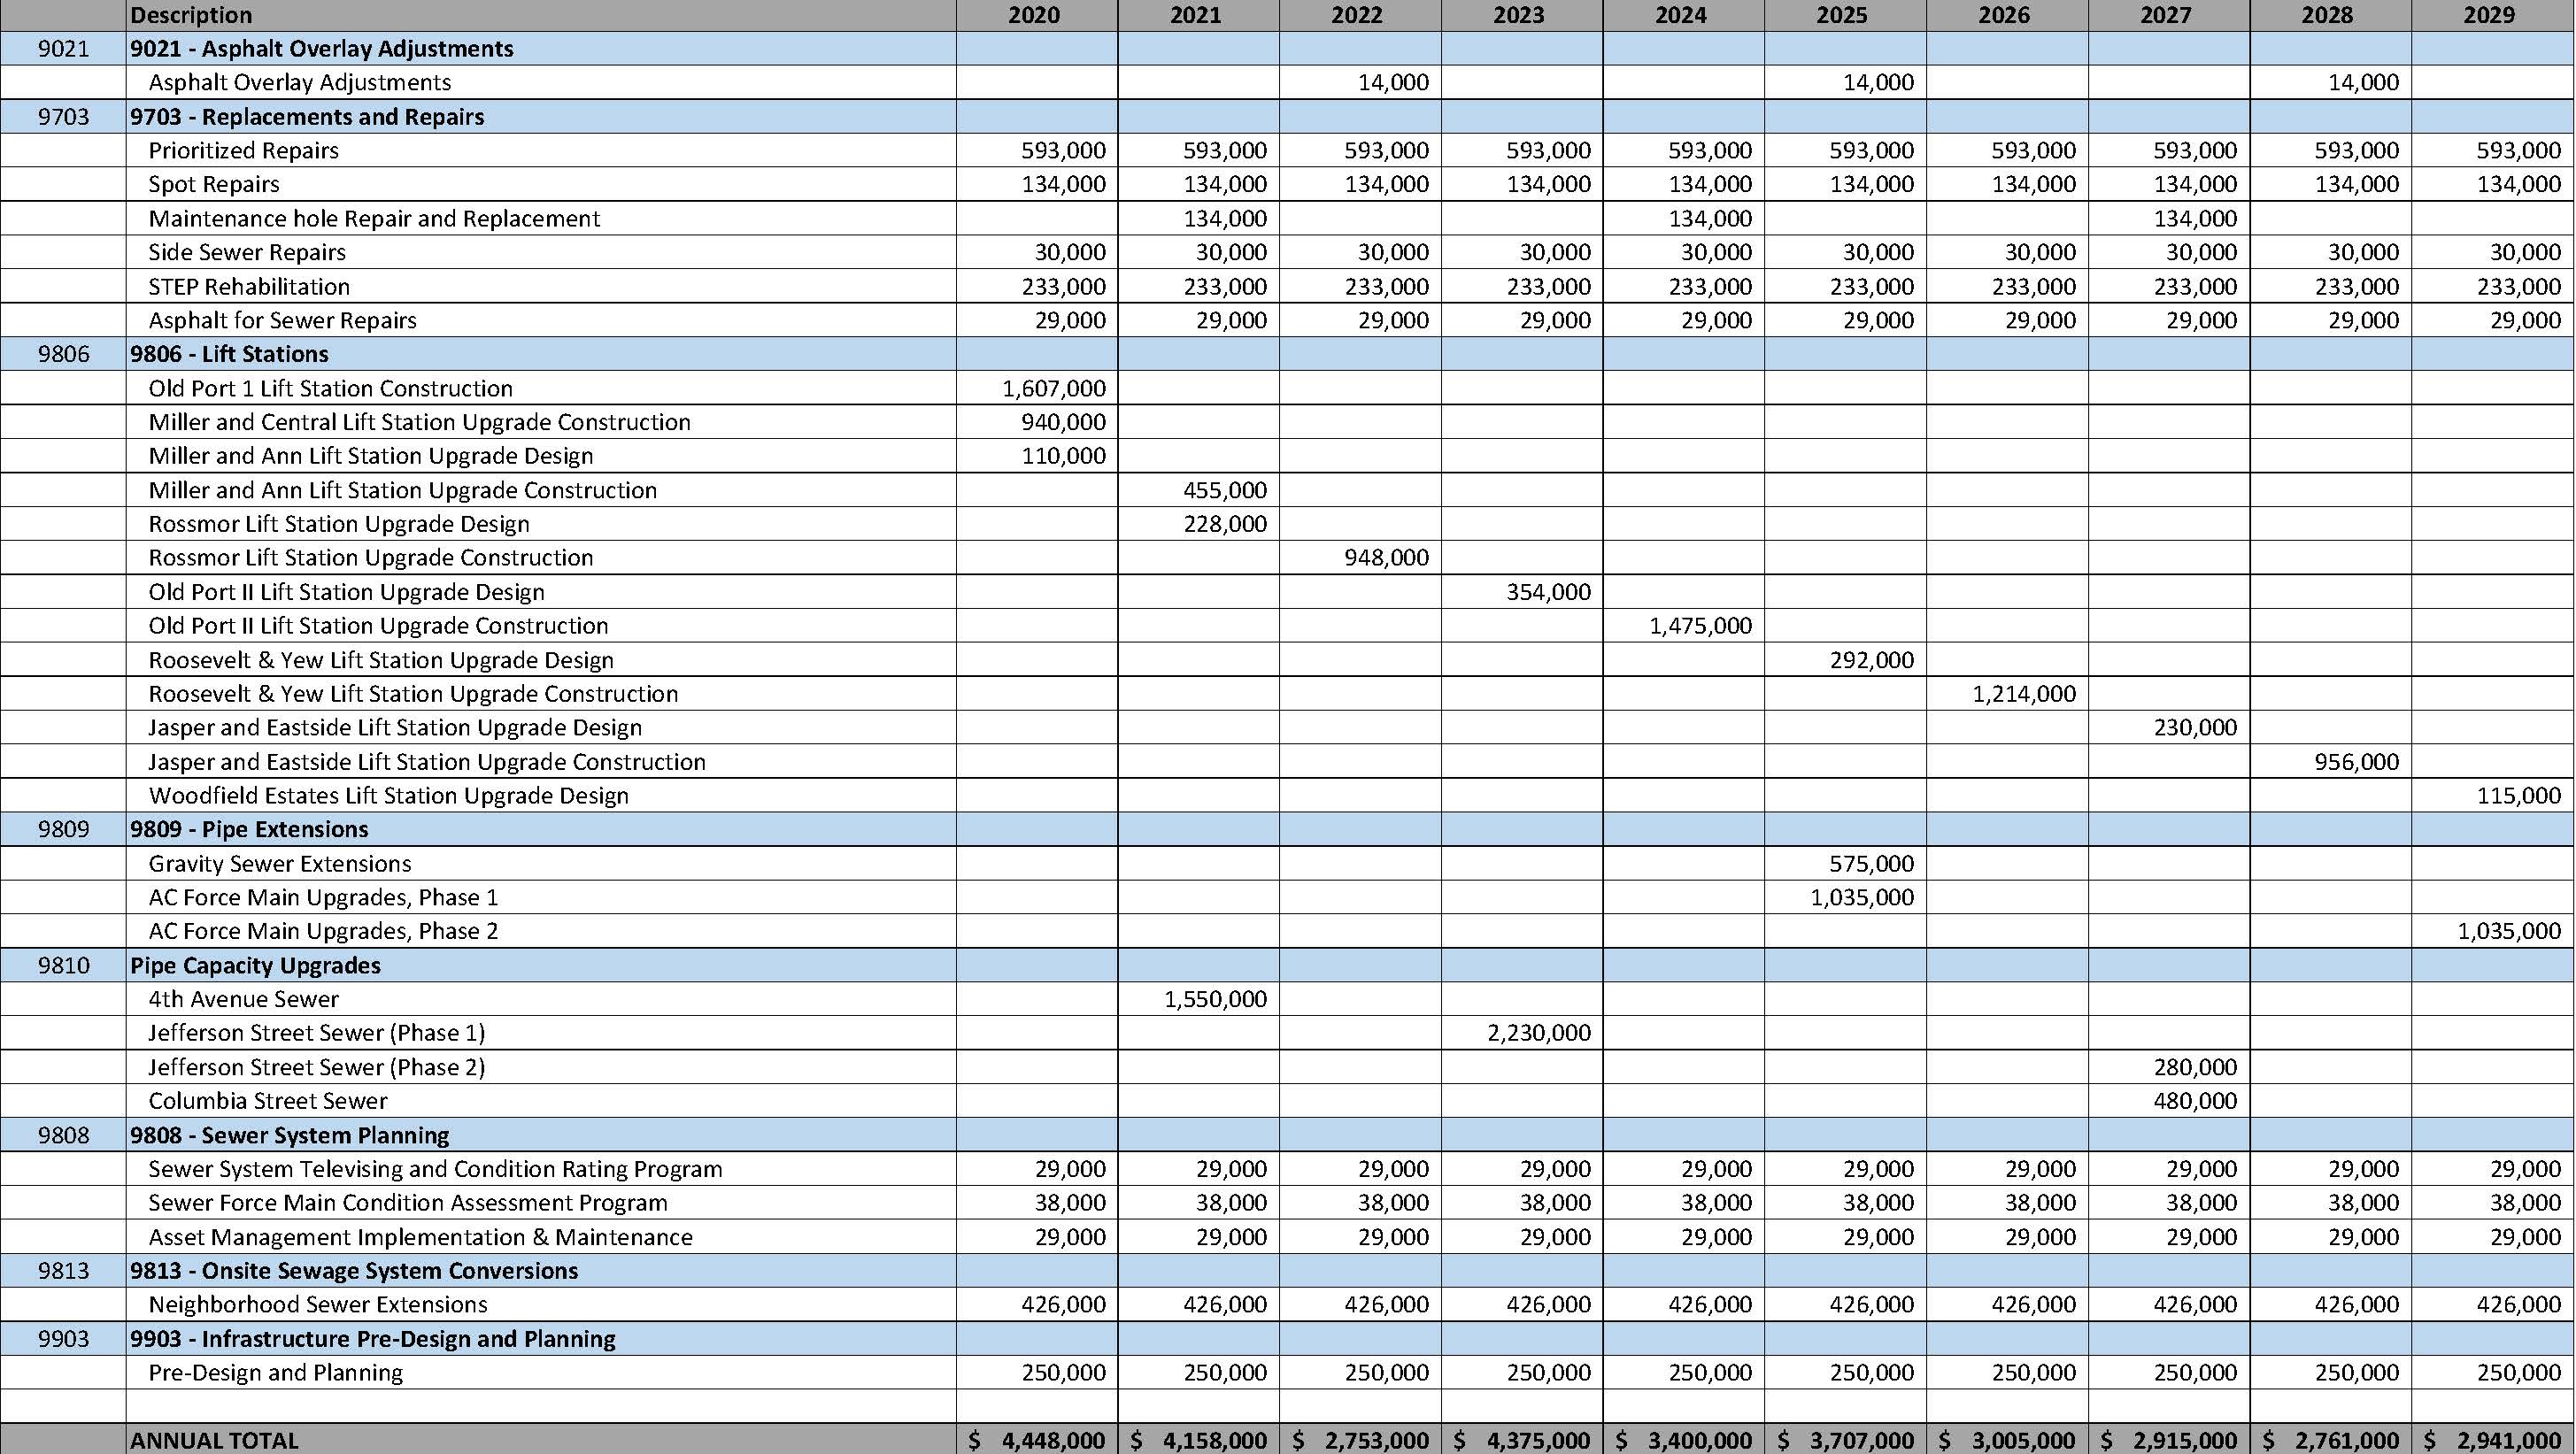
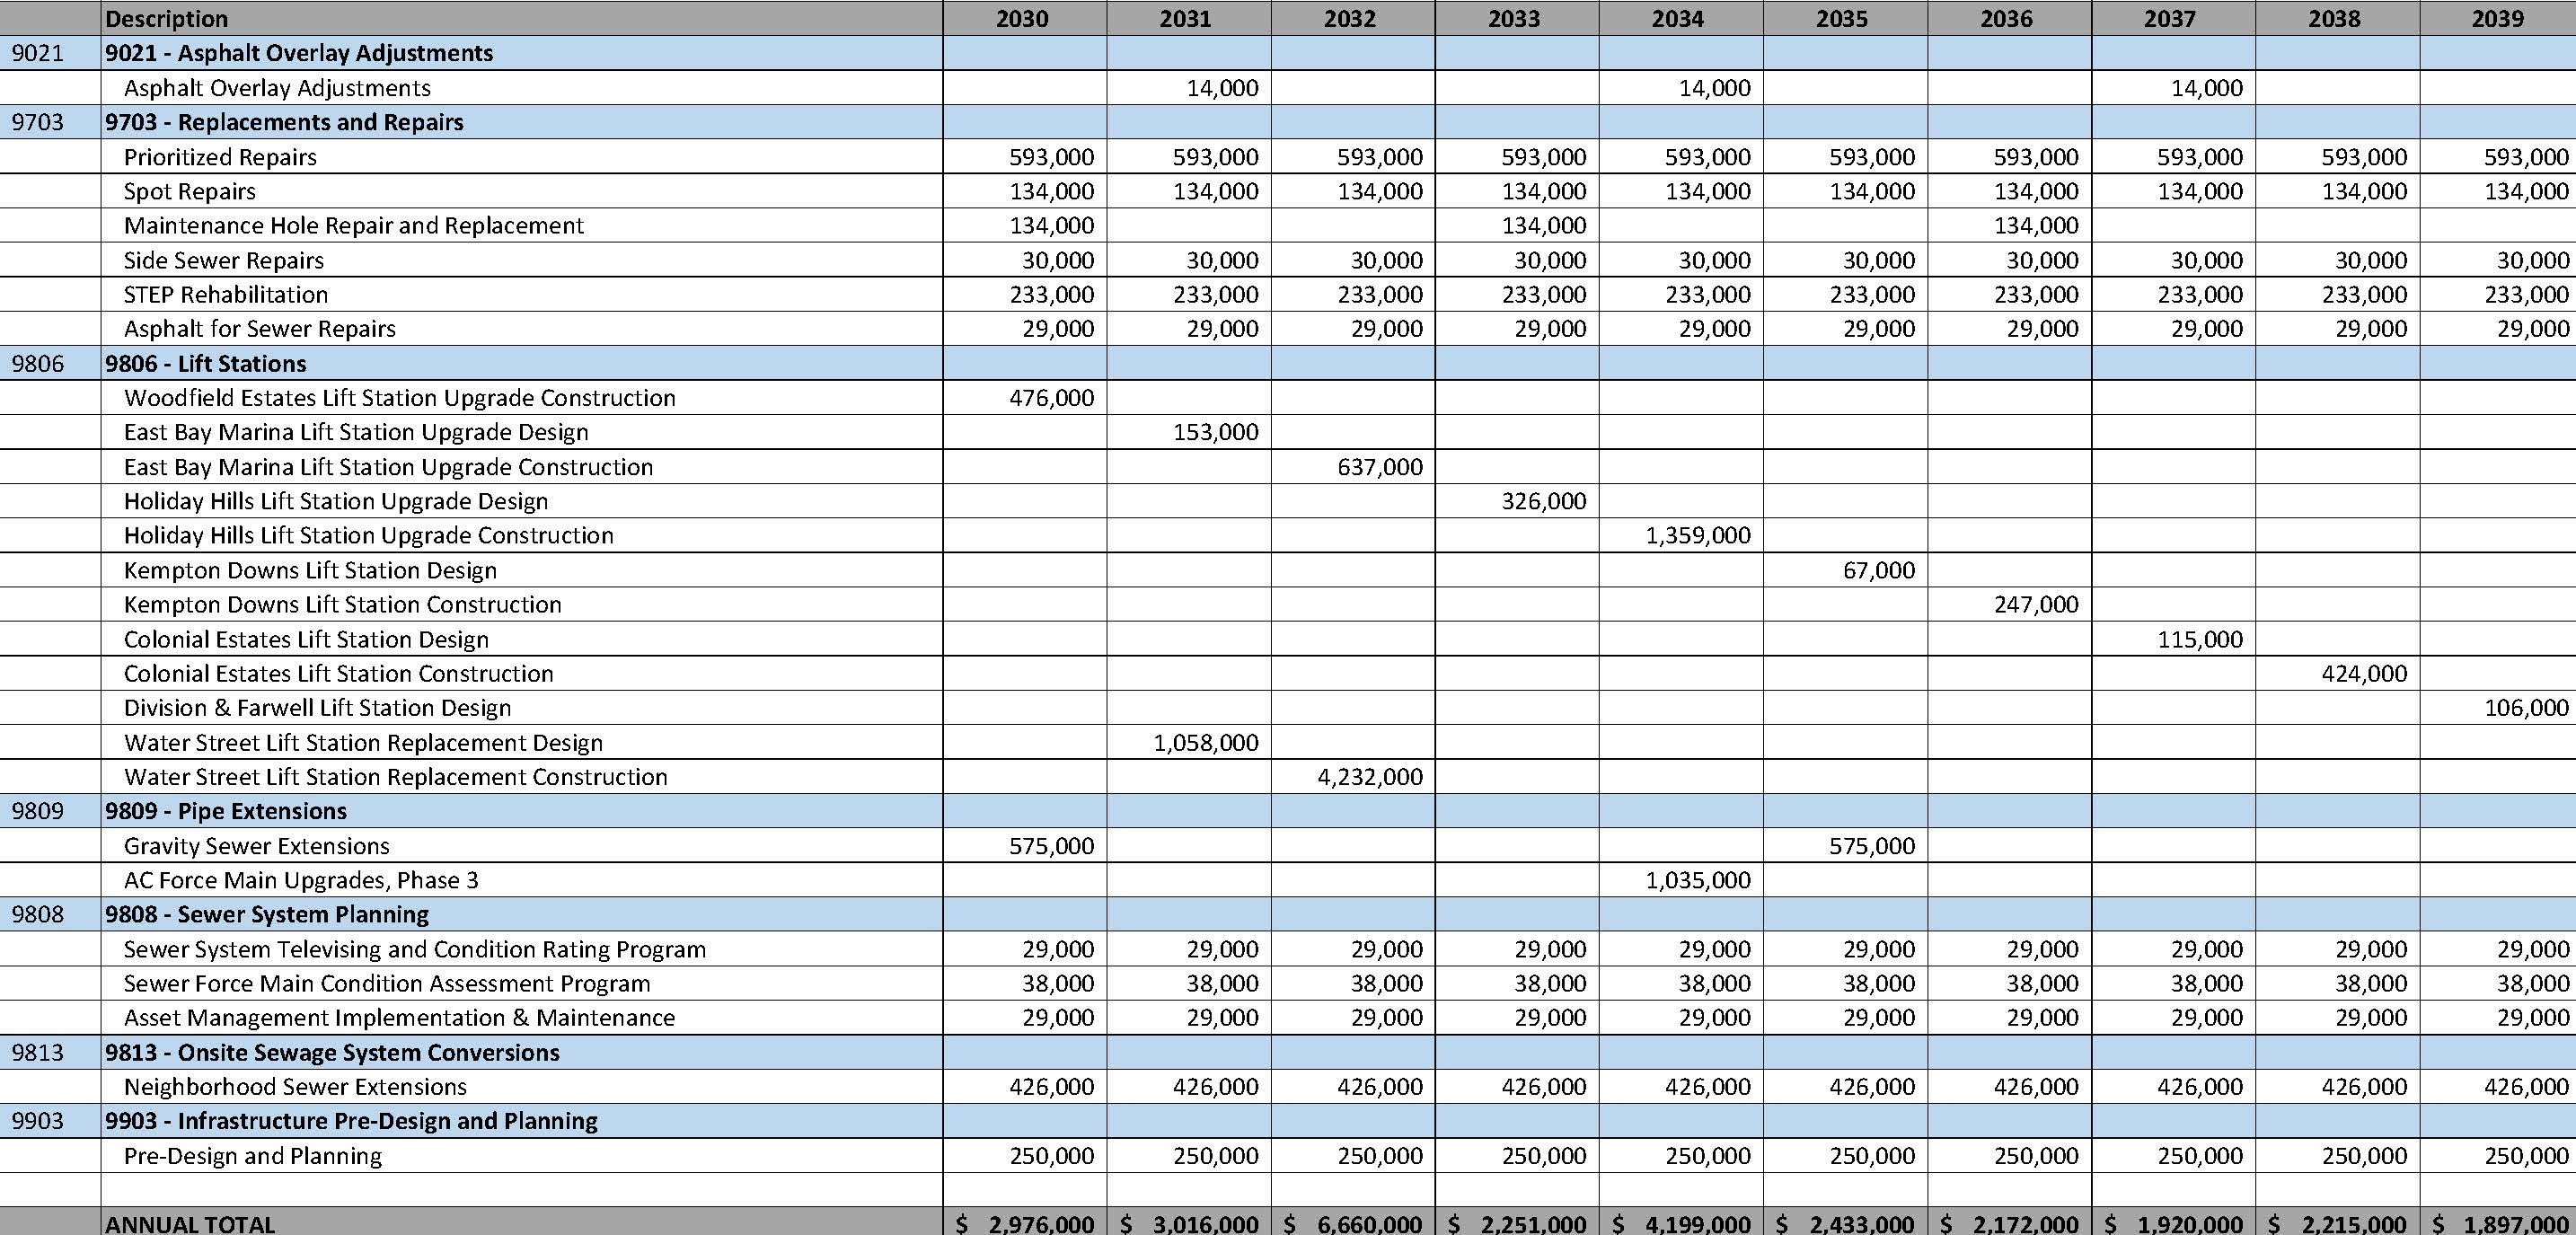
Table 10.5 Summary Table of Wastewater Projects for 2030 - 2039