


Chapter 3 – Olympia’s People and Their Waste
This chapter describes trends in population and land use that affect the City’s ability to reduce waste, increase recycling and composting, and manage collection services efficiently. It also presents basic facts and trends about waste generated by Olympia residents and businesses, and opportunities for diverting more recyclable and compostable materials from the landfill.
Population and Customers
Waste ReSources provides municipal garbage and recycling collection services to nearly all areas within city limits. When the City annexes new areas, it provides the current private collection companies a transition period of up to 10 years before beginning municipal collection. Figure 7 shows the city limits with annexed areas and the respective dates the Utility will assume solid waste collection. The City annexed 270 housing units in 2013 and 2014, which will start receiving city-provided collection in 2023 and 2024, respectively. The City has conducted a feasibility study of annexing a large urban growth area in southeast Olympia that contains about 3,200 households. If this area is annexed in the future, Waste ReSources will need to begin planning to add staff and trucks to accommodate expansion.
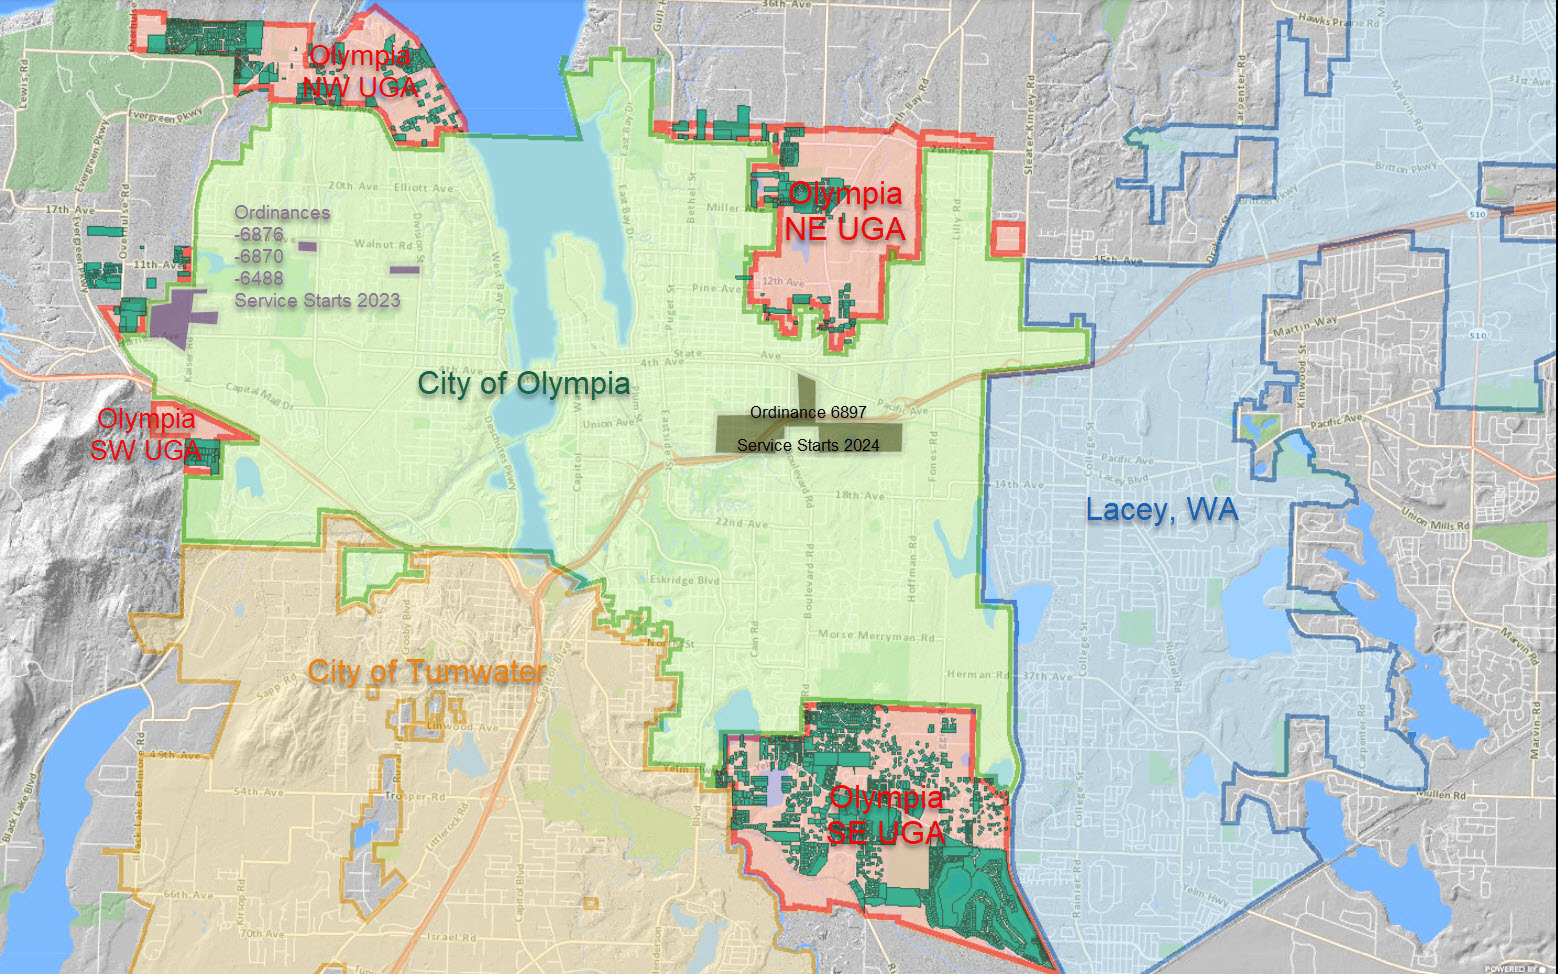
View Figure 7 City’s Collection Boundaries
Between 2010 and 2020, population within the city grew by almost 17%, from 46,500 to 54,200 — an annual growth rate of about 1.5%. The Thurston Regional Planning Council (TRPC) projects the same growth rate for 2020 to 2030 with an estimated population of 63,000 by 2030. While TRPC projects slower natural growth in the following decade, annexing the SE UGA would increase growth substantially.
Growing Customer Base
Providing high-quality service to customers is a priority for Waste ReSources. The Utility provides garbage, recycling, and yard waste collection services, generally within the incorporated city limits. Through programs independent from the City, private companies also collect recyclables from businesses. The four major customer classes, each with a separate rate structure, are listed below:
1. Large-volume waste generators for whom it is cost-effective to use a large container such as a drop box or compactor, either occasionally and short-term or frequently and long-term.
2. Single-family and smaller multifamily residents who need frequent collection of relatively small volumes.
3. Businesses and larger multifamily properties that need frequent collection of small, moderate, and large volumes.
4. Organics customers who generate regular, small, and moderate volumes.
As population increases, a corresponding increase in Utility customers and waste generation can be expected. Overall, the number of single-family and smaller multifamily housing units served by residential side-load trucks is projected to increase by about 26% in 2020–2030. The number of units served will increase by nearly 14% in the following decade due to natural growth and by potential annexation of 3,200 housing units in the next few years. The number of larger multifamily housing units served by commercial trucks is projected to increase 24% in 2020–2030 and by 14% in the following decade from natural growth. Projected growth in population and number of households is shown in Figure 8.
Future annexations are expected to add a substantial number of new single-family customers in decades to come. The Utility will need to set aside funds for additional trucks, containers, and staff to serve these new customers.
Growth in the commercial sector is more difficult to predict due to lack of historical data and the fact that businesses turnover. Commercial growth is assumed to follow somewhat closely with employment trends projected by TRPC on a percentage basis, or about 1% per year for total growth rate of about 23% between 2020 and 2040.
Based on these projections, this Plan assumes approximately 4,300 new single-family residential customers will request garbage and recycling service from Waste ReSources by 2030 compared to 2020 and another 2,900 customers by 2040. These projections do not include anticipated annexations. In addition, Olympia anticipates gaining 2,200 multifamily housing units between 2020 and 2030, plus another 1,500 units between 2030 and 2040 (Appendix 1). With ongoing route balancing and efficiencies, such as one-side road collection and the every-other-week collection for single-family residential customers, Waste ReSources has been able to absorb increases over the past six years. This Plan assumes the Utility can continue to absorb customer increase with the same number of collection personnel and vehicles for the next two years at the most. If organics were bundled with garbage service, one to two additional trucks and drivers would be needed (Appendix 4).
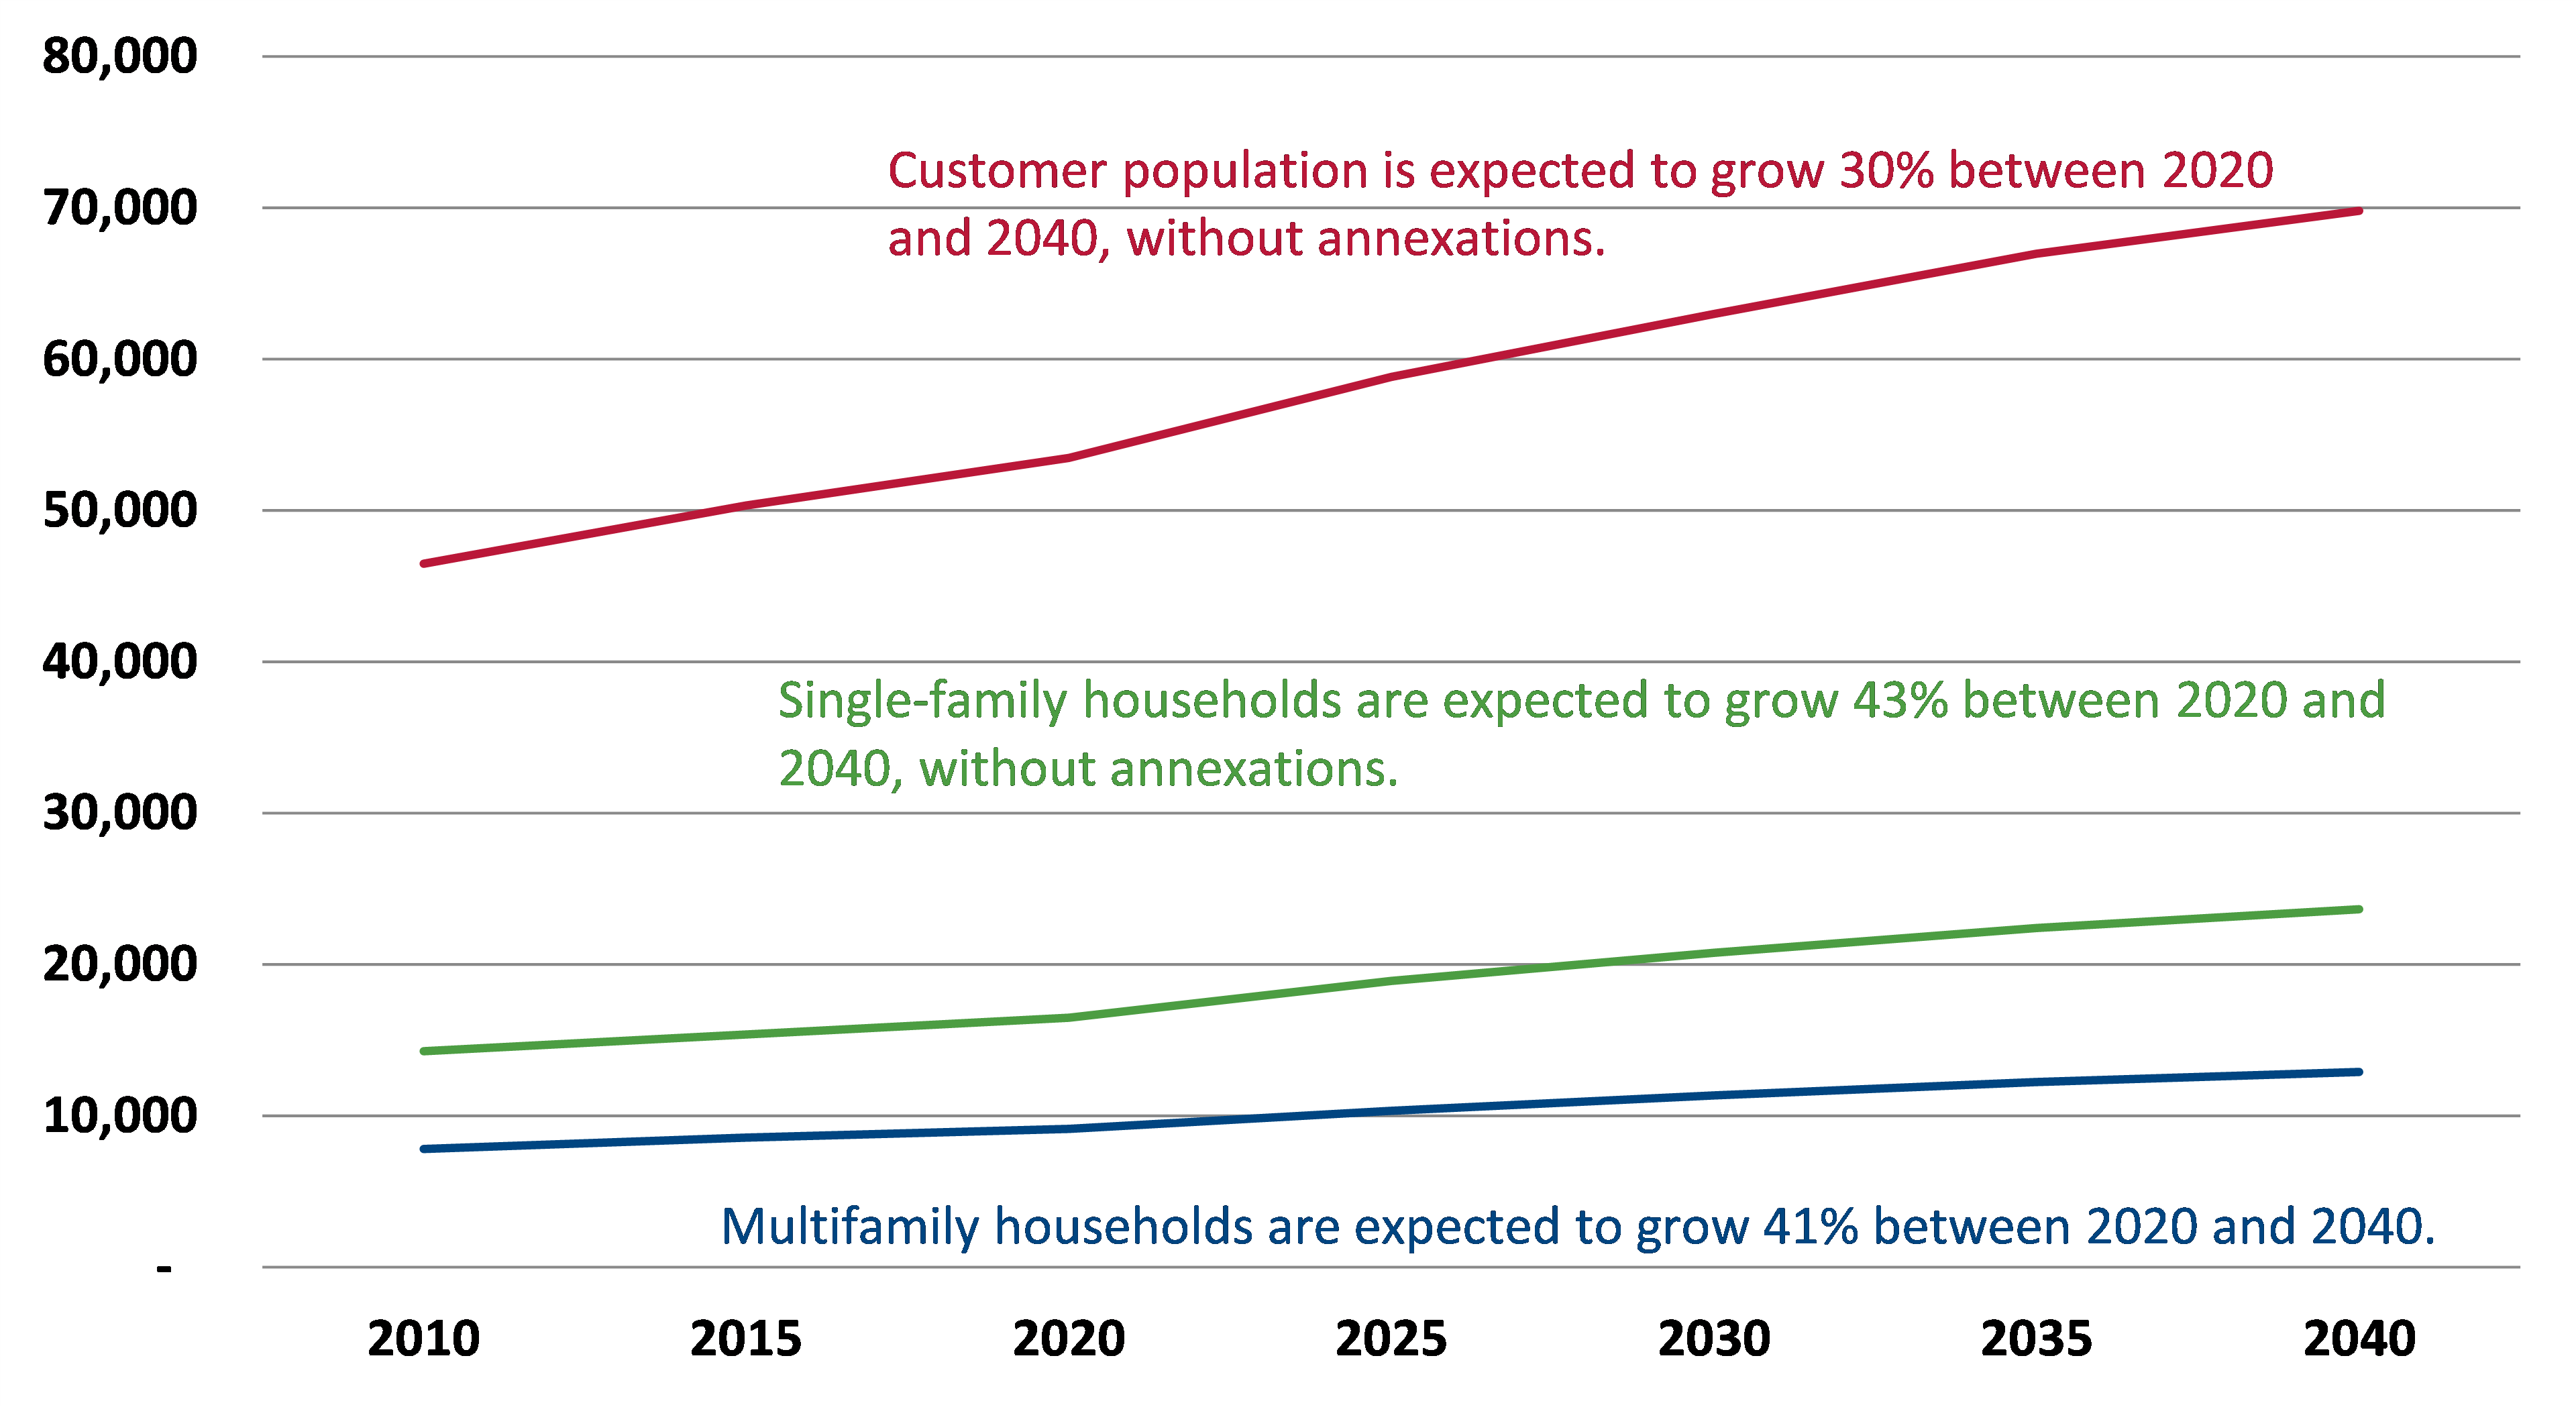
View Figure 8 Population and Number of Households, 2015 to 2040
Demographics
According to TRPC’s most recent data (2021), over 84% of Thurston County’s population growth can be attributed to migration from other areas. Employment stability, lower housing costs, and lower density are considered the main attractions.1
People aged 65 and older make up 18% of the current population and a growing segment of the county’s population. People in this age group are more likely than others to live on fixed incomes and are considered relatively sensitive to cost increases.
Language is an important consideration when developing programs and outreach materials. About 14% of Olympia households speak a language other than English at home. A small portion (2.4%) are linguistically isolated, meaning no one in the household older than 14 speaks English at all or very well. Spoken languages include Asian and Pacific Island (7%), Spanish (4%), other Indo-European (1%) and other (0.05%).
Most residents of Olympia identify as Non-Hispanic White (74%). Nearly 10% of the city population identifies as Hispanic, while 7.6% identify as Asian and 2.8% identify as Black. Furthermore, 1% of Olympians identify as American Indian or Alaskan Native and 6.4% identify as two or more races.
Employment
Employment can be a convenient indicator for the need for waste management services in the business sector. TRPC estimated that in 2017 around 60,600 people worked in Olympia. The most common industries were state government (21%), health care and social assistance (16%), retail trade (11%), professional services (11%), and accommodation and food services (7%). TRPC expects total employment to grow to nearly 81,000 by 2045. Extrapolating linearly, this would make employment about 70,000 in 2030 and 77,000 in 2040.
Waste Generation and Diversion
This section describes the total “pile” of waste that Olympia residents and businesses now generate, and the portion of that “pile” that is potentially diverted through recycling and composting programs. As†discussed in Chapter 1 and Chapter 2, the City’s zero waste vision aims to eventually reduce the size of the overall “pile” of waste and increase the portion that is recycled or composted.
What is Waste?
To pursue the City’s zero waste vision, this Plan addresses all Municipal Solid Waste (MSW), recyclables, and compostable debris generated by Olympia residents and businesses, regardless of whether the material is collected by the Utility or private companies, or whether it is self-hauled to disposal or recycling collection centers. The Plan does not address dangerous wastes, biomedical wastes, or other wastes with special regulatory requirements, although the City can exert influence on these other wastes through regulation, education, advocacy, and direct service.
Municipal solid waste is a mixture of discarded items and materials that have not been separated for recycling or composting. Because people are†not 100% efficient at separating recyclables, their MSW usually contains recyclable materials and yard debris that have been discarded with other garbage.
Recyclable materials include traditional “curbside” items such as paper, cardboard, bottles, and cans. However, anything that can be “transformed or remanufactured” into “usable or marketable materials” is considered recyclable. Other materials often recycled include ferrous and non-ferrous metals, gypsum, textiles, and food debris. Products such as computers and rechargeable batteries are also considered recyclable where a take-back program is available.
Construction and demolition (C&D) debris is often identified as a separate waste category because of the way it is generated. However, it is considered a component of MSW. Some C&D materials are discarded into ordinary residential and commercial garbage containers, such as waste from small remodels and repairs. Large quantities of C&D debris generated at construction sites are usually placed into rented dumpsters and sent to the landfill. If C&D materials such as wood, concrete or metal are separated for recycling, they are counted as recyclables, not MSW.
How Much Waste Does Olympia Generate?
Historical data suggests that through 2005, waste generation closely followed fluctuations in the population and economy with ever-increasing amounts. Between 2005 and 2013, total waste collected and managed by the Waste ReSources Utility decreased by nearly 20%. This decrease was likely due to the Great Recession of 2008, use of more light-weight materials, shifts in packaging materials, and an increase in recyclable and compostable materials hauled by private companies. Due to population growth and the economic rebound since the last plan, total waste collected and managed by the Waste ReSources Utility increased by 11% between 2014 and 2021. In 2021, Olympia’s residents composted or recycled 40% of their waste. These data do not include commercial recyclables hauled by private companies or other self-hauled waste because these tonnages are not reported to the City.
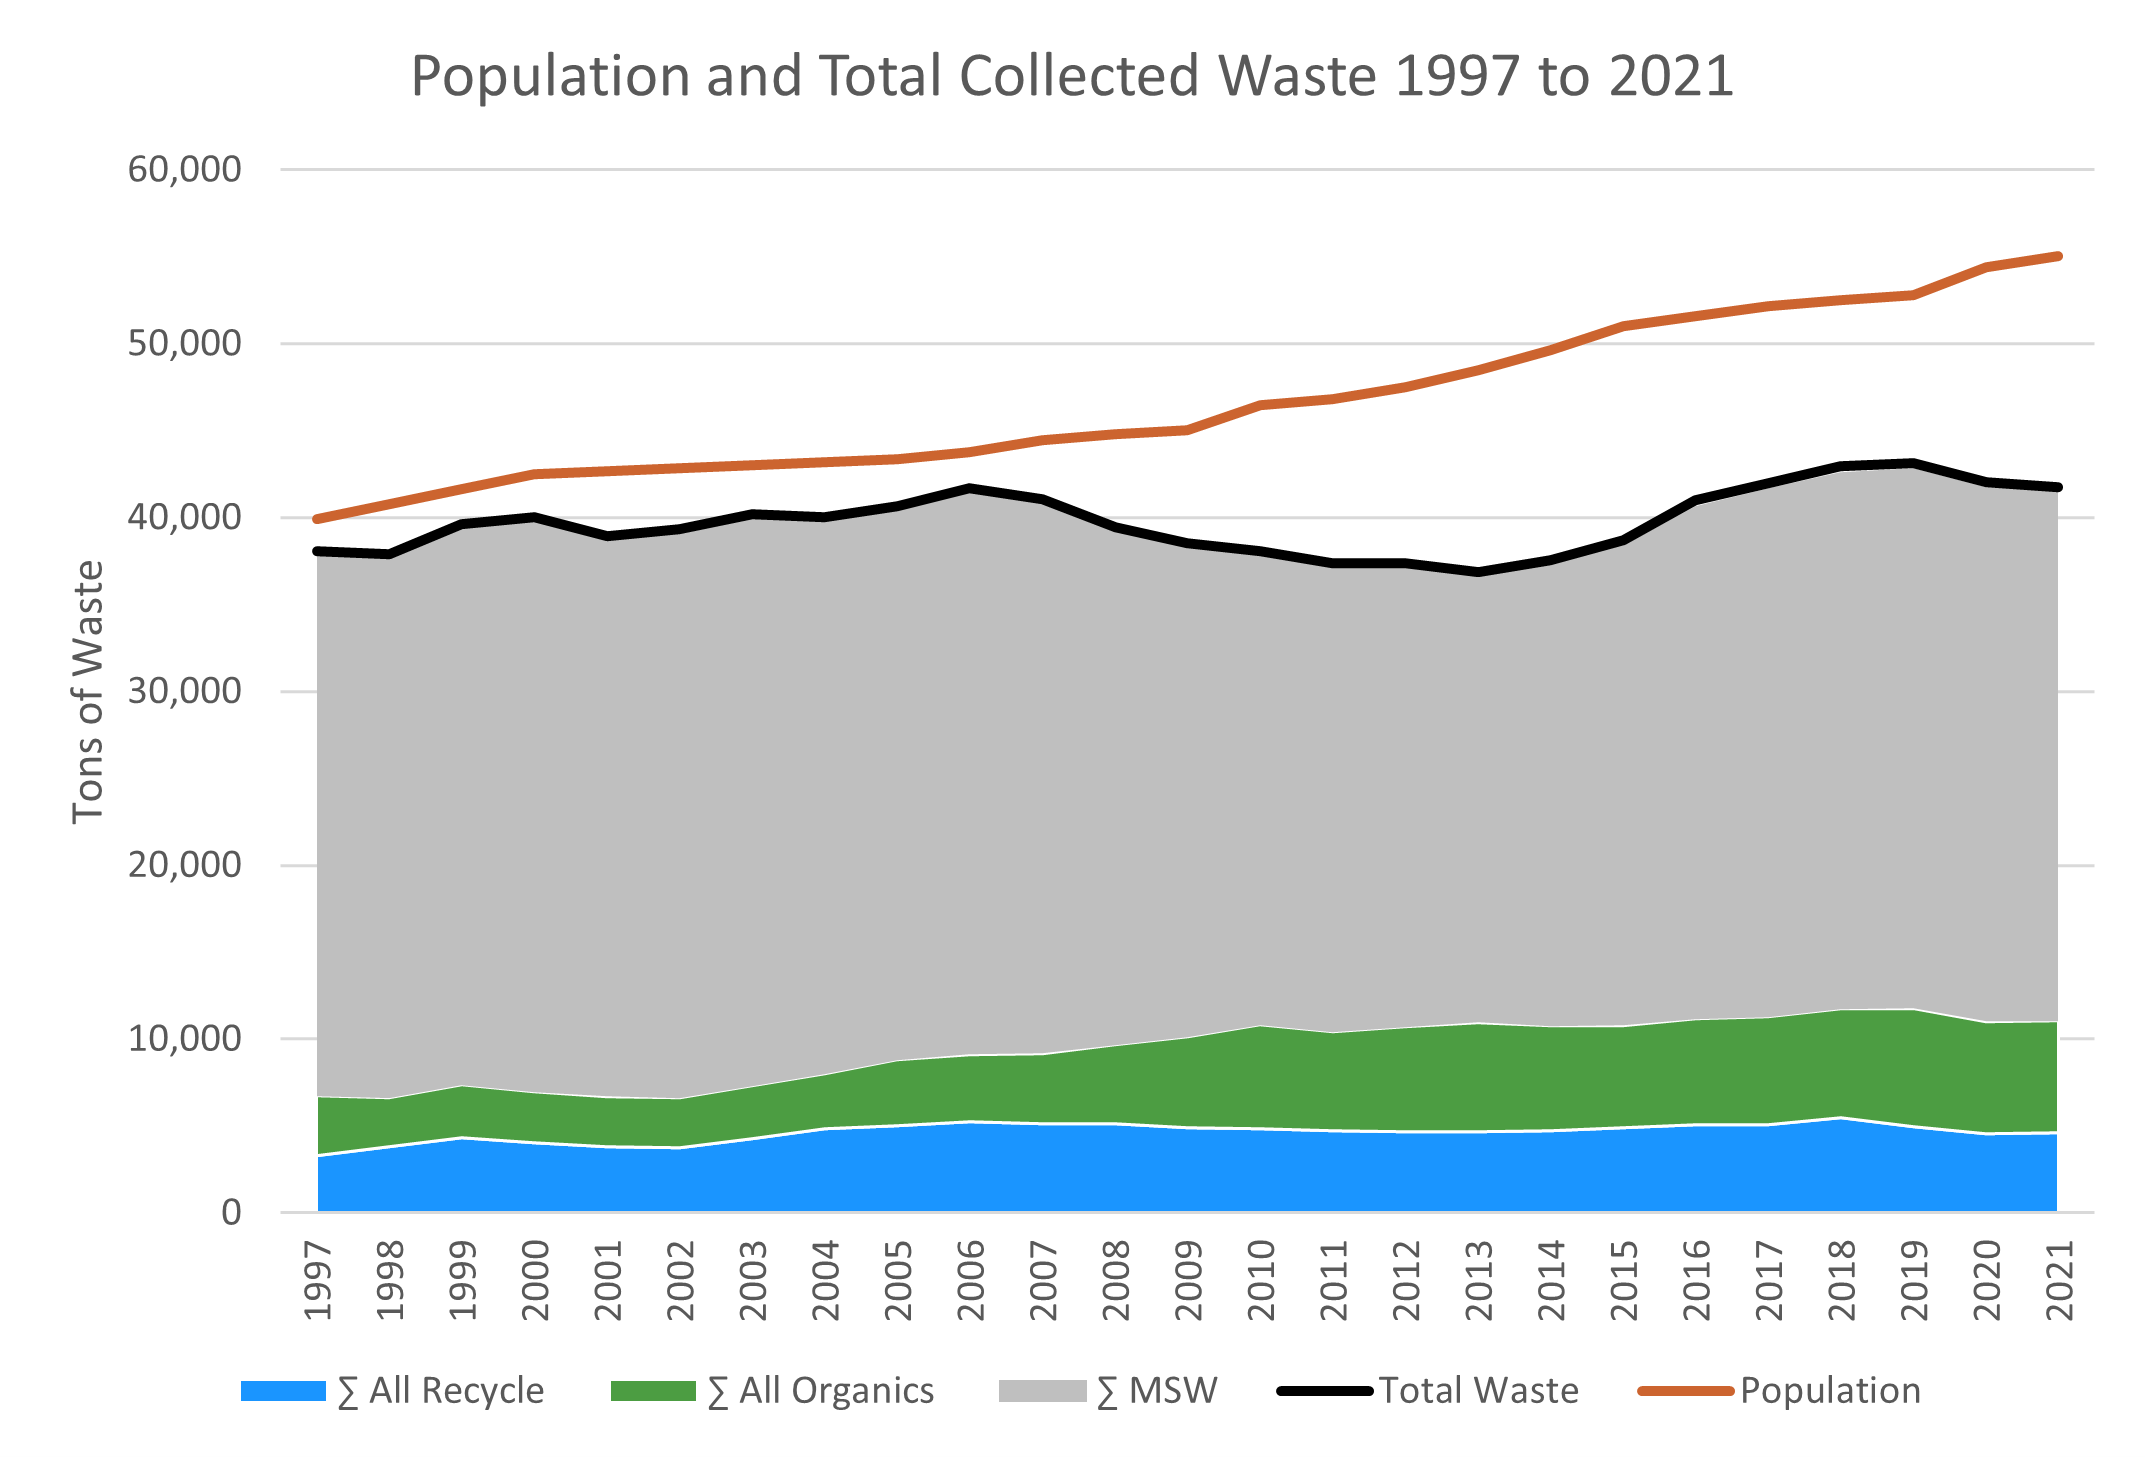
View Figure 9 Population and Total Collected Waste 1997 to 2021
In 2021, Olympia’s residents and businesses generated approximately 41,727 tons of waste. This does not include garbage, recyclable and organic materials collected by private companies, self-hauled to Thurston County’s Waste and Recovery Center (WARC), or collected from the state’s Capitol Campus.
Figure 10 shows the changes in waste generation and population between 2013 and 2021, based on what Olympia hauls and can accurately measure (excludes commercial recycling hauled by private companies). While population increased by 12.1%, total waste hauled by Olympia increased by 13%. Within that overall trend, garbage decreased by 30%, organics increased by 60% and recycling decreased by 8%
By comparison, between 2013 and 2021, residential waste increased overall by 9%, while population increased by 12.1%.
Total waste generated (including garbage, recycling, and organics) per capita per day was 4.2 pounds per day in 2013, peaked at 4.5 pounds in 2018 and decreased to 4.2 pounds in 2021. The Utility and City Council have adopted pounds of garbage to landfill as a key performance measure. Garbage per capita per day followed the same trends, from 2.9 pounds in 2013 to 3.2 pounds in 2018 to 3.1 pounds in 2021.
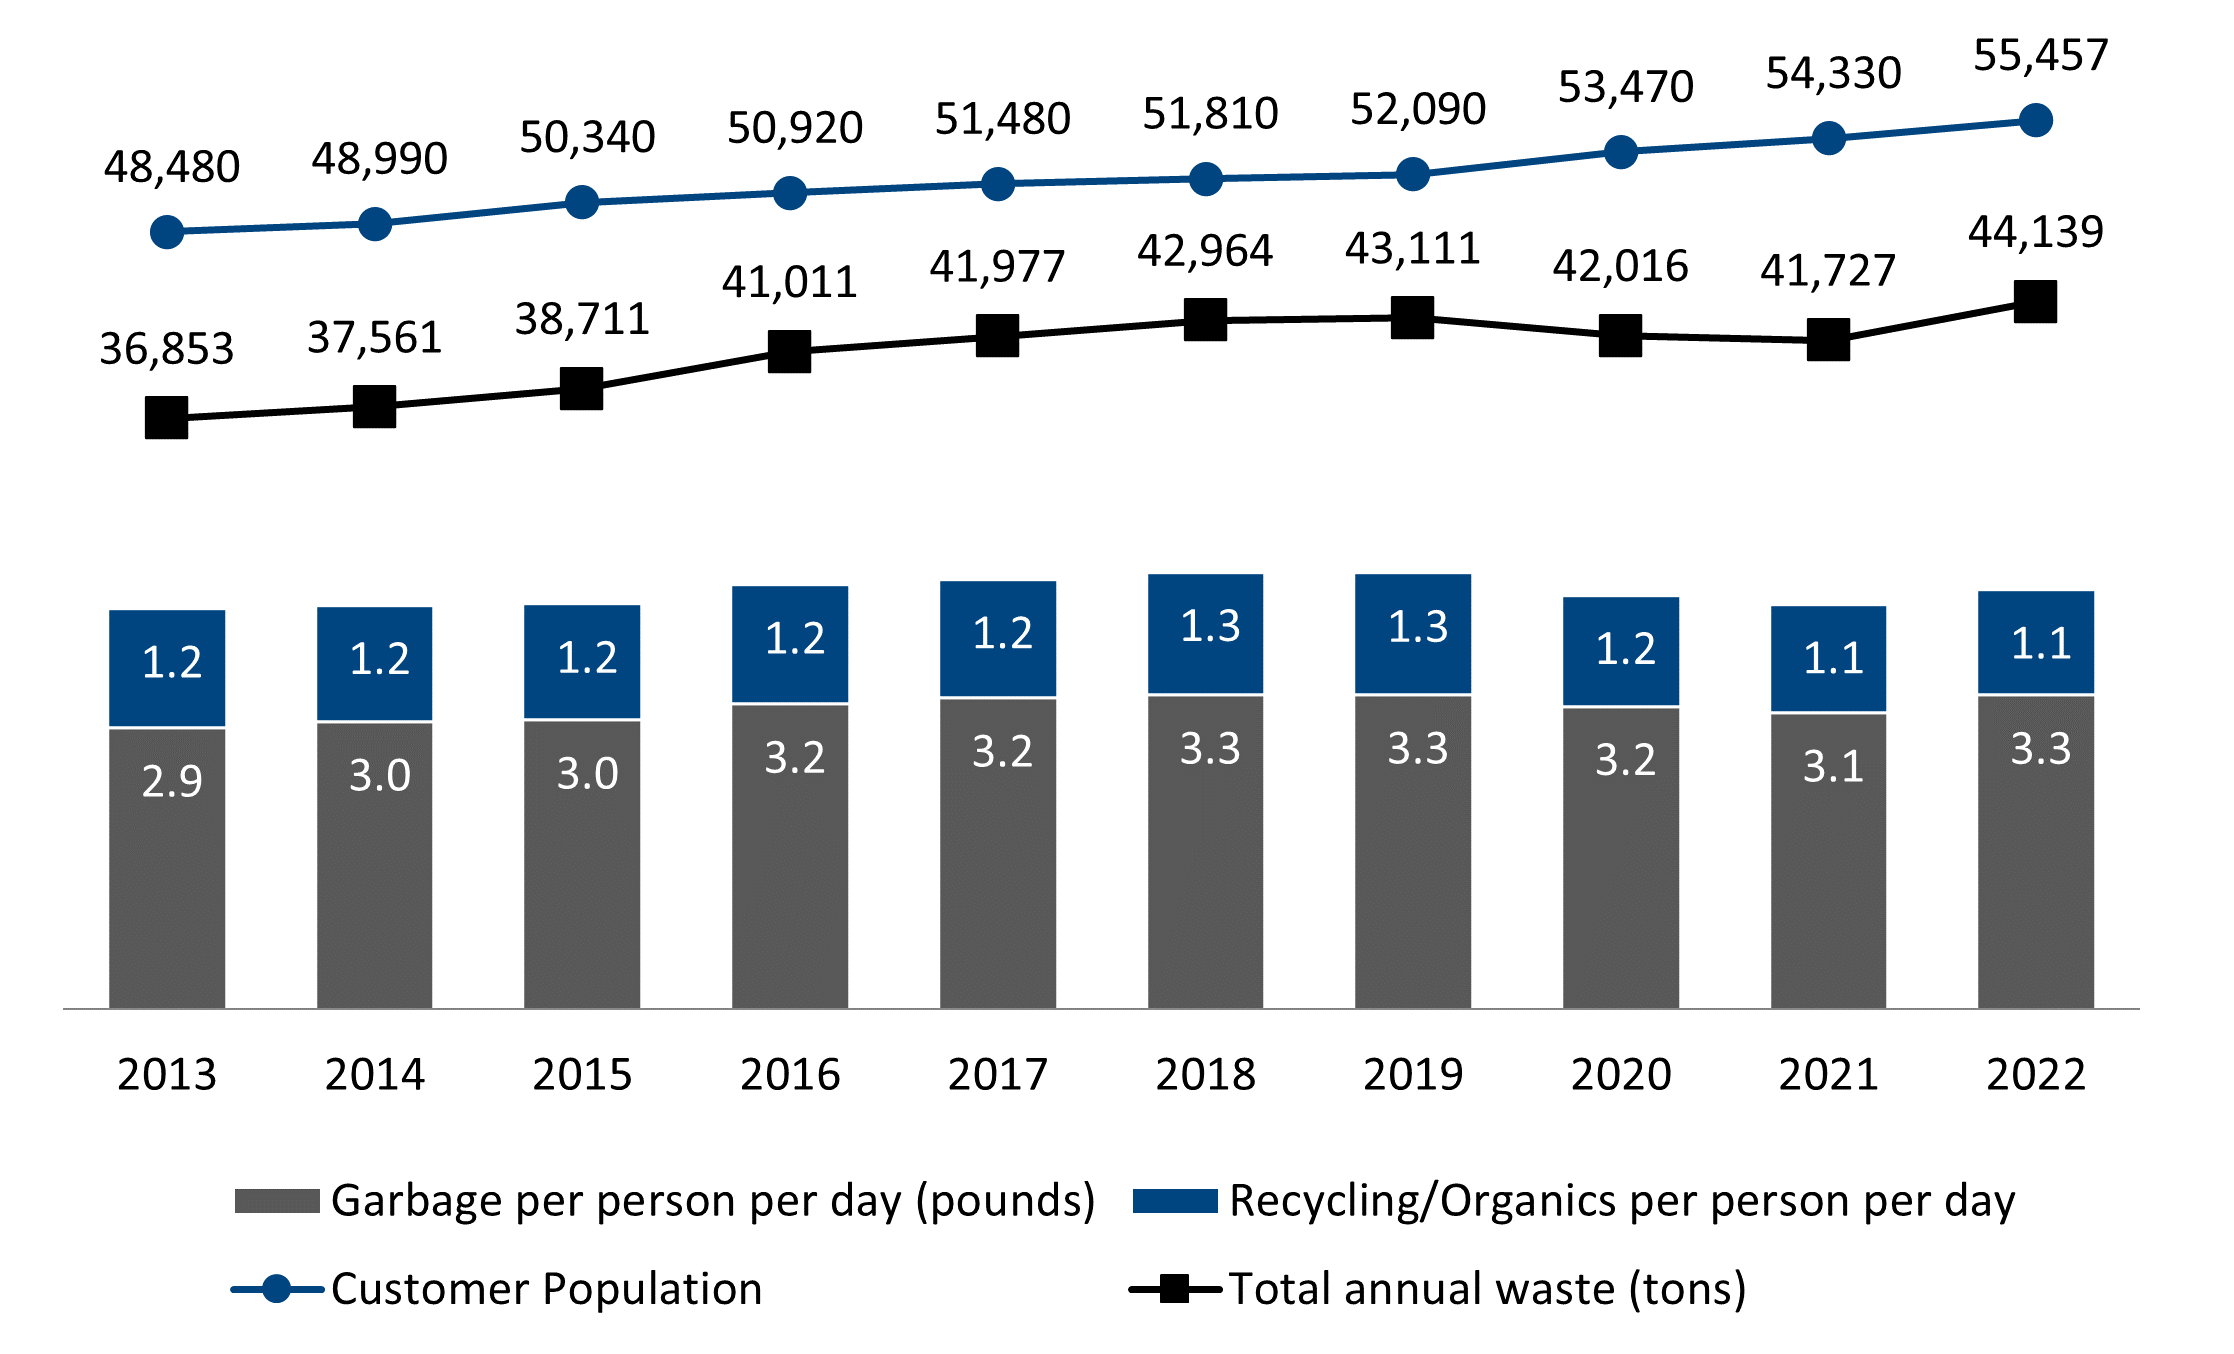
View Figure 10 Waste Generated and Landfill Per Capita
Who’s Generating the Waste?
As shown in Figure 11, the commercial sector accounts for nearly half (42%) of the waste sent to the landfill from Olympia, while single-family homes account for a similar amount (42%) of the generation. Table 2 breaks down in detail the types of waste generated by customer class, number and type of receptacles, total tonnage, number of customers, and hauler (City and/or private).
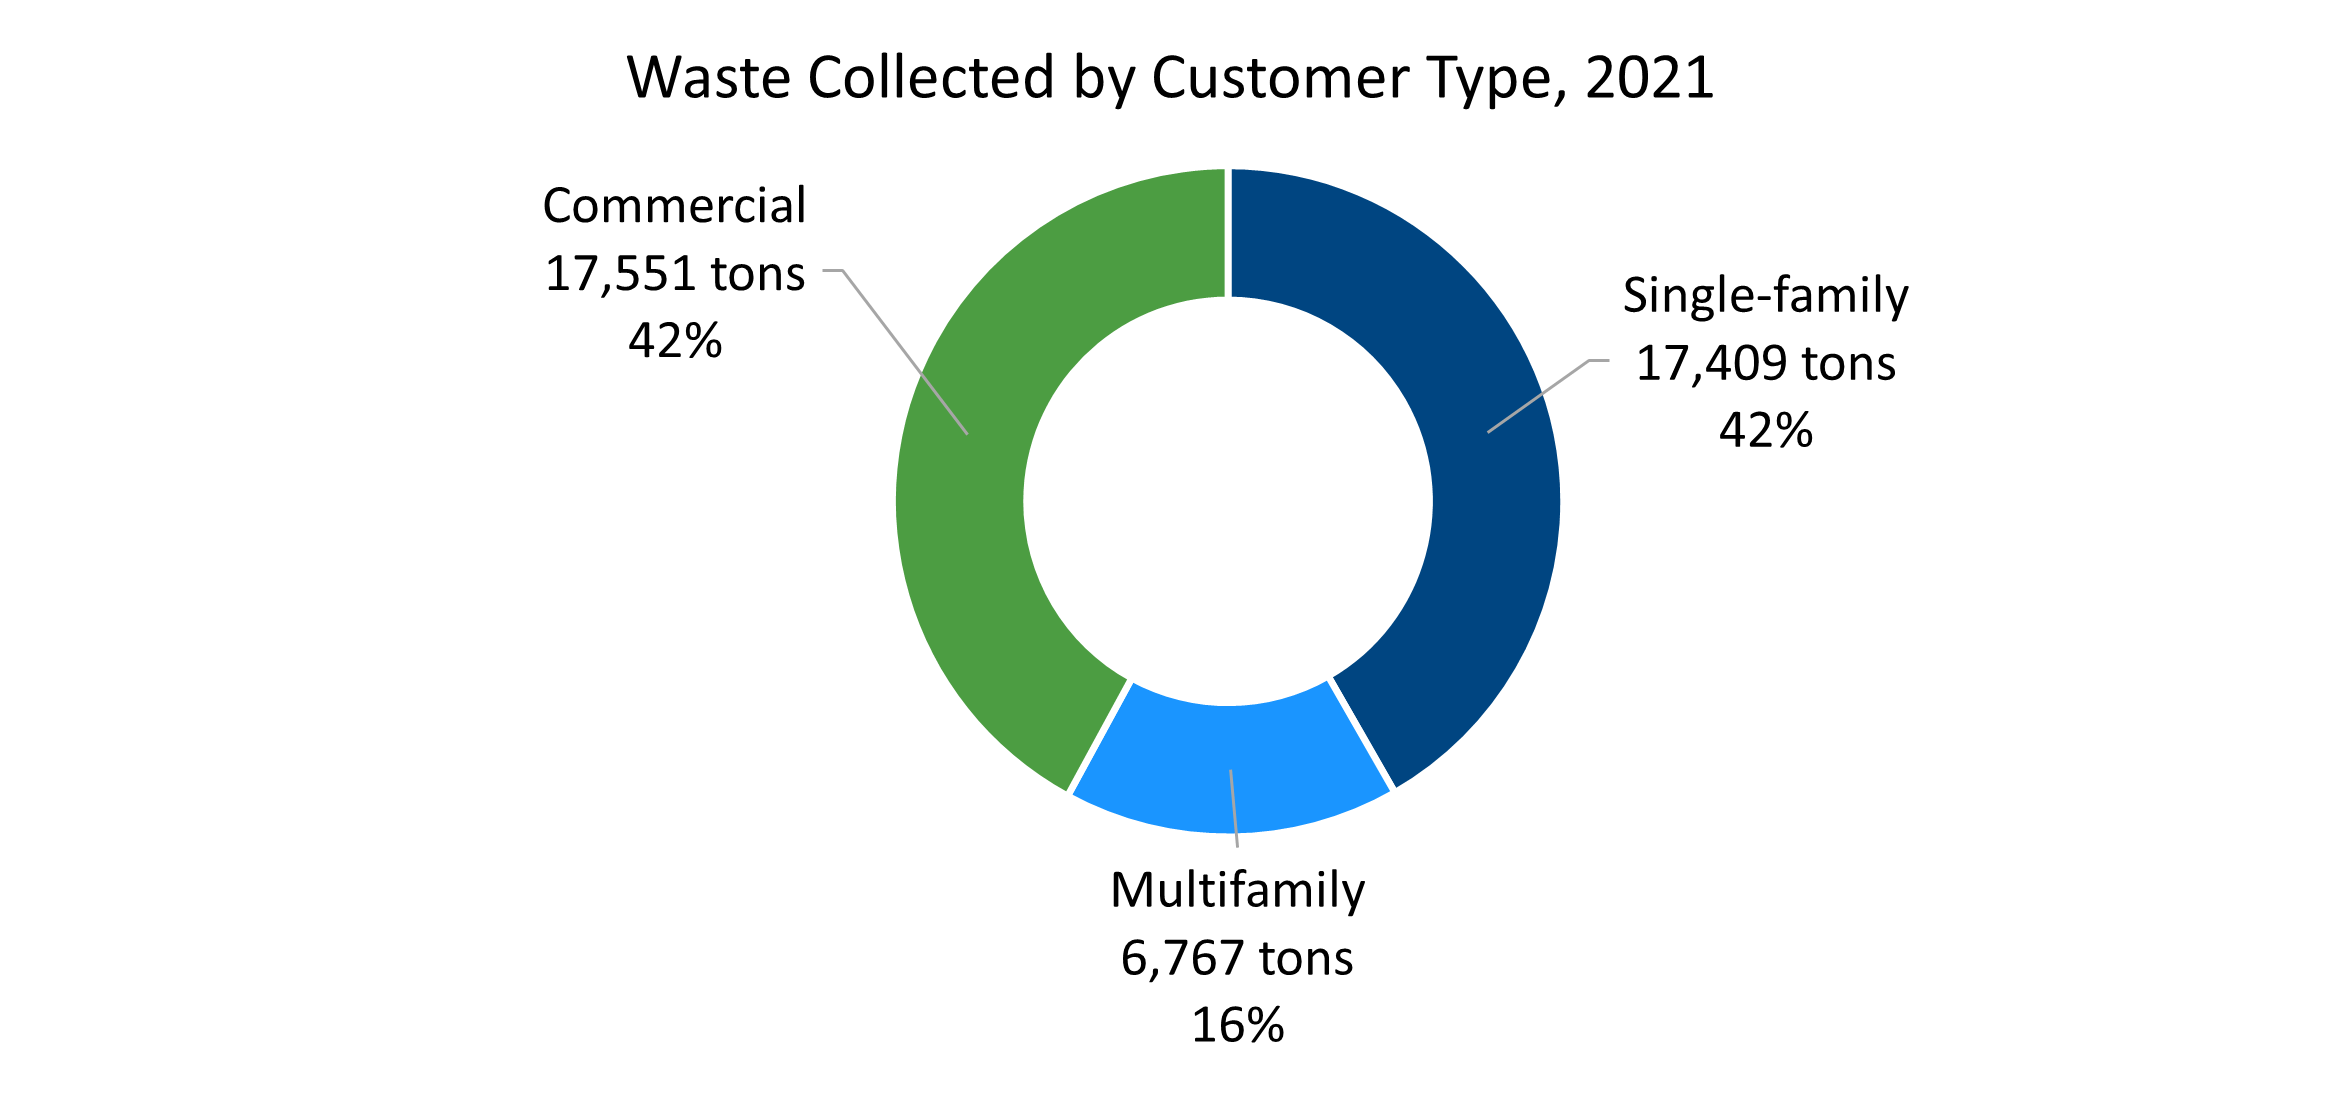
View Figure 11 Waste Generation by Customer Type, 2021
|
Waste Type and Generator |
Receptacle Type* and 2021 Counts |
Total Tons and Customers or Deliveries 2021 |
Hauler |
|---|---|---|---|
|
Residential garbage |
|||
|
Single-family dwellings and duplexes |
15,720 Carts |
8,599 tons 14,324 customers |
City |
|
Multifamily dwellings |
Sometimes carts (included in single-family), mostly dumpsters, drop boxes and compactors (included in commercial) |
5,831 tons 150 properties |
City |
|
Residential recyclables** |
|||
|
Single-family dwellings and duplexes |
16,800 Carts |
2,956 tons 14,342 customers |
City |
|
Multifamily dwellings |
1,494 Carts |
936 tons 142 properties |
City |
|
101 cardboard-only dumpsters (4 cubic yards) |
Tons in multifamily cart tons 63 properties |
City |
|
|
Glass drop-off site |
Drop-off site |
383 tons |
City |
|
Residential organics |
|||
|
Mostly single-family dwellings |
9,226 Carts |
5,348 tons 9,055 customers |
City |
|
Yard-Waste drop-off site |
Drop-off site |
123 tons |
City |
|
Commercial garbage*** |
|||
|
Commercial garbage*** Businesses, institutions, government agencies, etc. |
Carts/Cans (Included below in dumpster total) |
Tons in dumpster total below 121 customers |
City |
|
1,341 Dumpsters |
8,520 tons 1,222 customers |
— |
|
|
Drop boxes and compactors |
7,621 tons 263 deliveries 3,884 hauls |
City |
|
|
Commercial recyclables |
|||
|
Businesses, institutions, government agencies, etc. |
Data for private recyclers unknown City picks up 51 containers of various types at City Buildings |
Tons and customers served by private recyclers unknown City collected 364 tons from 10 buildings |
Private and City |
|
Commercial Organics |
|||
|
Businesses |
172 Dumpsters and carts |
Private tons and customers unknown. City collected 594 tons from 160 customers |
City and Private |
|
Mostly businesses |
Hauls vary by need 6 permanent drop boxes 118 hauls which includes many temporary containers 2 compactor customers resulting in 27 hauls |
Private tons and customers unknown. City collected 328 tons (customer counts included above) |
City and Private |
|
C&D Debris |
|||
|
Construction & Demolition Companies |
2 permanent drop boxes with 9 hauls in 2021 |
Private unknown City collected 124 tons |
City and private recyclers |
|
|
Total Generation |
41,727 |
|
|
|
11,032 |
|
|
* For operational reasons, the City of Olympia tracks garbage collection on the basis of container type – cart, dumpster or compacter, as well as customer type.
** Includes all “traditional” curbside materials: mixed paper, newspaper, cardboard, glass bottles and jars, aluminum cans, tin cans, PET and HDPE plastic bottles, and milk cartons.
*** Excludes garbage from the Capitol Campus and materials self-hauled to the WARC.
How Much Waste Does Olympia Recycle and Compost?
Two goals of this Plan are to continue reducing the total quantity of material discarded (waste) and increasing the portion of waste that is recycled or composted. Generally, waste is reported by weight, which streamlines the process and makes charging customers easy. Recycling rates are calculated by dividing the sum (by weight) of materials collected for recycling and composting by the sum of garbage, recyclable and compostable materials. Weight based metrics are easy to calculate, and relatively simple to communicate to the public. Weight based rates, however, do not necessarily account for contamination or external factors that reduce total waste generated primarily by reducing recycling tonnages.
Recycling rates can be affected by several factors, many of them beyond the control of Waste ReSources. The types and weights of packaging continue to evolve and change. Beverage containers get lighter, newspapers have fewer pages, and non-recyclable lightweight flexible packaging replaces heavier recyclable rigid containers. Consumer purchasing habits and the economy also play a role. The amount and weight of organic compostable material also factors into the rate. A drier year with a shorter grass growth season results in fewer tons of organics collected. The decline in the recycling rate from 2010 to 2011 was likely influenced by a combination of these factors. The recycling rate increased to 60% in 2013 as the economy recovered, but slowly declined each year thereafter. The COVID-19 pandemic changed consumption and disposal behaviors in 2020 and 2021. In 2020, Waste ReSources removed glass and polycoated materials from the commingled system. During this period, the recycling rate decreased from 55% in 2019 to less than 48% in 2021.
Table 3 shows the quantities and percentages of recyclable and organic materials and garbage hauled by City crews from single-family, multifamily, and commercial customers. This table provides a complete picture of the amount of garbage generated in Olympia. However, it does not give a complete depiction of recycling efforts because the Utility does not have access to reliable data on tons recycled and composted by businesses that use private collection companies.
|
|
2013 |
2014 |
2015 |
2016 |
2017 |
2018 |
2019 |
2020 |
2021 |
|---|---|---|---|---|---|---|---|---|---|
|
Single-family Recycling1 |
3,944 |
3,917 |
3,993 |
3,976 |
4,048 |
4,319 |
3,940 |
3,560 |
3,339 |
|
Single-family Organics1 |
5,365 |
5,060 |
4,856 |
5,007 |
4,896 |
4,963 |
5,288 |
5,555 |
5,471 |
|
Single-family Garbage |
6,227 |
6,640 |
6,714 |
6,941 |
7,129 |
7,516 |
7,483 |
8,906 |
8,599 |
|
Total Single Family Residential |
15,536 |
15,617 |
15,563 |
15,924 |
16,073 |
16,798 |
16,711 |
18,021 |
17,409 |
|
Single-family Recovery Rate |
60% |
57% |
57% |
56% |
56% |
55% |
55% |
51% |
51% |
|
|
|
|
|
|
|
|
|
|
|
|
Multifamily Recycling |
734 |
820 |
796 |
901 |
828 |
970 |
796 |
812 |
936 |
|
Multifamily Organics2 |
* |
* |
* |
* |
* |
* |
* |
* |
* |
|
Multifamily Garbage4 |
4,324 |
4,250 |
4,515 |
4,785 |
4,999 |
4,999 |
4,874 |
5,284 |
5,831 |
|
Total Multifamily |
5,058 |
5,070 |
5,311 |
5,686 |
5,827 |
5,969 |
5,670 |
6,096 |
6,767 |
|
Multifamily Recovery Rate |
15% |
16% |
15% |
16% |
14% |
16% |
14% |
13% |
14% |
|
|
|
|
|
|
|
|
|
|
|
|
Commercial Recycling3 |
0 |
0 |
89 |
190 |
209 |
211 |
198 |
159 |
364 |
|
Commercial Organics |
917 |
965 |
1,058 |
1,080 |
1,279 |
1,258 |
1,533 |
933 |
922 |
|
Commercial Garbage |
15,342 |
15,843 |
16,417 |
17,775 |
18,297 |
18,397 |
18,733 |
16,565 |
16,141 |
|
Commercial C & D |
0 |
66 |
273 |
356 |
292 |
331 |
266 |
242 |
124 |
|
Total Commercial |
16,259 |
16,874 |
17,837 |
19,401 |
20,077 |
20,197 |
20,731 |
17,899 |
17,551 |
|
Commercial Recovery Rate |
6% |
6% |
6% |
7% |
7% |
7% |
8% |
6% |
7% |
|
|
|
|
|
|
|
|
|
|
|
|
Total Recycling |
4,678 |
4,737 |
4,878 |
5,067 |
5,085 |
5,500 |
4,934 |
4,531 |
4,639 |
|
Total Organics |
6,282 |
6,025 |
5,914 |
6,087 |
6,175 |
6,221 |
6,821 |
6,488 |
6,393 |
|
Total Garbage |
25,893 |
26,733 |
27,646 |
29,501 |
30,425 |
30,912 |
31,091 |
30,755 |
30,571 |
|
Total C & D |
0 |
66 |
273 |
356 |
292 |
331 |
266 |
242 |
124 |
|
Total Olympia |
36,853 |
37,561 |
38,711 |
41,011 |
41,977 |
42,964 |
43,111 |
42,016 |
41,727 |
|
Total Recovery Rate |
30% |
29% |
28% |
27% |
27% |
27% |
27% |
26% |
27% |
* Single-family recycling and organics include the City drop-off site.
** A small amount of organic material is collected in multifamily waste, but those tons are not yet separated out and are counted as part of residential single-family waste.
*** Commercial recycle tons shown are from materials collected in dumpsters.
**** Total recovery rate excludes commercial recycling and C&D recycling collected by private haulers.
Trends in waste hauled by the Utility are illustrated in Figure 12.
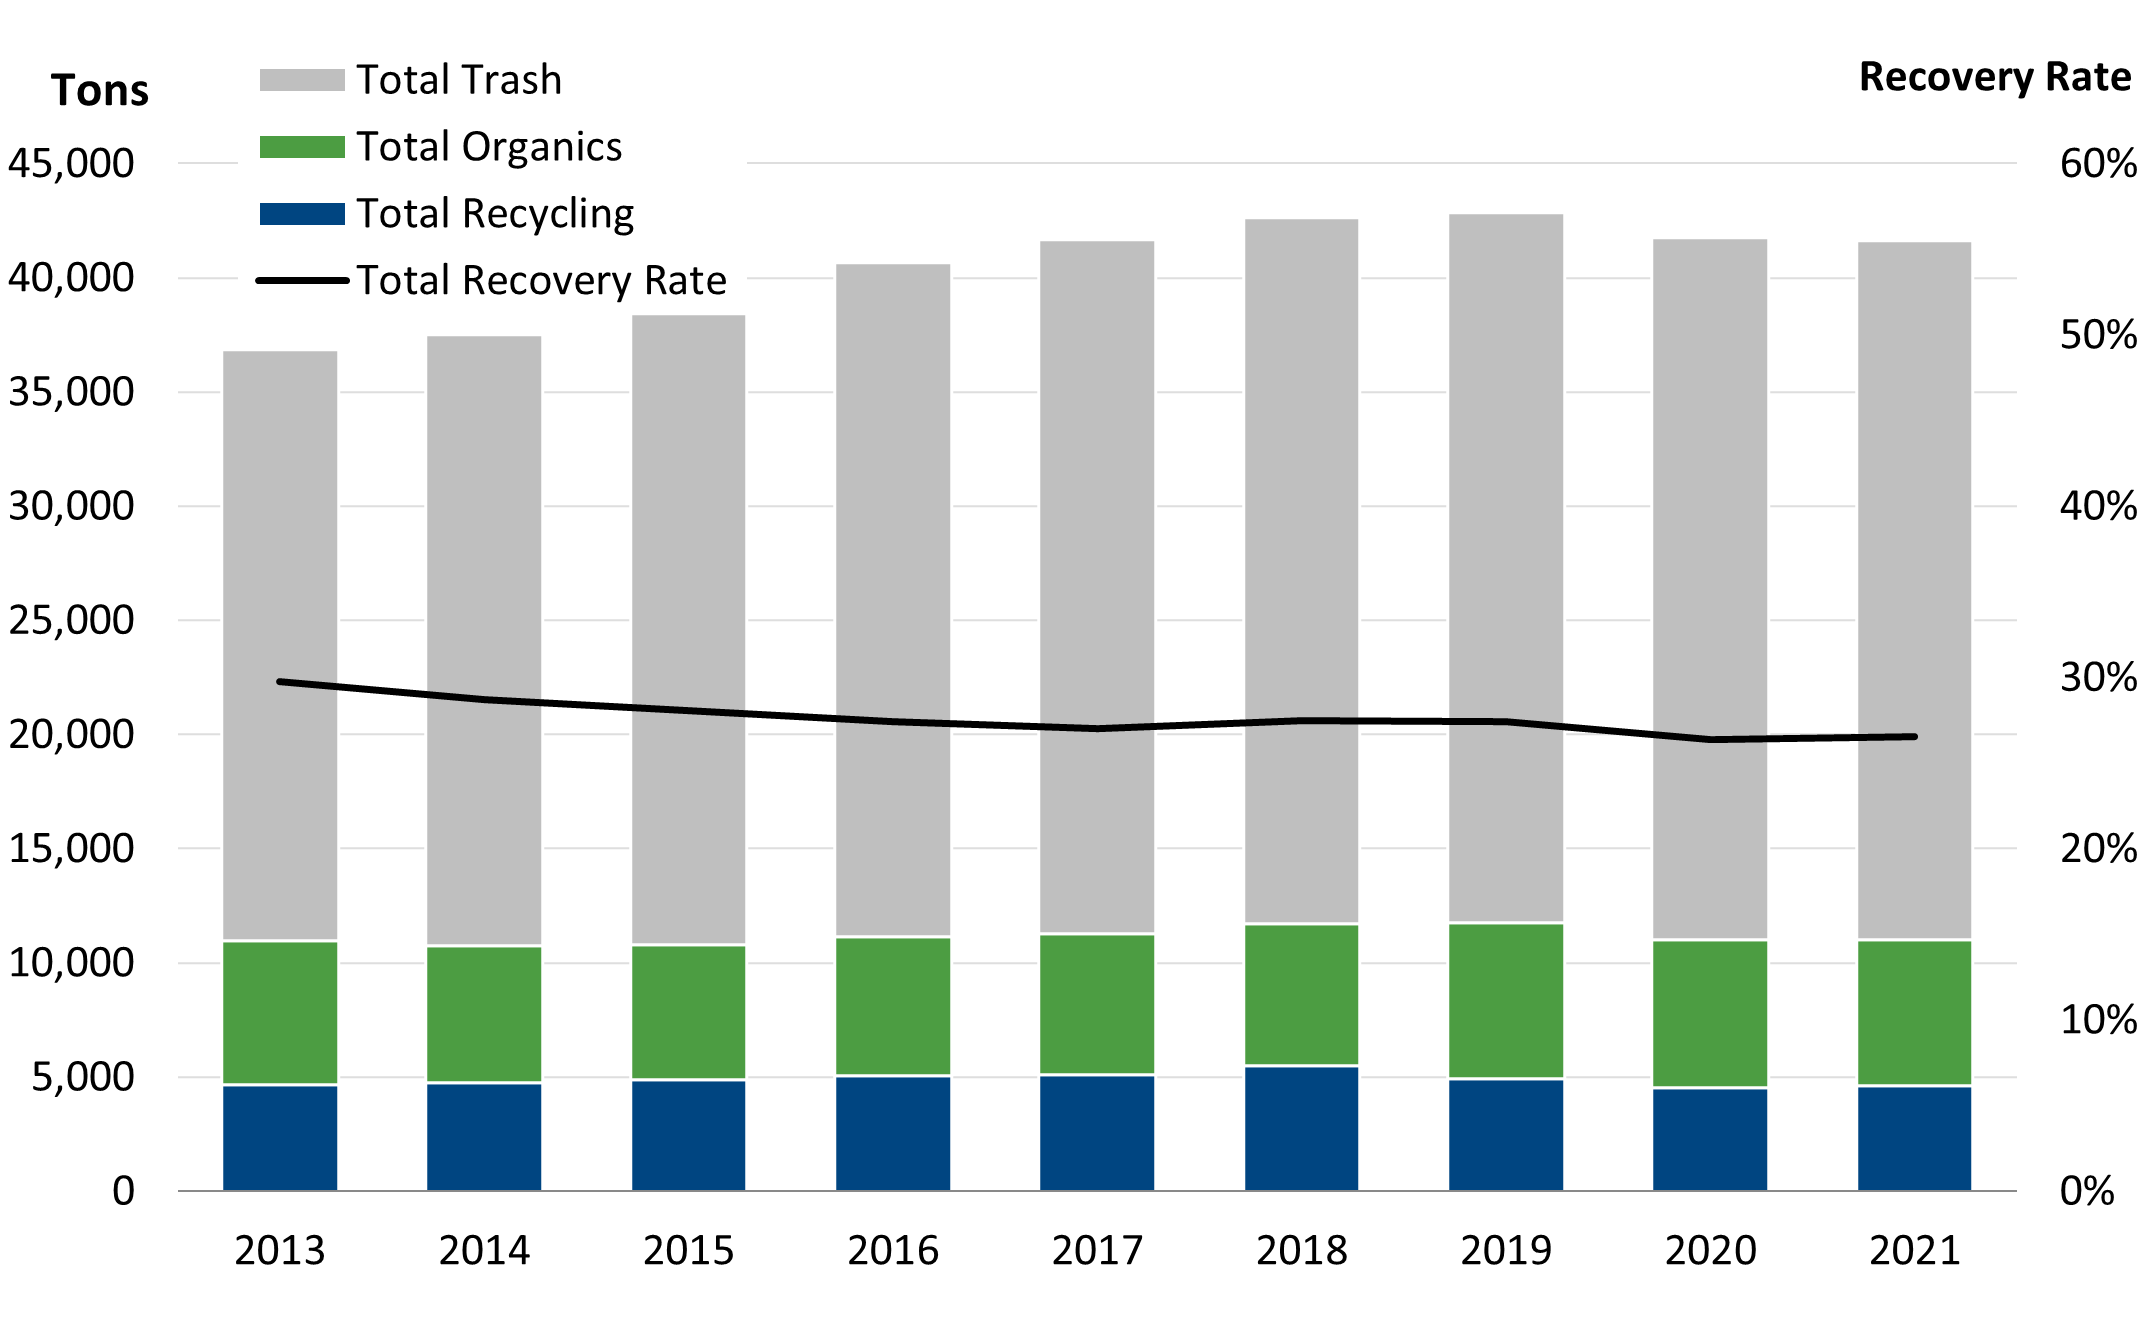
View Figure 12 Trends in Resource Recovery, 2013 to 2021
Commercial Recycling and Composting
The majority of commercial recycling is collected by private companies and not reported to the City and data collected by the State is not broken down by jurisdiction. Because of this, it is not possible to know how much recyclable material is generated and collected from Olympia businesses. Of the waste collected by the Utility from commercial customers, the recovery rate for commercial recyclables, compostable material, and construction and demolition material has ranged between 6% and 8% since 2013. Thurston County, at the request of its composting facility, reduced what is acceptable for composting to food and yard waste only. This resulted in a drop in customers and tons but did not have a measurable effect on the diversion rate. The Residential and Commercial Collection Service Studies (conducted for the 2013 2020 Plan) estimated that the total commercial recycling rate is between 11 and 51%; more recent estimates are not available.
Residential Recycling and Composting
Olympia has reliable data on residential recycling, as detailed in Table 2. Trends for single-family and multifamily customers are shown in Figure 13. From 2013 to 2021, the recovery rate for single-family households decreased from 60% to 51%. The recovery rate for multifamily households stayed constant around 15%, after nearly doubling from 8% in 2008.
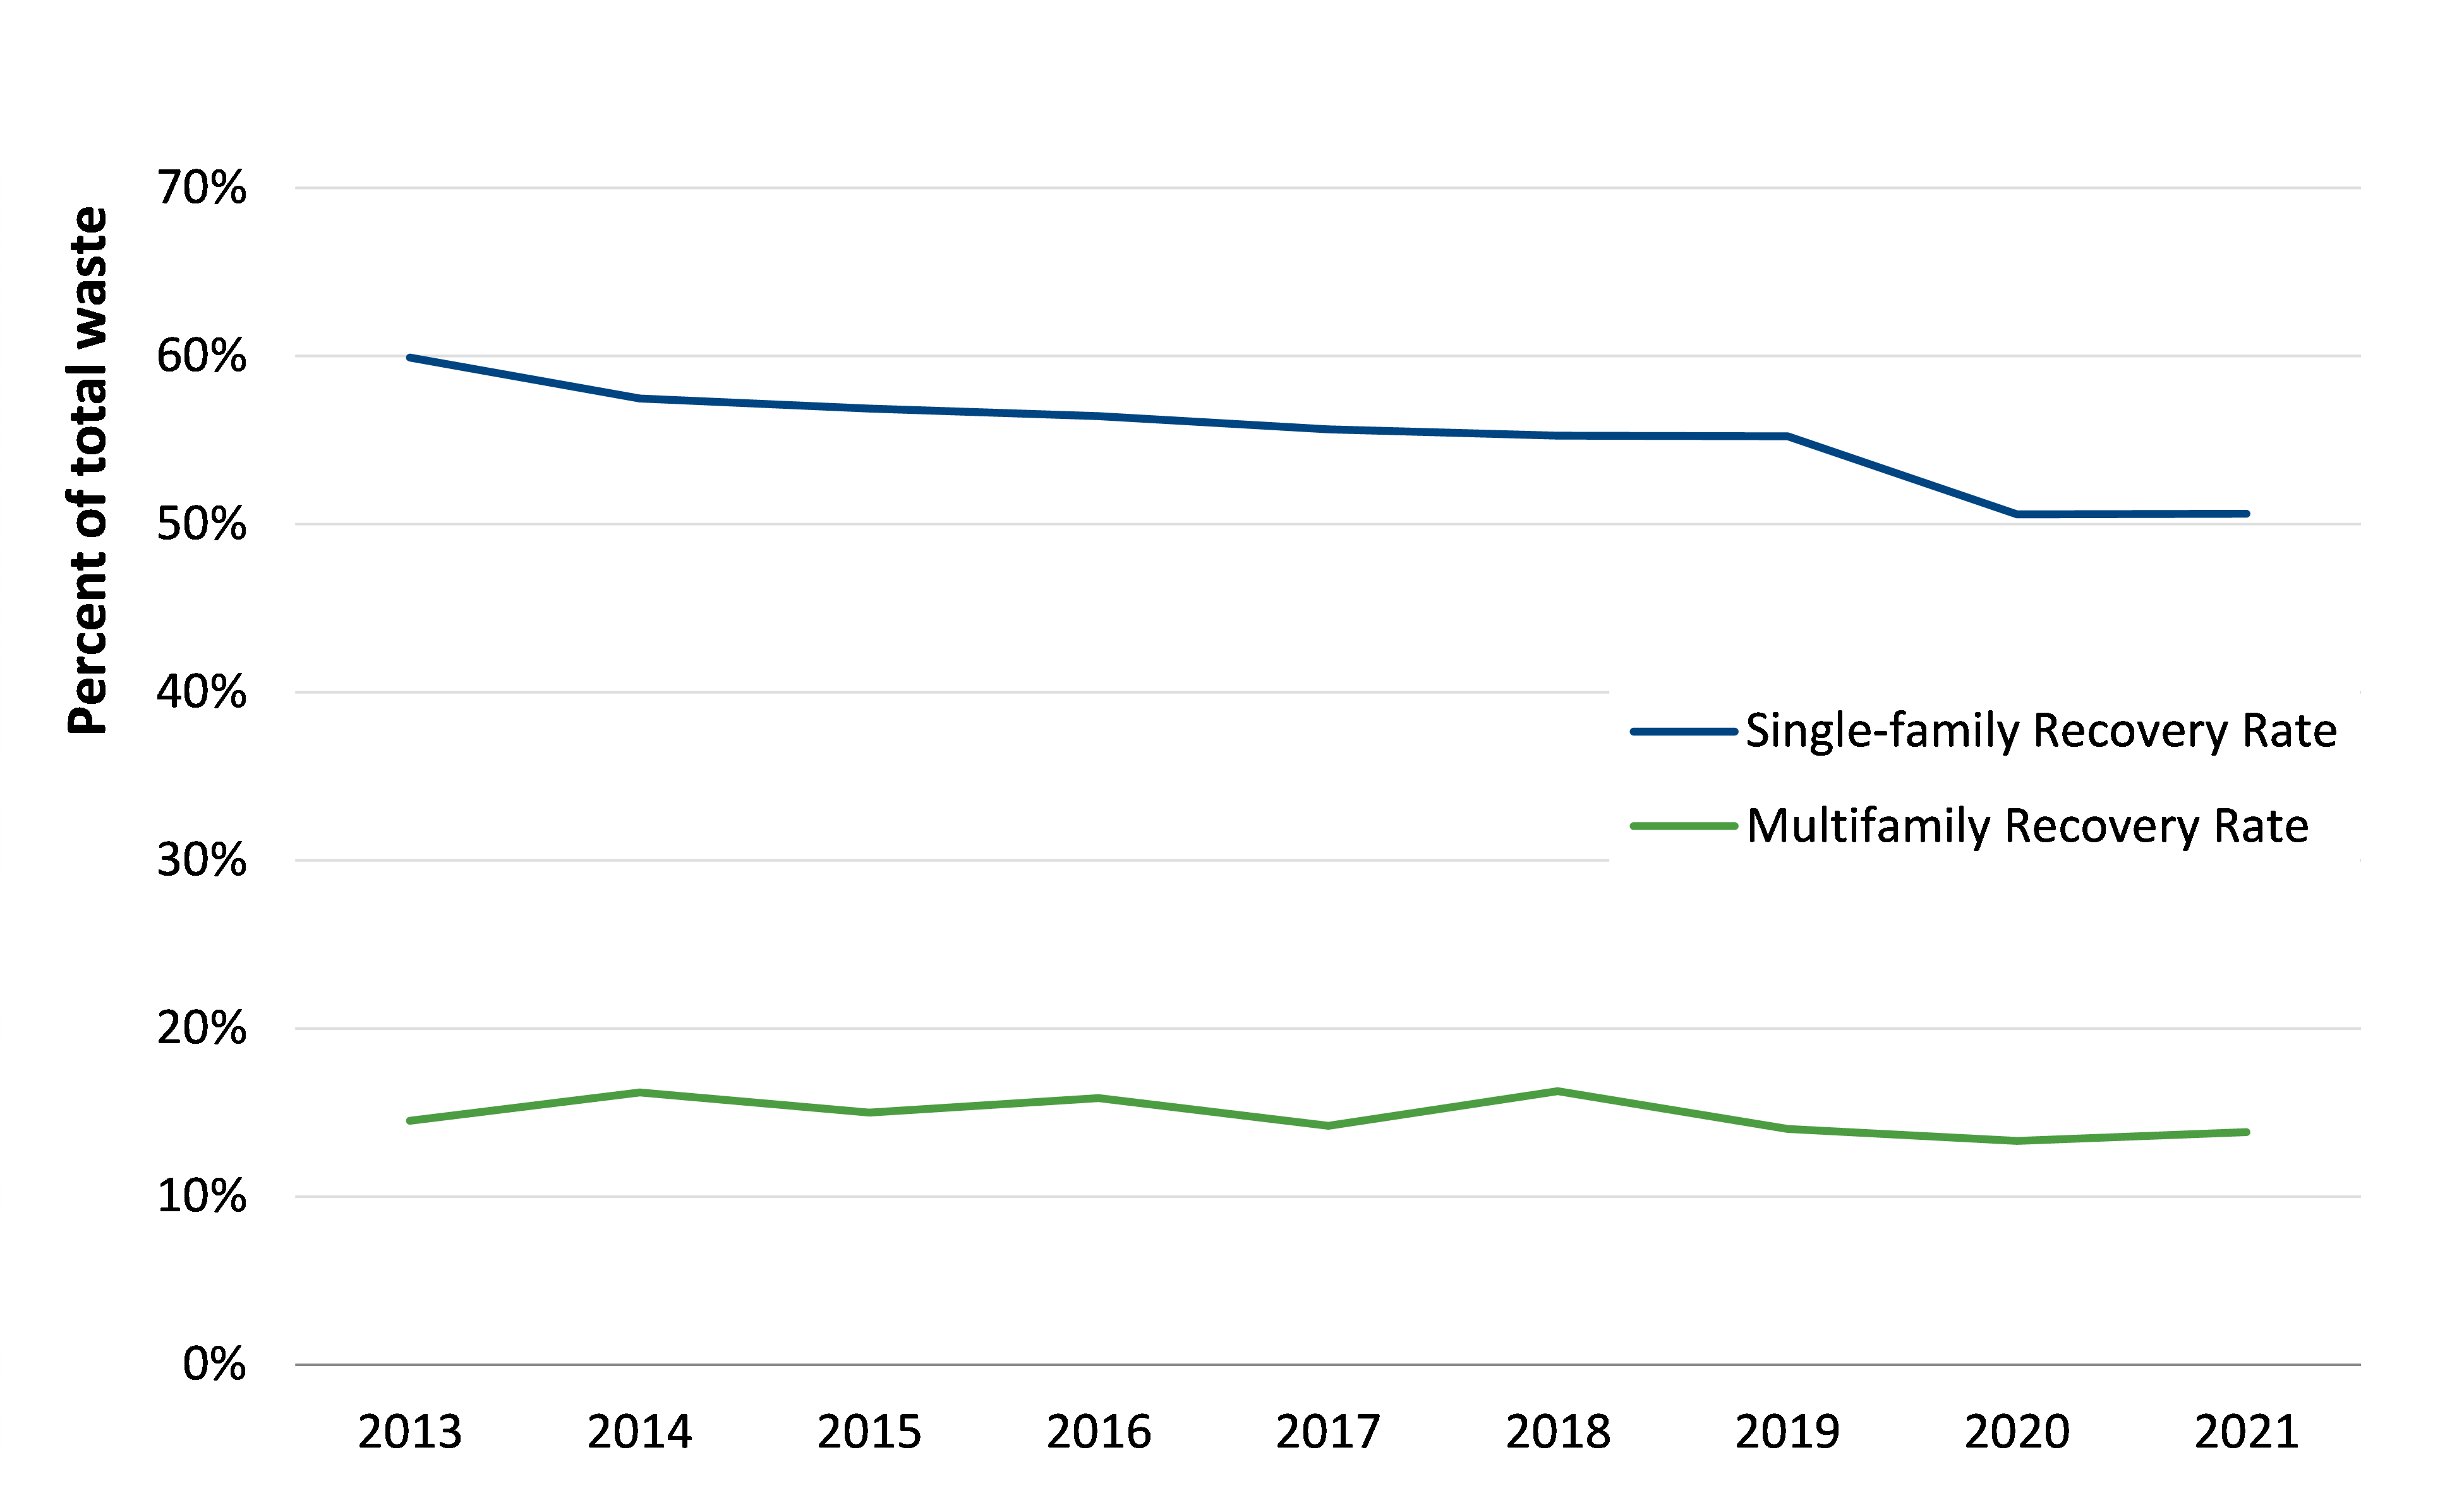
View Figure 13 Residential Recycling Rates, 2013 to 2021
Potential for Waste Prevention and Diversion
Thurston County periodically measures what materials are going to the landfill as garbage, and Olympia participates in these waste sort studies. These percentages are useful because they help estimate the quantities of recyclable materials that could be removed from Olympia’s garbage by being recycled or composted instead.
The most recent waste characterization study was conducted in 2014. Table 4 summarizes what share of material taken to the landfill in 2014 from single-family, multifamily, and commercial customers was recyclable or compostable. At that time, 40% to 45% of the waste being landfilled was recyclable or compostable. This figure does not include materials considered potentially recyclable but for which collection programs did not exist in 2014. Based on the previous study, materials with the greatest potential are:
• Curbside and commercial recyclables that include cardboard, other recyclable paper, metal cans, and plastic bottles and tubs. Since the 2014 study, Olympia stopped curbside collection for glass and accepts it only at drop-off sites. Since the 2015 plan, Olympia has offered commercial recycling through drop box services, which approximately 15 customers use.
• Food debris and compostable paper present a major opportunity for both organics collection and waste prevention. Olympia began collecting commercial organics in 2009, while residential collection began in 2008. From 2009 to 2018, Olympia collected commercial organics in the form of food and yard waste, and then expanded the list to include some compostable products. After 2018, the list was reduced to yard and food waste along with paper napkins, hand towels, wood pallets, and other clean wood.
• Metals, wood, and C&D debris that come particularly from commercial customers. Metals, concrete, and brick can be recycled locally, but lack of local processors for other materials limits additional C&D recycling.
• Other potentially recyclable materials include textiles, which also present an opportunity for waste prevention.
Thurston County is currently conducting a new waste characterizations study for 2023 that will provide county-wide insights into waste composition, although this study may not provide adequate details regarding Olympia’s waste.
|
|
|
Single-family Garbage |
Multifamily Garbage |
Commercial Garbage |
|---|---|---|---|---|
|
|
|
Percent |
Percent |
Percent |
|
Currently recyclable |
Newspaper, cardboard, and other recyclable paper |
6.3% |
11.3% |
10.5% |
|
Plastic bottles & Tubs |
1.1% |
2.8% |
2% |
|
|
Aluminum and tin cans |
1.1% |
2.2% |
1% |
|
|
Glass bottles |
2.6% |
3.6% |
2% |
|
|
Currently compostable |
Yard debris |
2.9% |
1.0% |
2% |
|
Food waste |
25.8% |
20.7% |
17% |
|
|
Food-soiled paper |
4.4% |
3.3% |
6% |
|
|
|
Subtotal |
44.1% |
44.9% |
41.4% |
|
Potentially recyclable |
Other metals, |
3.7% |
3.1% |
4.9% |
|
Wood and C&D debris |
3.2% |
7.1% |
13.1% |
|
|
Plastic film and bags |
7.0% |
4.9% |
6.6% |
|
|
E-waste |
0.1% |
2.4% |
0.3% |
|
|
Textiles and carpet |
5.7% |
8.3% |
2.8% |
|
|
|
Subtotal |
19.70% |
25.8% |
27.7% |
|
Non-recyclable |
Certain types of paper |
2.2% |
1.9% |
3.0% |
|
Many plastics |
5.5% |
4.9% |
7.60% |
|
|
Certain types of glass |
0.4% |
0.5% |
2.30% |
|
|
Other (special waste, diapers, misc.) |
28.1% |
22.1% |
18.00% |
|
|
|
Subtotal |
36.20% |
29.4% |
30.9% |
TRPC, 2021.