


CHAPTER 11 – Water Quality Program

The primary responsibility of the Water Quality Program is to ensure compliance with federal and state drinking water regulations and to help meet the Drinking Water City’s Goal 2:
Water is delivered at useful pressures, meets Safe Drinking Water Act standards, and it looks and tastes great.
This goal is consistent with the City’s Comprehensive Plan Goal GU7 and Policy PU7.2.
Water Quality Program objectives for 2015-2020 are:
• Maintain 100 percent compliance with all state and federal monitoring requirements.
• Maintain 100 percent compliance with all state and federal treatment requirements.
• Respond to customer water quality concerns promptly and maintain accurate reporting.
• Support the groundwater protection network with monitoring and data collection activities.
Since the 2009 Water System Plan, the Water Quality Program has met or surpassed all state and federal drinking water regulations, including implementing the Stage 2 Disinfection By-Products, Groundwater, and Lead and Copper Revision Rules. The Water Quality Program is designed to maintain past program successes by continuing to meet all state and federal monitoring and treatment requirements.
11.1 Water Quality Regulations
Chapter 2 gives an overview of the current and proposed federal and state regulations under which the City operates. The rules governing drinking water quality, deriving from the federal Safe Drinking Water Act (SDWA), are especially complex and extensive. In Washington they are implemented by the State Department of Health (DOH). Regulations currently in effect are summarized in Table 11.1.
|
SDWA Rule |
Parameters Affected1 |
EPA Rule Publication Date and Location in Chapter 246-290 WAC |
|---|---|---|
|
Monitoring - Source |
||
|
National Primary and Secondary Drinking Water Standards |
Bacteriological, IOC, VOC, SOC, Asbestos, Radionuclides, THMs, Lead/Copper, Phase II/V |
Phases I – V promulgated 1987 – 1992; Part 4, 300 - 320 |
|
Arsenic |
Arsenic |
February 2002, Part 4, 300 - 310 |
|
Groundwater Rule |
Fecal indicators in groundwater |
January 2007, Part 4, 300 - 320 |
|
Radionuclide Revision |
Radionuclides |
December 2000, Part 4, 300 - 320 |
|
The Third Unregulated Contaminant Monitoring Rule (UCMR) |
Various contaminants considered for potential future regulations |
UCMR 3 – April 2012 |
|
Monitoring – Distribution System |
||
|
Phase II Rule |
Asbestos |
January 1991, Part 4, Part 4, 300 - 320 |
|
Revised Total Coliform Rule |
Bacteriological |
Must be compliant by April 2016, unless DOH selects an earlier implementation date or receives an extension from EPA. |
|
Stage 2 Disinfection By-Products (DBP) |
TTHMs and HAA5 |
January 2006, Part 4, 300 - 320 |
|
Monitoring – Quality at the Tap |
||
|
Revised Short Term Lead and Copper Rule (LCR) |
Lead and copper |
June 1991, Part 4, 300 – 320; Revised September 2007 |
|
Administrative Requirements – Public Information |
||
|
Consumer Confidence Report Rule, Alternative Delivery Interpretative Memo |
Compliance results, violations, and variances |
January 2013, Part 7 Subpart B |
|
Public Notification (PN) |
Maximum contaminant levels exceeded |
May 2000, Part 7 Subpart A |
As shown, the rules cover two main areas, monitoring and public information. They include:
• Monitoring requirements
o Water at the source for bacterial contaminants, organic and inorganic compounds and radionuclides.
o Water in the distribution system for bacterial contaminants, chlorine residual, asbestos and the presence of disinfection by-products.
o Water at the consumer’s tap for lead and copper levels.
• Administrative requirements to notify the public of excessive contaminant levels and results of water quality testing.
Upon installation of the corrosion control facility at the Meridian Storage Tank site, the City will be in compliance with all state and federal drinking water requirements.
Recently Adopted Regulations
Since the 2009 – 2014 Water System Plan, three new federal rules and two minor revisions have come into effect: the Ground Water Rule, the Stage 2 Disinfection By-Products (DBP) Rule and the Third Unregulated Contaminant Monitoring Rule (UCMR 3); and revisions to the Consumer Confidence Rule and the Revised Total Coliform Rule. These rule changes and their implications for Olympia’s Drinking Water Utility are discussed below.
New Ground Water Rule
The Utility received DOH approval of its Triggered Monitoring Plan in March 2015. The monitoring plan outlined which sources will be tested for E. coli if a coliform positive sample is collected from the distribution system. The Utility also chose to conduct compliance monitoring, as defined under WAC 246-290-453(2) at Shana Park Well 11 (S10). The monitoring plan was updated when the McAllister Wellfield (S16) went online on November 20, 2014 (see Appendix 11-1).
New Stage 2 Disinfection By-Products Rule
The Utility has been sampling according to the Stage 2 Disinfection By-Products (DBP) Rule monitoring plan since its approval by DOH in October 2012. Under the Stage 2 DBP Rule, the number of monitoring locations is based on the total population served. The Stage 2 DBP Rule requires calculating compliance based on the running annual average of DBP levels from each individual monitoring location. Monitoring locations are in areas of the distribution system with the longest water retention time and the highest expected DBP levels. The total number of distribution monitoring locations increased from three to eight when the City was still using McAllister Springs (S01). However, when the City switched from McAllister Springs (S01) and to McAllister Wellfield (S16), the required monitoring locations went down to four. Maximum Contaminant Levels (MCLs) are below Stage 2 DBP Rule requirements at all four locations. See Appendix 11-3 for additional information regarding this sampling.
New Third Unregulated Contaminant Monitoring Rule (UCMR 3)
The US Environmental Protection Agency (USEPA) uses the Unregulated Contaminant Monitoring (UCM) program to collect data for suspected contaminants present in drinking water for which no health-based standards have been set under the Safe Drinking Water Act (SDWA). Every five years, USEPA reviews the list of contaminants, largely based on the Contaminant Candidate List. The UCMR 3 requires all systems serving more than 10,000 people to conduct assessment monitoring for 21 chemicals, including selected VOCs, metals and perfluorinated compounds. UCMR 3 monitoring was last completed in 2013. Low levels of four elements were detected during this sampling event: chromium, hexavalent chromium, strontium and vanadium. These elements occur naturally in the air, water, soil and food people come in contact with every day. The City will comply with any future regulations regarding these potential contaminants.
Revised Consumer Confidence Rule – Alternative Delivery
In 2012 USEPA reviewed the Consumer Confidence Report (CCR) Rule and addressed several issues including electronic delivery. In January 2013, USEPA published options for electronic delivery of the CCR. These options include an email with a direct link to the website, the CCR attached to an email, and the CCR as an imbedded image in an email. These options are an addition to the CCR requirements. The Utility uses a utility bill insert to inform its customers that the CCR is available and provides a direct link to a web address where they can obtain a copy.
Revised Total Coliform Rule (RTCR)
USEPA adopted the RTCR in February 2013. The rule better addresses the public health protection goals of the original 1989 federal Total Coliform Rule. The improvements provide more effective protection by reducing exposure to fecal contamination. It includes new requirements for seasonal water systems, high-risk smaller water systems, monitoring, assessments, corrective actions, and a change in the fecal indicator from total coliform bacteria to E. coli. DOH anticipates rule development and an effective date in 2016. The Utility will continue to monitor development of this rule and will comply with any required sampling, reporting and follow-up actions.
Along with updating Chapter 246-290 WAC to reflect requirements of the RTCR, DOH will also amend requirements for planning, emergency sources and disinfection.
Future Regulations
As of July 2014, six regulations were still in proposed regulatory status: the Carcinogenic Volatile Organic Compound Rule, DOH Drinking Water Laboratory Data Report Rule, Fourth Unregulated Contaminant Monitoring Rule, Long Term Lead and Copper Rule, Perchlorate and Radon rules.
Carcinogenic Volatile Organic Compound (cVOC) Rule
In February 2011, EPA identified cVOCs as the first group of contaminants to be regulated as a group (up to 16 cVOCs), as opposed to one at a time under the agency’s 2010 Drinking Water Strategy. The intent of regulating by group is to provide public health protection more quickly and to allow utilities to more effectively and efficiently plan for improvement. The Rule is delayed into 2015 and potentially even later. The Utility will continue monitoring the development of this rule and sample accordingly.
Drinking Water Laboratory Data Report Rule
DOH is revising the Drinking Water Laboratory Data Report Rule to remove duplication of the Washington State Department of Ecology’s (Ecology’s) requirements for Accreditation of Environmental Laboratories, Chapter 173-50 WAC. The anticipated rule effective date is 2015.
The proposed rule revision will no longer apply to the technical capability of a lab to perform drinking water analysis and will add reporting requirements to ensure consistent, reliable reporting of data. Certified labs will be required to report data within a timeframe and in a format specified in the rule.
The two primary laboratories used by the Utility are expected to comply with the new requirements, which will result in quicker notification of results to DOH and the Utility.
Fourth Unregulated Contaminant Monitoring Rule (UCMR 4)
The UCMR 4 is expected to be finalized in 2017 and, like UCMR 3, will include testing of suspected contaminants present in drinking water for which health-based standards have not been set under the Safe Drinking Water Act. Monitoring will most likely involve two sampling events, five to seven months apart, during one consecutive 12-month period.
Long-Term Lead and Copper Rule Revisions
In 2014, USEPA solicited stakeholder input on several issues surrounding this rule making:
• Partial lead service line replacement
• Revision of compliance for lead and copper sampling locations to focus more heavily on lead service lines
• Potential separate sampling locations for copper
• Definition of appropriate optimized corrosion control
The Utility does not have any lead service lines, and the corrosion control study done as part of the McAllister Wellfield project positions the Utility well for meeting future rule requirements.
Perchlorate Rule
USEPA is in the process of evaluating advice from the Science Advisory Board on approaches to derive a maximum contaminant level for perchlorate. A proposed rule is expected to be published in 2015. The Utility will continue to monitor the development of this rule, and will conduct sampling and any required reporting and follow-up actions.
Radon Rule
Radon exposure from drinking water is very small compared to radon in soil under homes. The proposed rule provides for a multimedia approach to address the public health risks from radon in drinking water and from indoor air, as well as setting a Maximum Contaminant Level (MCL) of 300 picoCuries per liter (pCi/L). EPA is also proposing an alternative approach to complying with the rule by allowing a higher alternative MCL of 4000 pCi/L when accompanied by a multimedia mitigation program to address radon risks in indoor air. (This would apply if DOH chooses to develop an EPA-approved enhanced indoor air program.)
Initial monitoring requirements would include four consecutive quarters of sampling at each entry point to the distribution system after treatment and/or storage. Routine monitoring would include annual monitoring, with the potential for reduced monitoring at a frequency of one sample every three years.
The Utility has insufficient monitoring data to determine whether any of its sources will be impacted by this rule. Uncertainty in what the MCL will be also makes it unclear how the Utility will be impacted by this rule. At a minimum, additional sampling is needed to determine which sources might be subject to this rule. Given the uncertainty as to when the rule will be finalized and what the requirements may be, the Utility will continue to keep track of developments with this regulation, but not take any action at this time.
11.2 Water Quality Program Activities
The primary activities of the Water Quality Program described in this section are:
• Monitoring
• Treatment
• Program management
Monitoring
The Utility performs monitoring for the purposes of compliance with federal and state requirements, surveillance of ambient groundwater quality, and ensuring reclaimed water disinfection.
Compliance Monitoring
The Utility routinely collects over 1,400 compliance samples a year to satisfy Safe Drinking Water Act requirements. This activity includes source monitoring and distribution system monitoring.
Monitoring frequencies for coliform, lead and copper, asbestos, disinfection byproducts, and chemicals (IOCs, VOCs, and SOCs) are done according to the most recent DOH Water Quality Monitoring Schedule.
All Olympia sources meet all primary MCLs. Exceedances associated with secondary MCLs for iron and manganese are discussed in the section titled Water Quality Exceedances.
Source Monitoring
Source monitoring includes sampling from the locations required by WAC 246-290-300 and to the schedule outline in the Code of Federal Registry (CFR) 40 and WAC 246-290-300, 310, and 320. Source monitoring includes both permanent and seasonal sources. The City is granted source monitoring waivers, where appropriate, based on low susceptibility to contamination. These waivers include:
• Three years for pesticides, and soil fumigants.
• Six years for VOCs.
• Nine years for IOC and herbicides.
• No monitoring required for dioxin, endothal, glyphosate, diquate and insecticides.
See Appendix 11-1 for the Triggered Source Monitoring Plan, Appendix 11-2 for the Coliform Monitoring Plan, and Appendix 11-3 for the Stage 2 Disinfection By-Products Monitoring Plan.
Distribution System Monitoring
The water in the distribution system is monitored for total coliform, disinfectant residual, disinfection by-products (total trihalomethanes and haloacetic acids), and asbestos. Field readings for pH and temperature are also collected.
Coliform: The number of total coliform samples required is based on the population served. As required, the Utility collects a minimum of 70 distribution system samples monthly from dedicated sampling stations. Each week, 22 samples are collected throughout the distribution system. The distribution samples are chosen to represent each pressure zone and the far ends of the system. See Appendix 11-1, Triggered Source Monitoring Plan, for additional information regarding routine, repeat and special purpose sampling, a system sampling map, and a discussion of what constitutes a violation. The Utility has maintained compliance with the Total Coliform Rule since its inception.
Disinfection By-Products: The Utility monitors for disinfection by-products from four dedicated sampling locations. These locations were selected based on a 960-hour trace simulation using Bentley WaterGems hydraulic modeling software. The Utility anticipates qualifying for reduced annual monitoring of sample locations once it documents, for at least a year on McAllister Wellfield (S16), that the locational annual average is less than or equal to 0.04 mg/L for total trihalomethanes and less than or equal to 0.03 mg/L for haloacetic acids. See Appendix 11-3 for additional information regarding this sampling.
Asbestos: About 40 percent of the City’s distribution system is asbestos-cement pipe, which can contribute fibers under corrosive water conditions. Asbestos cement piping is gradually being replaced with ductile iron. The Utility collects one monitoring sample every nine years from sections of the distribution system where asbestos is most likely to be found. The next monitoring round will be in 2018.
Monitoring at the Tap
DOH requires monitoring at the tap for lead and copper at a frequency based on when a home was built (between 1982 and 1987) and if it has copper plumbing. While McAllister Springs (S01) was Olympia’s primary source of water, DOH allowed a reduced schedule of sampling of once every three years. Now that the McAllister Wellfield (S16) has replaced the Springs, the Utility will monitor at the initial frequency of 60 sample sites twice in one year. Based on the lead and copper results, the Utility may be eligible for reduced monitoring the following year. Monitoring results from 2012 were below the action levels for both copper and lead, as shown in Table 11.2.
|
Contaminant |
Amount Detected |
Range |
Number of Sites Above Action Level1 |
|
|---|---|---|---|---|
|
Copper |
90% of the homes tested had copper less than 0.907 ppm |
0.036-1.26 ppm |
0 |
0 |
|
Lead |
90% of the homes tested had lead less than 6 ppb |
0-15 ppb |
0 |
0 |
Groundwater Protection Monitoring
Groundwater monitoring is part of the Utility’s Source Protection Program (Chapter 7). This monitoring tracks background aquifer water quality and groundwater level trends using samples from a network of monitoring wells, which are different from City production wells. See the current groundwater monitoring in Table 11.3 for McAllister Wellfield, Table 11.4 for East Olympia and Table 11.5 for West Olympia. Table 11.6 shows which wells have data loggers that continuously measure water levels to track aquifer capacity and the effects of pumping and drought.
The City has three groundwater monitoring networks:
• McAllister Wellfield (S16)
• East Olympia for Shana Park Well 11 (S10) and Indian Summer well 20 (S12)
• West Olympia for Allison Springs Well 13 (S09) and Well 19 (S11)
Sample results show rising nitrate levels in the Shana Park area. All other sample results for volatile organics, inorganic chemicals, synthetic organic chemicals and herbicides are non-detectable or well below the maximum contaminant level for all three networks. See Chapter 7, Section 7.4 for more information about the Utility’s groundwater monitoring network.
|
Owner Name |
Semi-Annual Sampling Events1 |
|---|---|
|
Nitrate |
|
|
City of Olympia, MW-2S |
1,2,3 |
|
Washington Water Service Co. Holiday Ranchettes, MW-HolR |
Obtain from Washington Water Service Co. |
|
Washington Water Service Company Triple “G”, MW-TrpG |
Obtained from Washington Water Service Co. |
|
Private, Peterson, MW-Pete |
3 |
|
Private, Troche, MW-Troc |
1,3 |
|
Private, St. Clair Vistas, MW-StCl |
3 |
|
Scheduled as follows: |
1 = 1st Quarter (January – March), |
2 = 2nd Quarter (April-June), |
|
|
3 = 3rd Quarter (July – September), |
4 = 4th Quarter (October-December). |
|
Owner’s Name |
Semi-Annual Sampling Events1 |
|
|---|---|---|
|
Nitrate |
Nitrogen-15 Isotope1,2 |
|
|
City of Olympia, S04 |
1,3 |
1,3 |
|
City of Olympia, Indian Summer Well 20, S12 |
1,2,3,4 |
1,3 |
|
City of Olympia, Shana Park Well 11, S10 |
1,3,4 |
1,3 |
|
City of Olympia, MW-25 |
1,3 |
1,3 |
|
City of Olympia, MW-26 |
1,3 |
1,3 |
|
City of Olympia, MW-27 |
1,3 |
1,3 |
|
1. Scheduled as follows: |
1 = 1st Quarter (January – March), |
2 = 2nd Quarter (April-June), |
|
|
3 = 3rd Quarter (July – September), |
4 = 4th Quarter (October-December). |
||
|
2. Collect isotope samples twice a year for two years and then re-evaluate the need to continue. |
|||
|
Owner Name |
Semi-Annual Sampling Events1 |
|---|---|
|
Nitrate |
|
|
City of Olympia, MW-18 |
1,3,4 |
|
City of Olympia, MW-22 |
1,3,4 |
|
City of Olympia, MW-23 |
1,3 |
|
City of Olympia, MW-24 |
1,3 |
|
City of Olympia, Allison Springs Well 13 (S09) |
3,4 |
|
City of Olympia, Allison Springs Well 19 (S11) |
3,4 |
|
Scheduled as follows: |
1 = 1st Quarter (January – March), |
2 = 2nd Quarter (April-June), |
|
|
3 = 3rd Quarter (July – September), |
4 = 4th Quarter (October-December). |
|
Owner Name |
|
|---|---|
|
City of Olympia, MW-2D |
McAllister Wellfield |
|
Nisqually Tribe, MW-17 |
McAllister Wellfield |
|
City of Olympia, Lake St. Clair |
McAllister Wellfield |
|
City of Olympia, MW-25 |
East Olympia |
|
City of Olympia, MW-26 |
East Olympia |
|
City of Olympia, MW-27 |
East Olympia |
|
City of Olympia, MW-18 |
West Olympia |
|
City of Olympia, MW-22 |
West Olympia |
|
City of Olympia, MW-23 |
West Olympia |
|
City of Olympia, MW-24 |
West Olympia |
Reclaimed Water Monitoring
The City shares responsibilities for compliance with requirements of Ecology’s reclaimed water permit issued to the LOTT Clean Water Alliance (which includes Lacey, Olympia, Tumwater and Thurston County). The two primary water quality issues are ensuring adequate cross connection control and maintaining a detectable amount of chlorine residual. Because the City owns the pipeline that provides reclaimed water to the Port of Olympia, monitoring for detectable total chlorine residual is required monthly during the irrigation season. Also, an annual inspection of both the south and north reclaimed water pipe lines is done by the City’s Cross Connection Control Specialist to verify no cross connections have occurred. See Chapter 6 for details on the City’s Reclaimed Water Program.
Analytical Services
Following are the certified water quality laboratories the City uses for biological and chemical testing and analysis. In case of an emergency or for after-hours services, Dragon Analytical Laboratory is used for both bacteriological and chemical analysis.
Bacteria Testing Laboratory
Dragon Analytical
530A RonLee Lane NW
Olympia, WA 98502
360.866.0543
360.866.0556 fax
360.970.5770 after hours
Chemical Testing Laboratory
Edge Analytical Laboratory
1620 S Walnut
Burlington, WA 98223
800.755.9295
360.757.1402 fax
Water Quality Exceedances – Iron and Manganese
The City has excellent water quality when it comes to meeting primary drinking water standards that affect health. There are also secondary drinking water standards, which cover things like iron and manganese. The presence of iron and manganese in the drinking water is from minerals naturally occurring in the groundwater. The secondary standard is exceeded at two Olympia wells, creating aesthetic concerns such as taste, odor and staining on fixtures, but there are no health concerns.
The Hoffman Well 3 (S08) is a seasonal source and rarely used due to high levels of iron (0.4 mg/L – 0.89 mg/L) and manganese (0.103 mg/L – 0.162 mg/L). If it were to become a permanent source, treatment would be required.
The Kaiser Well 1 (S03) is an emergency source and was physically disconnected from the water system on June 23, 2015. It also has iron above the secondary MCL of 0.3 mg/L (0.65 mg/L).
Treatment
The City provides mandatory and optional treatment to its sources, as described below. Table 11.7 summarizes current and future treatment methods of chlorine disinfection and aeration for corrosion control.
|
Location |
Equipment |
Treatment Type |
|---|---|---|
|
Allison Springs Well 13 (S09) and Well 19 (S11) |
Chlorine injection Chlorine analyzer pH meter |
Chlorine gas Aeration tower |
|
Indian Summer Well 20 (S12) |
Chlorine Injection Chlorine analyzer pH meter Water softener |
On-site sodium hypochlorite generation |
|
McAllister Wellfield (S16) |
Chlorine injection Chlorine analyzer pH meter |
Chlorine gas Aeration towers at Meridian Storage Tank site 1 |
|
Shana Park Well 11 (S10) |
Chlorine injection Chlorine analyzer pH meter |
Chlorine gas Aeration tower |
Aeration – Corrosion Control – Water Quality Parameter Optimization
The City is required under the Lead and Copper Rule (LCR) to sample for lead and copper at selected tap sites throughout the distribution system. The City has been in compliance with the LCR since 1996 when the Utility installed aeration treatment at Allison Springs Well 13 (S09) and Well 19 (S11) and Shana Park Well 11 (S10). The purpose of aeration is to remove carbon dioxide gas dissolved in the water, thereby increasing the pH and reducing copper corrosion.
In February 2011, DOH notified the Utility that because of a change in category under the LCR, Olympia’s water system is now designated as a large system (i.e. it provides water to over 50,000 customers). This change requires optimal water quality parameters on sources with treatment. This means the Utility needs to operate all of its aeration treatment facilities so the pH will be “optimized” and be above 7.0. This keeps the water from being corrosive and leaching lead and copper from plumbing systems. System-wide optimization for corrosion control is also desired. The City submitted data to DOH for Allison Springs Well 13 (S09) and Well 19 (S11) and Shana Park Well 11 (S10). A minimum pH of 7.0 is assigned as the optimal water quality parameter for the entry points at these wells.
As part of the McAllister Wellfield corrosion control study, Kaiser Well 1 (S03) and Indian Summer Well 20 (S12) were also evaluated by the engineering firm of Gray and Osborne. The results showed that Indian Summer Well (S12), with a relatively high pH of approximately 7.6, is already above the 7.5 pH target for the distribution system and is considered optimized for corrosion control. Kaiser Well 1 (S03) produces water with a low pH at 6.4 – 6.6 and must be treated. The study indicates the target pH in the distribution system of 7.5 or greater is expected. DOH approved the corrosion control study (ODW Project #13-0611) in August 2013.
The Utility compared the life-cycle cost of aeration towers and adding caustic soda at the Kaiser Well (S03). Given the high capital, operational and maintenance costs of treatment, and the low production capacity (360 gpm) of the well, the City designated it as an emergency source and will leave it untreated.
Disinfection with Chlorine Gas
The City’s groundwater sources are not required to be chlorinated. However, the Utility is using disinfection at most wells to prevent a reduction of the distribution system chlorine residual, which would occur when treated and non-treated water are blended in the distribution system. The only exception is the Shana Park Well 11 (S10), which is required to show a chlorine residual of 1.07 mg/L to achieve a contact time (CT) of six or greater.
Disinfection with On-Site Hypochlorite Generation
The disinfection treatment used at Indian Summer Well 20 (S12) is on-site hypochlorite generation. This type of treatment was chosen over gas chlorination due to concern about possible gas chlorination leaks and exposure of the Indian Summer community to chlorine gas. See Chapter 13 for the schedule for replacing the on-site hypochlorite generation system with a hypo-chlorination treatment facility.
Filtration – Iron and Manganese Removal
As mentioned above under Water Quality Exceedances, water from Hoffman Well 3 (S08) contains iron and manganese at concentrations exceeding secondary MCLs. In 2007, a pilot test was conducted using a trailer-mounted pilot-scale filtration plant at the well, using pyrolusite (manganese oxide) as the filtration media. Iron dropped from 0.46 mg/L to 0.13 mg/L (a 73 percent removal rate) while manganese dropped from 0.15 mg/L to 0.015 mg/L (a 95 percent removal rate). See Chapter 13 for scheduled installation of iron and management treatment removal.
Program Management
Water quality program management includes responding to complaints, generating reports and keeping records.
Responding to Customer Complaints
Typically the Water Quality Program receives about 20 complaints a year, primarily reports of sediment in the water, low pressure, and taste and odor concerns.
The Water Quality Specialist responds to water quality complaints. Depending on the nature of the complaint, other Utility staff may respond, such as the Water Quality Monitoring Assistant, the Cross Connection Control Specialist or Water Operations staff.
Water quality complaints are investigated by phone or field visits, and the collected information is entered into the Utility’s Water Quality database. The field response includes measuring pH, temperature and chlorine residual. If illness is suspected, staff collects a bacteriological sample and suggests that the customer call his/her primary health care provider.
Record Keeping and Reporting
Water quality and operational records are maintained according to WAC 246-290-480 and 485, as shown in Table 11.8. All records bear the signature of the operator in charge of the water system or the operator’s representative. These records are available for inspection by DOH and will be sent to DOH if requested. Records are kept digitally, on paper, or both depending on the data.
Reports are submitted as required by WAC 246-290-480(1)(a) and summarized in Table 11.9. Most records are kept in hard copy, although water quality results are kept in both hard copy and electronic format. Records entered into the Water Quality database are backed up each night.
|
Type |
Frequency |
Description |
Other |
|---|---|---|---|
|
Three-year retention cycle |
|||
|
Chlorine residuals |
Daily |
SCADA system records data on flow, pH, chlorine residual and temperature of sources. |
Manual readings of pH, temperature and chlorine residual taken as part of coliform distribution system sampling and entered into the Water Quality database. |
|
Other information as specified by DOH |
N/A |
||
|
Other operational or analytical records |
N/A |
||
|
Public Notices and Certifications |
N/A |
In response to violations of primary drinking water standards, including Tier 1 violations or DOH orders. Tier 1 violations are those that can cause acute illness, a waterborne disease outbreak or inadequate treatment. Tier 1 violations require notification to the public within 24 hours. |
Public notices are kept electronically and a hard copy filed in the DOH file located in the Water Quality office. |
|
Violations of primary drinking water standards |
N/A |
Records of actions taken by the City to correct the violation, including any public notifications. |
|
|
Water treatment performance |
Daily |
Includes type and quantity of chemicals used, amount of water treated and results of analyses. |
|
|
Five-year retention cycle |
|||
|
Bacteriological analysis |
Monthly |
Laboratory results are entered into the Water Quality database. |
At the end of each calendar year, all bacterial analyses slips are archived. The destruction date is labeled on each box. |
|
Invalidation of groundwater source sample |
N/A |
||
|
Lowest residual disinfectant concentration |
N/A |
Record the date and duration of any failure to maintain DOH-prescribed minimum residual disinfectant concentration for more than four hours. |
|
|
Ten-year retention cycle |
|||
|
Source meter readings |
Monthly |
|
|
|
Sanitary survey or special purpose investigation reports |
Once every three years or as needed |
An on-site review of the water source, facilities, equipment, operation and maintenance of a public water system for the purpose of evaluating the adequacy of water system to produce and distribute safe drinking water. |
Reports are kept in a fireproof file cabinet. |
|
Minimum disinfection residual |
N/A |
DOH specified minimum disinfection residual. |
|
|
Corrective action |
N/A |
Record of each corrective action taken that is associated with a primary drinking water standard. This includes any related public notifications. |
|
|
Other |
|||
|
Project reports, construction documents, inspection reports and related drawings |
In perpetuity |
A document that describes why a project is being proposed and includes engineering design calculations showing how the project will meet its objectives. |
Project reports and construction documents are retained and archived through the Public Works Engineering department. |
|
Monitoring Plans |
N/A |
Keep for the same period of time as the records of analyses taken under the plan are required to be kept for bacteriological or chemical parameters. |
|
|
Type |
Requirement |
Description |
|
Bacteriological |
Monthly |
Notify DOH within 10 days of being notified by the laboratory of coliform positive results and by close of business when notified by the laboratory of fecal coliform or E. coli positive results. If the purveyor is notified of the results after normal close of business, purveyor to notify DOH before the end of the next business day. |
|
Correction Action |
30 days |
Notify DOH within 30 days of completing correction action(s). |
|
Disinfection residual |
Monthly |
Report monthly samples taken as part of total coliform distribution monitoring. |
|
Lead and Copper |
Semi-annual |
Submit daily pH readings for Allison Springs and Shana Park Corrosion Control Facilities |
|
Monitoring waivers |
During each monitoring cycle or as directed by DOH |
In 2012, DOH updated its model for granting organic waivers and applied monitoring waivers to all eligible sources. |
|
Primary violation that is a Tier 1 |
24 hours |
Notify DOH of any Tier 1 violation: Distribution system sample violation when fecal coliform or E. coli are present. Failure to test for fecal coliform or E. coli after initial total coliform distribution system sample tests positive. Nitrate, nitrite or total nitrate and nitrite maximum contaminant level violation or failure to take a confirmation sample. Waterborne disease outbreak or other waterborne emergency. Detection of E. coli, enterococci, or coliphage in a groundwater source sample. Other violations or situations determined by DOH. |
|
Primary violation that is not Tier 1 |
48 hours |
Notify DOH of failure to comply with any national primary drinking water regulation, including failure to comply with monitoring requirements. |
|
Reports |
Monthly |
Chlorination reports due before the tenth day of the following month (Shana Park). |
|
Reports |
Biannual |
Water quality parameter report (LCR compliance). Due January 10th and July 10th of each year for the preceding six-month monitoring period. |
|
Source meter readings |
Made available to DOH upon request |
SCADA system readings are imported into the Water Quality database. |
|
Unregulated contaminant monitoring |
Send copy to DOH within 30 days of receiving results |
Contaminants suspected of being present in drinking water, but which do not have health-based regulatory standards set under the Safe Drinking Water Act. UCMR 3 monitoring occurred in 2013. |
|
Water Facilities Inventory Form |
Update annually and within 30 days of any changes |
A form summarizing characteristics of the water system. |
11.3 Emerging Issues
This section addresses several issues that will affect the City’s Water Quality Program during 2015 - 2020:
• Water quality impact of the future Briggs Well water
• Water quality impact of the future Brewery Wellfield water
• Pharmaceutical and personal care products
• Elevated nitrate in Shana Park Well 11 (S10)
Water Quality Impact of Future Briggs Well
Water quality from a test well drilled at Briggs Village indicates the aquifer contains manganese in concentrations at or above the recommended secondary MCL. Because the City has secured adequate water rights from other sources to meet supply needs for at least 50 years, the timing to develop the Briggs Well is uncertain. Ecology has approved extending the Notice to Construction until 2019. During this planning period, the Utility will further evaluate the timing for developing this well, as well as the potential impacts the water quality may have (see Chapter 4).
Water Quality Impact of Future Brewery Wellfield
RH2 Engineering, Inc. was retained by the three cities of Tumwater, Lacey and Olympia to evaluate the infrastructure and assess the water quality of the wellfield at the former Olympia Brewery. This evaluation is ongoing and also includes the potential advantages of creating a regional treatment facility that would serve not only the Brewery wells but other sources owned by Tumwater (see Chapter 4). Planning for a future treatment facility for the Brewery wells presumably will address corrosion control requirements as well as potential iron and manganese. The Utility anticipates no impact to Olympia’s water quality from the Brewery water.
Pharmaceutical and Personal Care Products (PPCPs)
PPCP refers generally to any product used by individuals for personal health or cosmetic reasons, or by agribusiness to enhance the growth or health of livestock. PPCPs include thousands of chemical substances, such as prescription and over-the-counter therapeutic drugs, veterinary drugs, soaps, shampoos, fragrances, lotions and cosmetics. Research continues to determine the extent of ecological harm and potential human health. So far, scientists have found no evidence of adverse human health effects from PPCPs in the environment. EPA uses the Contaminant Candidate List process as a way to evaluate whether a contaminant should be regulated under the Safe Drinking Water Act. This list includes contaminants such as pesticides, chemicals used in commerce, waterborne pathogens, disinfection byproducts, pharmaceuticals and biological toxins. The Utility will continue to monitor national discussion about PPCPs.
Elevated Nitrate in Shana Park Well 11 (S10)
Levels of nitrate in the Shana Park Well 11 (S10), the City’s shallowest source well, are a concern. This well is highly vulnerable to nitrate loading, probably from fertilizers and possibly septic systems in the area. The expansion of the monitoring well network by two wells in 2013 will help provide advance notice of nitrate in groundwater within the six-month and five-year time-of-travel capture zones (see Chapter 7). The City will prioritize collection of a nitrate sample from the source as soon as possible after annual start-up. For the next two years, nitrate and nitrogen-15 isotope samples will be collected twice a year from the four monitoring wells; nitrogen-15 isotope samples will also be collected at Shana Park Well 11 (S10) at the same intervals. Staff will re-evaluate the need to continue collecting isotope samples after interpreting the two years of nitrate levels and nitrate-isotope ratios.
Figure 11.1 shows the nitrate trends for all the City’s permanent and seasonal sources. The initial nitrate results from the McAllister Wellfield sources -- TW-22 (S13), PW-24 (S14), and PW-25 (S15) -- were 0.33 mg/L, 0.37 mg/L, and 0.43 mg/L respectively. The maximum contaminant level for nitrate is 10 mg/L.
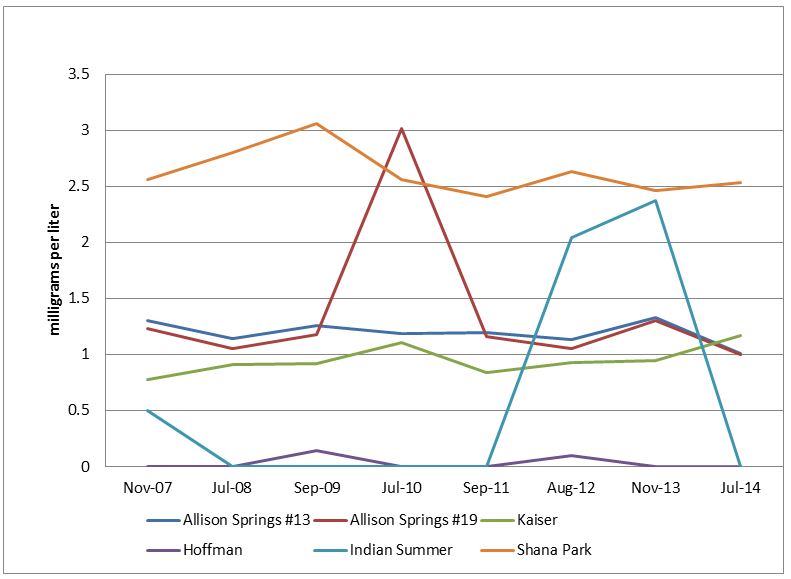
View Figure 11.1 Source Nitrate Trends.
11.4 2015-2020 Water Quality Program
Water Quality Program strategies and actions are designed to help meet the Drinking Water City’s Goal 2:
Water is delivered at useful pressures and meets Safe Drinking Water Act standards, and it looks and tastes great.
To continue meeting Goal 2 and maintain past program success, the Water Quality Program for 2015-2020 has four objectives, listed below with planned implementation strategies.
Objective 2.A Maintain 100 percent compliance with all state and federal monitoring requirements.
Strategy 2A.1 Continue compliance monitoring for source, distribution and tap locations according to required timelines, with analysis performed by accredited laboratories.
Strategy 2A.2 Continue groundwater protection monitoring to alert staff about contamination that may be migrating toward drinking water sources.
Strategy 2A.3 Continue tracking developments associated with future state and federal monitoring requirements.
Strategy 2A.4 Continue close monitoring of nitrate levels in Shana Park Well 11 (S10). If levels begin to increase, evaluate treatment or development of a new source.
Performance Measures
1. Collect 70 monthly system samples. Increase monthly system samples per DOH requirements (based on population).
2. Collect quarterly DBP samples (two samples per location) from four sampling locations.
3. Collect an annual nitrate/nitrite sample from all of the City’s permanent sources.
4. Collect lead and copper, VOC and SOC samples, based on the most current DOH Water Quality Monitoring Schedule.
5. Collect UCMR 4 samples according to the required federal schedule.
6. Collect semi-annual nitrate and nitrogen-15 isotope samples from Shana Park Well 11 (S10) for a period of two years. Evaluate results and determine next course of action.
Objective 2.B Maintain 100 percent compliance with all state and federal treatment requirements.
Strategy 2B.1 Maintain a minimum free chlorine residual of 1.07 mg/L at Shana Park Well 11 (S10) in order to maintain compliance with CT6.
Strategy 2B.2 Maintain a minimum pH of 7.0 at Shana Park Well 11 (S10), Allison Springs Well 13 (S09) and Well 19 (S11); and a minimum pH of 7.5 at McAllister Wellfield (S16) and Indian Summer Well 20 (S12).
Strategy 2B.3 Verify minimum chlorine residual of 0.2 mg/L in the distribution system by measuring residual chlorine levels, as part of monthly system coliform sampling.
Performance Measures
1. Submit monthly to DOH the Shana Park Chlorination and Groundwater Rule reports documenting adequate chlorine contact time is maintained.
2. Submit biannually to DOH the Water Quality Parameter Report due on January 10th and July 10th documenting minimum pH levels are maintained.
3. Check daily with each distribution system sample collection that chlorine residuals are at or above 0.2 mg/L.
Objective 2.C Respond to customer water quality concerns promptly and maintain accurate reporting.
Strategy 2C.1 Investigate, validate and respond to water quality complaints by phone call, email and/or site visit.
Strategy 2C.2 Meet all reporting and record retention deadlines.
Performance Measures
1. Respond to all water quality complaints by the end of the following business day.
2. Ensure the various record retention schedules and other state and federal reporting requirements are met.
3. Review and update all monitoring plans annually.
Objective 2.D Support the groundwater protection network with monitoring and data collection.
Strategy 2D.1 Continue sampling groundwater protection monitoring wells in all Drinking Water Protection Areas.
Strategy 2D.2 Continue maintaining data loggers in all Drinking Water Protection Areas.
Performance Measures
1. Collect initial SOC, VOC, IOC and bacteria samples on all new monitoring wells.
2. Collect semi-annual nitrate and nitrogen-15 isotope samples from the groundwater monitoring wells designated for this sampling.
3. Download data loggers from designated groundwater monitoring wells on a quarterly basis.
11.5 Implementation & Staffing
This section includes current staff, a discussion of additional staffing needed to support the planned program and projects included in the Capital Improvement Program.
Current Staffing
Water Quality Program staff members who collect water samples and make adjustments to treatment processes have appropriate Water Works Certifications required by DOH (see Chapter 12, Section 12.1). At the end of 2013, the Utility was reorganized to reassign cross connection control and meter reading activities from the Water Quality Section to the Water Operations Section. The Water Quality Program therefore currently consists of 5.75 FTEs:
• Water Monitoring Assistant (1.0 FTE)
• Water Quality Specialist (1.0 FTE)
• Two Senior Program Specialists (groundwater protection/reclaimed water and water conservation) (1.75 FTE)
• Program Assistant (water conservation) (1.0 FTE)
• Water Quality Program and Planning Supervisor (1.0 FTE)
The Water Quality section encompasses four distinct program areas. Below is a brief description of activities by job classification:
1. Water Monitoring Assistant – primary staff member conducting compliance monitoring for all sources, as well as for the Olympia Artesian Well and the Olympia McAllister Group B water system. Supports surveillance monitoring associated with the Groundwater Protection Program.
2. Water Quality Specialist – prepares monthly, quarterly and annual state reports and is the primary staff member conducting surveillance monitoring associated with the Groundwater Protection Program. Monitors and adjusts water treatment systems.
3. Senior Program Specialist (Water Conservation) – implements the program, including compliance with water use efficiency requirements. See Chapter 5 (Water Use Efficiency) for program details.
4. Senior Program Specialist (Reclaimed Water and Groundwater Protection) – implements these programs; responsibilities include expanding monitoring well networks, updating the Groundwater Report, and ensuring End User Agreements for reclaimed water are maintained. See Chapters 6 (Reclaimed Water) and Chapter 7 (Groundwater Protection) for details.
5. Program Assistant (Water Conservation and Cross Connection Control) – provides support for both these programs, including activities associated with annual backflow testing notifications, phone calls, data entry, compliance status updates and processing of water conservation related rebates.
6. Program and Planning Supervisor – responsible for ensuring compliance with federal, state and local drinking water quality monitoring and treatment standards. Provides direction, mentoring and facilitation of various teams. Responsible for budget planning and expenditures.
Future Staffing
The following increases in monitoring activities will be needed during this planning period:
• Water quality parameter monitoring (lead and copper optimization) and reporting.
• Eighty (80) monthly system coliform samples due to anticipated population growth.
• New groundwater protection monitoring wells and associated sample collection and water level readings.
New monitoring and treatment activities will be absorbed by current staffing. However, this will result in less support for surveillance monitoring. Staffing needs for the Groundwater Protection Program will be revisited during this planning period.
Water Quality Projects
The projects listed below are included in the 2015-2020 Capital Improvement Program (CIP) presented in Chapter 13. Project-level cost estimates and the anticipated implementation schedule for each project are in Table 13-2.
• Design and construction of corrosion control for the McAllister Wellfield
• Replace the Indian Summer Well on-site chlorine generation system with a more reliable hypochlorite system
• Shana Park water quality study
An additional project is included for implementation after 2020:
• Design and construction of hypo-chlorination and iron/manganese removal for the Hoffman Well (S08)
11.6 Levels of Service
With the 2009 – 2014 Water System Plan, the Utility developed its first formal Level of Service (LOS) standards. Previously, the Utility relied on informal standards, based on professional experience and system history, to evaluate whether the system was performing adequately. The new LOS standards were developed for:
• System performance (including service interruption due to breakage, pressure loss, and system reliability).
• Sustainability (energy efficiency).
• Customer service (response to water quality and service-related complaints).
The customer service LOS for the Water Quality Program is:
• Staff will respond to low pressure and water quality complaints by the end of the following business day.
See Chapter 12 for more on the Utility’s LOS and details on those related to Operations and Maintenance.