


CIRCULATION ELEMENT
Adopted by Res. 2014-141, passed November 19, 2014.
I. Introduction
This Circulation Element describes existing circulation, infrastructure, and utility systems in Solana Beach and establishes a plan for increasing multi-modal transportation opportunities. Multi-modal transportation refers to the many different methods of travel including vehicular, pedestrian, bicycle, and transit. This Element is intended to provide for a balanced circulation system that will support travel demands associated with land uses in the Land Use Element while maintaining a high quality of life for the residents of Solana Beach and all roadway users.
A. Content
The Circulation Element is required by state law. As specified in Government Code Section 65302(b), the Circulation Element consists of the general location and extent of existing and proposed major thoroughfares, transportation routes, terminals, any military airports and ports, and other local public utilities and facilities, all correlated with the Land Use Element of the General Plan. In addition, pursuant to the Complete Streets Act (Assembly Bill 1358) that was passed in 2008, the Circulation Element must also plan for a balanced, multimodal transportation network that meets the needs of all users of streets, roads, and highways for safe and convenient travel in a manner that is suitable to the local context of the community. “Users of streets, roads, and highways” means bicyclists, children, persons with disabilities, motorists, movers of commercial goods, pedestrians, users of public transportation, and seniors. This Circulation Element provides new street typologies based on these complete street principles.
B. Purpose
This Circulation Element is intended to better balance the needs of all roadway users by making enhancements to existing circulation facilities to establish a comprehensive multi-modal system that facilitates more walking, cycling, and transit use. Solana Beach is almost completely built-out, with a well-established roadway system that originally was designed primarily to serve vehicular traffic. Although there are existing facilities for bicycle, pedestrian, and transit travel, the purpose of this Element is to build upon the current roadway system and provide additional multi-modal connections without excluding the automobile. Other public infrastructure and utility systems, such as water, sewer, and drainage facilities, are located within or along Solana Beach roadways. Therefore, this Element also describes those systems and includes goals and policies aimed at maintaining adequate performance levels. In addition, this Element is intended to preserve the community’s character, enhance alternatives to automobile travel, and ensure an adequate supply of vehicular and bicycle parking to meet the needs of residents and visitors.
C. Key Issues
Solana Beach is a charming coastal community that attracts many visitors and beachgoers. Because of its location along the Pacific Ocean, the Del Mar Fairgrounds, and Interstate 5 (I-5), several key issues impact circulation planning in the City.
The Del Mar Fairgrounds and race track generate significant traffic and contribute to congestion on I-5, Highway 101, and the Lomas Santa Fe interchange. Traffic and parking needs within Solana Beach also increase during the tourist seasons, particularly around beach access areas. This results in undesirable cut-through traffic and parking problems in residential neighborhoods. Although visitor activities contribute to these adverse impacts on the community, they also bring valuable economic opportunities to Solana Beach. Efforts to maximize the benefits and reduce the negative effects are ongoing.
Solana Beach residents also experience traffic congestion near schools during the morning drop off and afternoon pick up hours. Because the local school districts have discontinued busing services, more parents now drive their children to school. The City continues to look for and provide suitable alternative transportation options for students.
There are east-west connectivity limitations in Solana Beach. I-5 bisects through the middle of the community and Lomas Santa Fe Drive is the only roadway within city limits that provides access across the freeway via an underpass. The railroad tracks located just east of Highway 101 also restrict east-west travel, as railroad crossing locations are limited. However, the City has taken steps to significantly minimize this barrier, such as through grade separation (the tracks were lowered in 1999) and the construction of pedestrian overpasses.
Residents sometimes express concerns regarding the high speed of vehicular traffic throughout the city as well as cut-through traffic in residential neighborhoods. This signifies a need for additional traffic calming. Traffic calming refers to methods for slowing down vehicular traffic with measures such as raised medians, chicanes, bulb-outs, speed bumps, raised crosswalks, and traffic circles.
Although Solana Beach has been and continues to upgrade transportation and other infrastructure facilities, the ability to make improvements is constrained by a number of factors, including: 1) financial limitations, 2) the fact that Solana Beach is nearly built-out and adequate right-of-way may not be available or attainable, and 3) residents have a desire to maintain the existing character of the community and may be resistant to change.
Coupled with these local issues, several key State and regional planning efforts and legislative actions over the past decade have redefined the way community transportation planning is carried out. An important unifying theme is to achieve a more balanced, multi-modal transportation system that allows people with varying physical abilities and economic circumstances to accomplish daily activities via modes other than a single-occupant vehicle. Not everyone has an automobile or the desire or ability to drive. For example, children and youth, the elderly, persons with disabilities, and those who simply cannot afford a vehicle should be able to move about the city by way of alternative convenient, safe, and reliable transportation options that provide them with freedom and independence.
Another part of the movement to reduce reliance on automobiles comes from an increasing awareness of global climate change and how human activity is contributing to the greenhouse effect. Accelerated fossil fuel combustion and deforestation since the start of the industrial revolution have exponentially increased concentrations of greenhouse gases in the atmosphere. Vehicle emissions are one of the largest contributors to greenhouse gases. Because of the strong link between land use decisions and vehicle miles traveled, local governments can play a leading role in reducing emissions by encouraging walkable, compact, and infill development and promoting alternative modes of transportation.
One key piece of legislation passed was the Global Warming Solutions Act (AB 32), which was signed by Governor Schwarzenegger in 2006. AB 32 requires the California Air Resources Board (CARB) to adopt rules and regulations that would reduce statewide greenhouse gas emissions to 1990 levels by 2020.
Another important legislative action was the adoption of the California Complete Streets Act (AB 1358), in September of 2008. The goal of AB 1358 is to fulfill the commitment to reduce greenhouse gas emissions, make the most efficient use of urban land and transportation infrastructure, and improve public health by shifting from short trips in the automobile to biking, walking, and using public transit. This legislation amended Government Code Section 65302(b), requiring that any substantial revision to the Circulation Element plan for a balanced, multi-modal transportation network that meets the needs of all users of streets, roads, and highways.
Also in September of 2008, Governor Schwarzenegger signed into law the Sustainable Communities and Climate Protection Act (SB 375). The purpose of SB 375 is to align regional transportation planning efforts, regional greenhouse gas reduction targets, and land use and housing plans to reduce greenhouse gas emissions by promoting higher density, mixed-use developments around mass transit hubs. The bill requires metropolitan planning organizations in the state to formulate a “sustainable communities strategy” as part of their regional transportation plans, specifically identifying how each region will achieve targeted reductions in greenhouse gas emissions from automobiles and light trucks.
Although SB 375 went into effect fairly recently, the basic concepts of the sustainable communities strategy have been core components of transportation planning in the San Diego region for many years. For example, the San Diego Association of Governments (SANDAG) adopted a Regional Comprehensive Plan referred to as San Diego Forward - The Regional Plan in 2004, which integrates land use, transportation, and housing planning and directs new growth to already urbanized areas. SANDAG incentivizes projects located in mixed-used nodes served by public transit and high quality bicycle and pedestrian improvements through grant funding programs.
In September 2013, the California state legislature adopted SB 743 which requires the development of a transportation metric other than Level of Service (LOS) which is typically based upon vehicle delays at intersections during peak travel periods. The State Office of Planning and Research will be required to amend the state’s CEQA Guidelines to provide an alternative to LOS for evaluating transportation impacts.
In addition, SANDAG’s 2050 Regional Transportation Plan (RTP), adopted October 28, 2011, serves as the regional transportation planning tool for the County. It is a long-range advisory vision plan for transit, rail, and bus services, express or managed lanes, highways, local streets, bicycling, and walking. The RTP seeks to guide the San Diego region toward a more sustainable future by integrating land use, housing, and transportation planning to create communities that are more sustainable, walkable, transit-oriented, and compact. The RTP also includes a Sustainable Communities Strategy (SCS) consistent with SB 375 that details how the region will reduce greenhouse gas emissions to state-mandated levels over time. The vision described in the RTP is intended to support a prosperous economy; promote a healthy and safe environment, including climate change protection; and provide a higher quality of life for all San Diego County residents by better linking jobs, homes, and major activity centers. This will enable more people to use transit, walk, and bike; efficiently transport goods; and provide fast, convenient, and effective transportation options for everyone.
Locally, Solana Beach has also taken many steps to reduce greenhouse gas emissions and become a more sustainable community. For example, the City Council adopted a resolution in 2007 to sign the US Conference of Mayors Climate Protection Agreement. By signing this agreement, the Solana Beach City Council committed the City to take measures to reduce greenhouse gas emissions from municipal operations and the community at large, including establishing a Cool Cities campaign, engaging the community to participate, taking initial solution steps, and performing a greenhouse gas audit. Solana Beach also joined the International Council for Local Environmental Initiatives (ICLEI), now officially named ICLEI - Local Governments for Sustainability, which is an international membership association made up of local governments dedicated to climate protection and sustainable development.
The growing concern for public health has also influenced efforts to improve opportunities for walking and cycling. Regular physical activity is critically important for the health and well-being of people of all ages. Millions of Americans suffer from health problems that can be prevented or improved through regular exercise, such as coronary heart disease, stroke, obesity, diabetes, cancer, stress, and depression. Making it easier, safer, and more attractive to walk or bike to work and other common destinations, or for recreational purposes, plays a key role in encouraging physical activity and healthy living.
Such actions and initiatives reflect a growing recognition that we should be working to reduce reliance on automobile travel and increase the ease of walking, cycling, and using public transit to support daily life.
II. Existing Circulation System
The City of Solana Beach, which is located along the central coast of San Diego County, is accessed via four primary corridors: Highway 101, the San Diego Freeway (Interstate 5 or I-5), Lomas Santa Fe Drive, and Via de la Valle. These four corridors create a grid network of roadways that provide inter-regional connections to southern San Diego County, Orange and Los Angeles counties, as well as access to surrounding communities along the coast and inland.
As a mostly built-out community, Solana Beach’s circulation network is already in place. However, the City has long recognized that a multi-modal, well-connected, and aesthetically pleasing transportation network enhances the quality of life for those to live, work, and visit Solana Beach. Through ongoing implementation of the Circulation Element and the Highway 101 Corridor Specific Plan, the City has been making significant progress in enhancing both the pedestrian and bicycle facilities, supporting the use of transit, and improving connections for all modes of travel.
The City’s existing circulation system is described in the following section.
A. Pedestrian Environment
Walkability is an important factor in providing mobility and quality of life within a community. The degree to which people walk for transportation and recreation is influenced by the comfort, safety and convenience of their walking experience. Comfort is influenced by climate, separation from through traffic, topography, and the presence of sidewalks and improved paths. Safety is influenced by the speed and volume of conflicting vehicle traffic, street widths, traffic control, number of conflict points, and infrastructure design. Convenience is influenced by the distance and directness of travel. As connectivity increases, travel distances decrease and route options increase for the pedestrian.
The City is bordered by the Pacific Ocean to the west. During low tides, people are able to walk on the beach along the full length of the City. During high tides, large portions of the entire beach are under water, so walking is not possible.
Other water bodies nearby include the San Elijo Lagoon to the north and the San Dieguito River to the south. Both of these areas have pedestrian trails that are easily accessible by residents of Solana Beach, although they are not physically within the City limits.
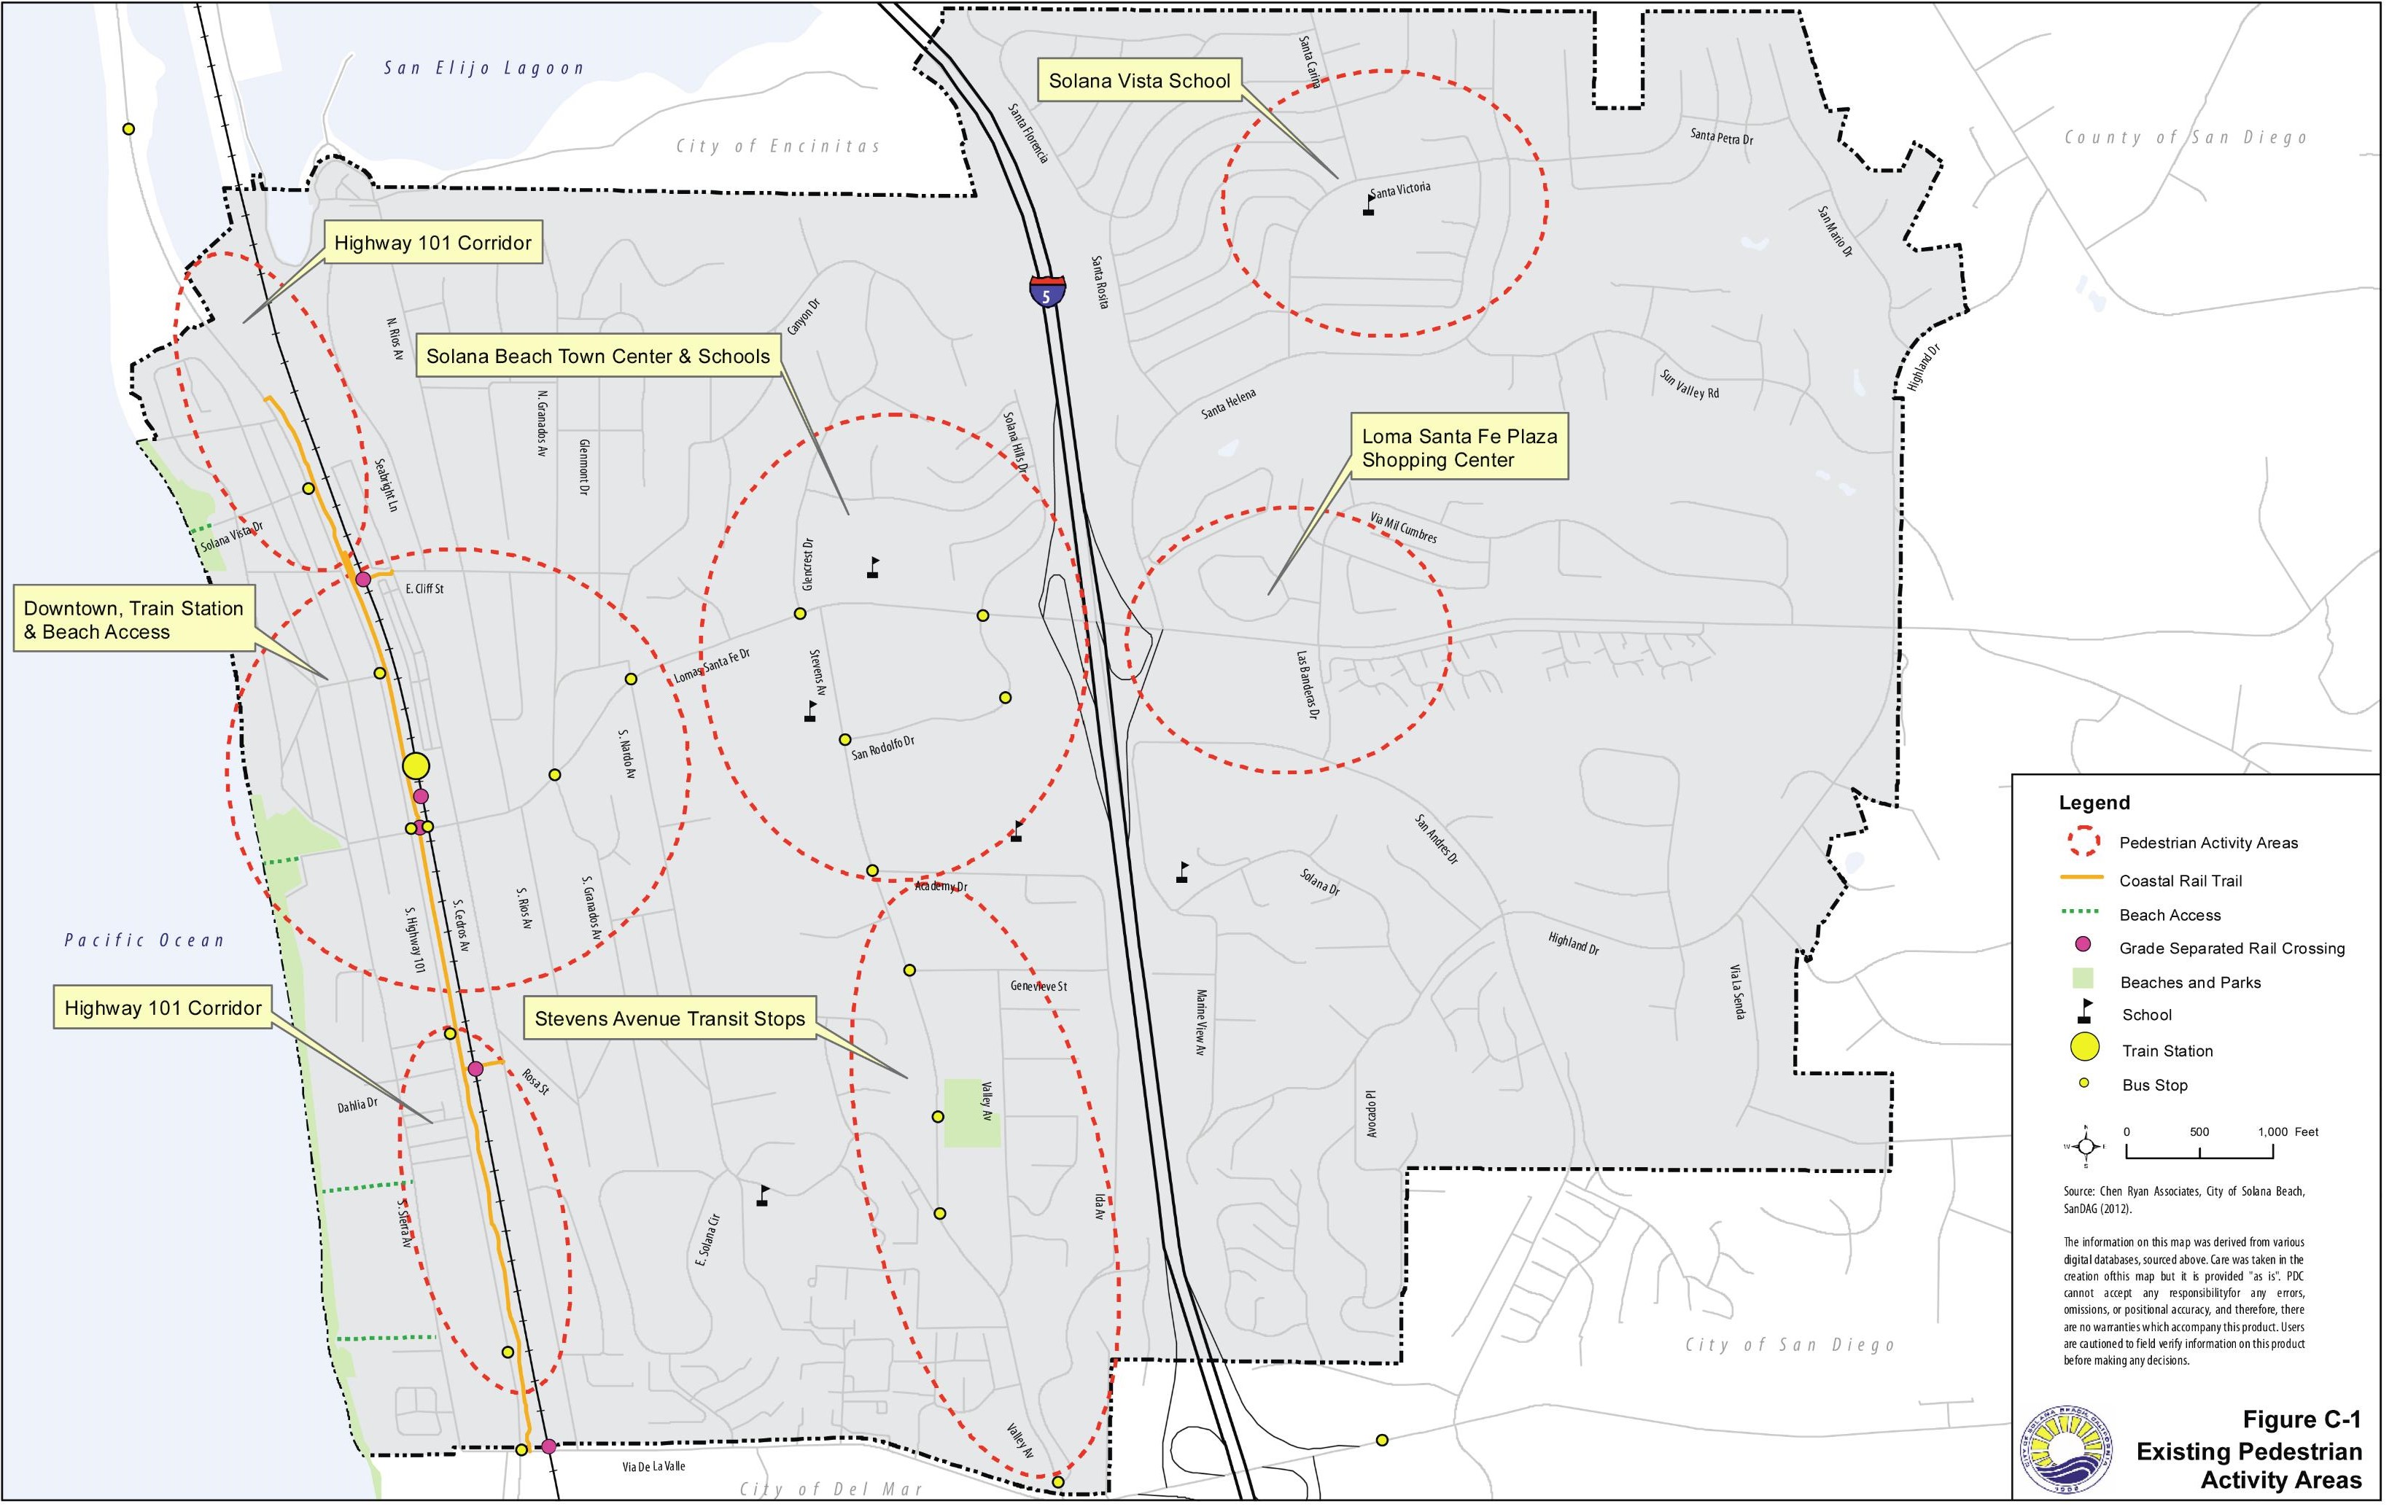
The Coastal Rail Trail (CRT) is a major north/south pedestrian and cycling corridor within the City of Solana Beach. It includes a Class I Multi-Use Path with a decomposed granite (DG) walking surface. The CRT runs the entire length of the City along Highway 101, providing access to businesses along Highway 101 and Cedros Avenue, the Solana Beach Transit Center, and the City’s four public beach access points (Del Mar Shores Beach, Seascape Beach, Fletcher Cove Beach and Tide Park Beach).
Barriers to east-west pedestrian travel in Solana Beach include I-5 and the railroad corridor. Crossing areas are allowed only when pedestrian safety can be accommodated. The Lomas Santa Fe interchange with I-5 is the only protected place where pedestrians can cross I-5 in the City of Solana Beach. Although pedestrians are able to cross I-5 at Via de la Valle and within the San Elijo Lagoon, these crossings are located outside the City limits. Pedestrians can currently cross the railroad corridor safely at two roadway crossings (Via de la Valle and Lomas Santa Fe Drive) and three pedestrian bridge crossings (at Dahlia Street/Rosa Street, at the train station, and at Cliff Street). Refer to Figure C-1 for a map of some of the higher pedestrian activity areas in the city.
B. Cycling Environment
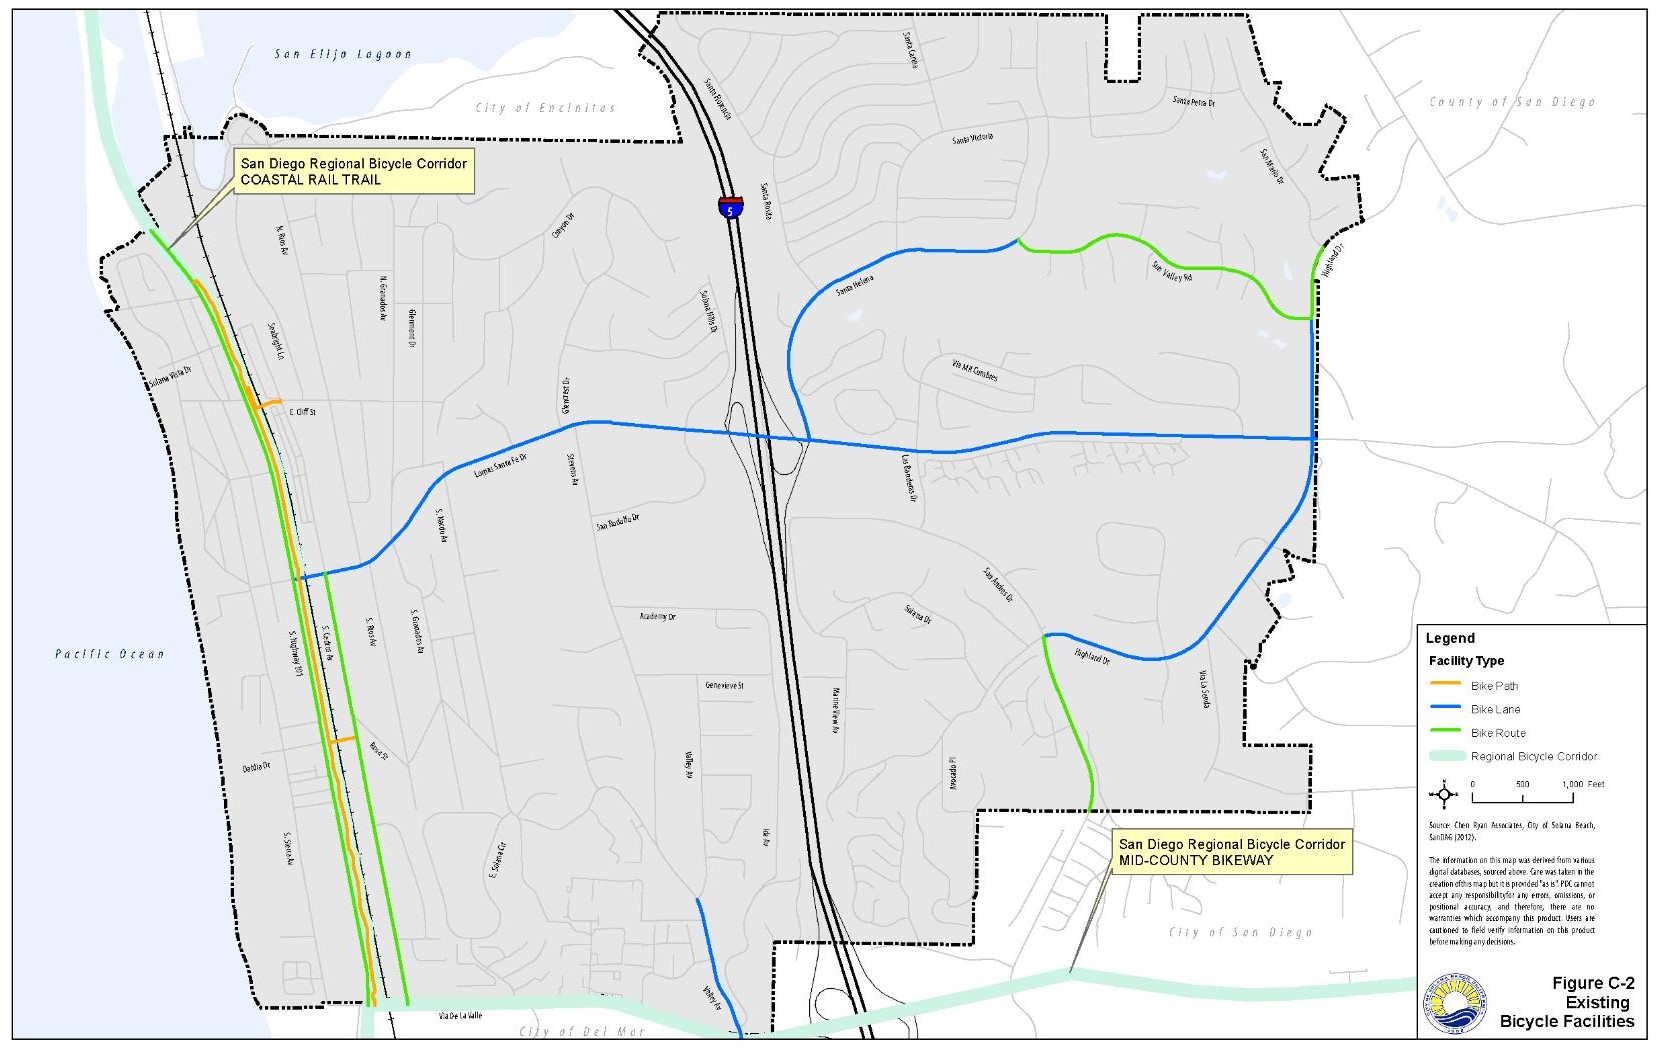
Bicycle facilities are an integral component of the City’s transportation system. Adequate bicycle facilities encourage non-motorized transportation, enhance recreational opportunities, and help attract visitors. Bikeways not only provide local opportunities for cyclists, but also offer regional connections. The Highway 101 corridor is one of the most heavily used bicycle corridors in the county.
Bicycle facilities are classified based on a standard typology as follows:
• Class I Bikeway (Bike Path) provides a completely separate right-of-way and is designated for the exclusive use of bicycles and pedestrians.
• Class II Bikeway (Bike Lane) provides a striped lane on a street or highway designated for bicycle use. Bicycle lanes are generally five feet wide.
• Class III Bikeway (Bike Route) provides for a right-of-way designated by signs or pavement markings for shared use with motor vehicles.
There are currently about 6.4 miles of bicycle facilities within the City, with over half being comprised of bikeways located along Lomas Santa Fe Drive and Highway 101 (refer to Figure C-2, Existing Bicycle Facilities). The Highway 101 corridor has very high levels of cycling activity due to its coastal location and the connection it provides to other destinations such as Torrey Pines State Park, beach access points, shops, and restaurants. Class III shared bicycle routes are located along portions of Highland Avenue and San Andres Drive.
C. Public Transit Services and Facilities
Transit opportunities in Solana Beach are provided by the North County Transit District (NCTD) with both commuter train and bus services. Figure C-3 identifies the existing public transportation routes and stops within Solana Beach.
1. Passenger Rail
A heavy rail commuter train service called the Coaster connects Oceanside to downtown San Diego, with a station at Lomas Santa Fe Drive (the Solana Beach Transit Station). The train station also provides a bus transit transfer center connecting the two bus routes in the city (Routes 101 and 308). Amtrak also stops at the transit station and provides passenger train service throughout the United States.
More than 20 Coaster trains run on weekdays. Trains run less often on the weekends. It takes about an hour to travel the entire Coaster route. The Coaster provides connections to numerous other transit routes, including bus routes, the Sprinter, the San Diego Trolley, Amtrak (at the Solana Beach Transit Center), and Metro Transit (to the Orange and Los Angeles Counties via the Oceanside transit center). Service frequency is limited because portions of the route have only a single track.
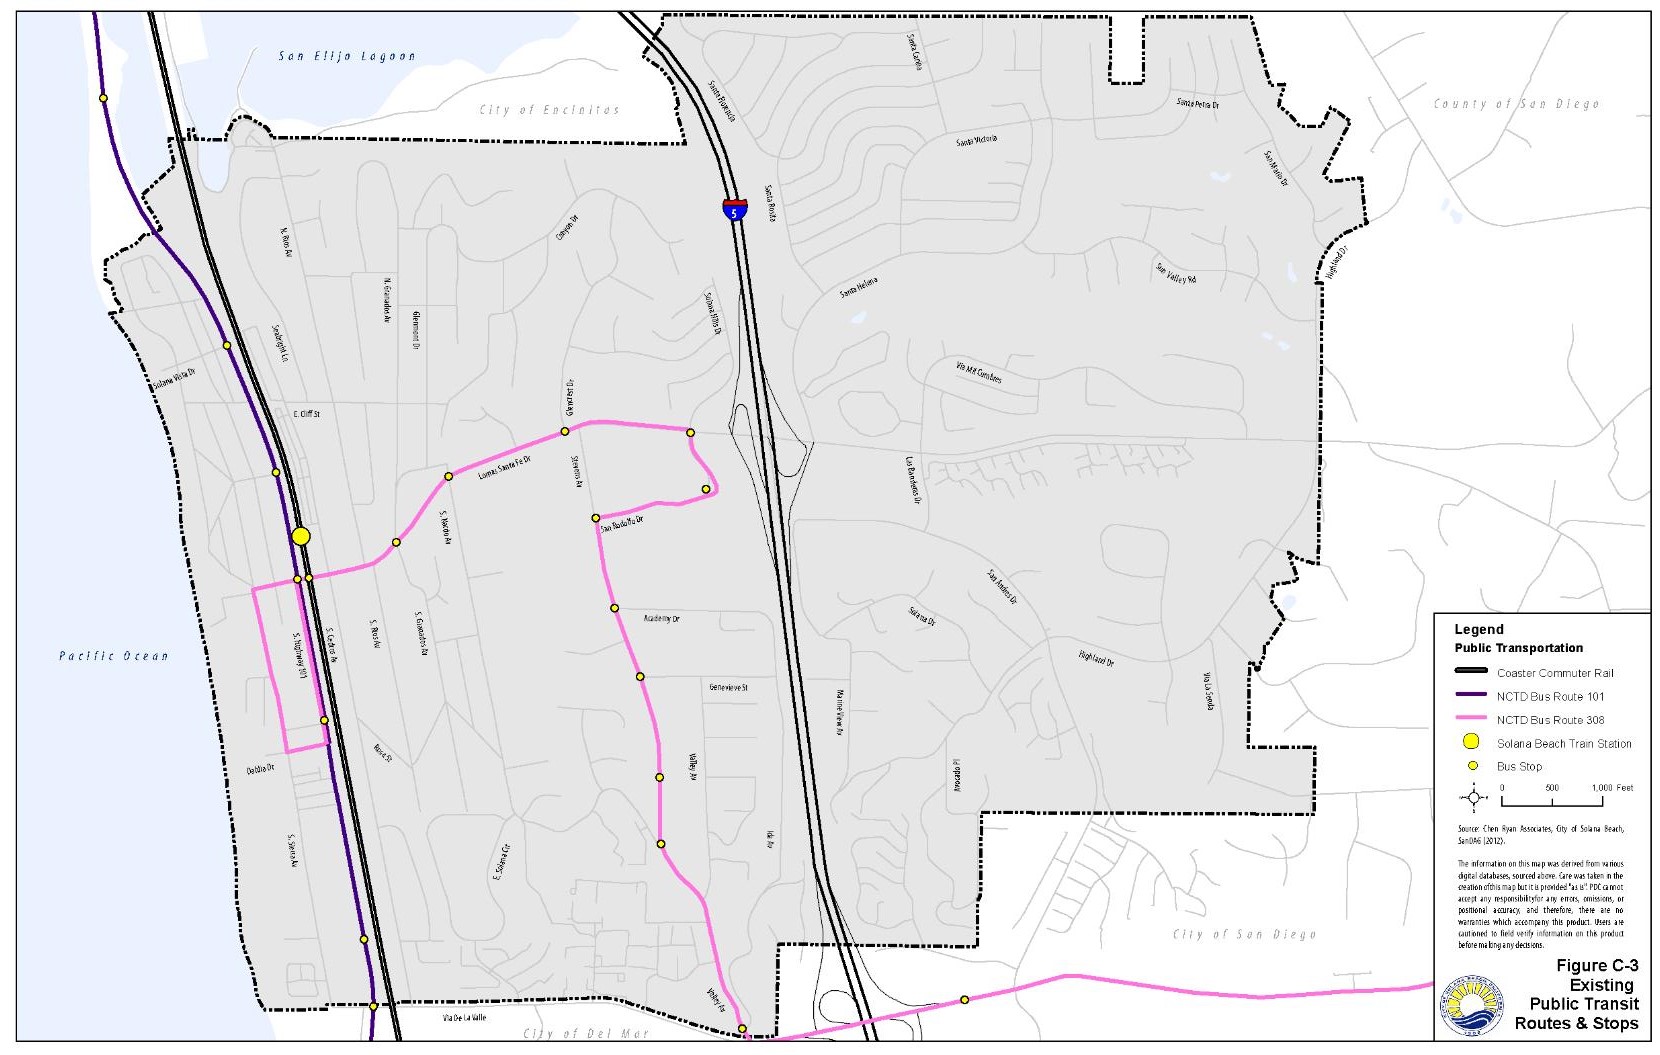
2. Bus Service
Bus service, known as the Breeze, is provided on two routes in Solana Beach by the NCTD: Route 101 and Route 308. Route 101 connects from Oceanside to the University Town Center. It serves the northern coastal cities of Del Mar, Solana Beach, Encinitas, Carlsbad and Oceanside. Route 101 also has a station at the Del Mar Fairgrounds and provides connections to the Coaster, Sprinter, Metro, Amtrak and other bus routes. The bus travels along Highway 101 at 30-minute headways during the daytime and at 60-minute headways during the evenings. Headway is defined as the approximate time between consecutive bus arrivals at a bus stop.
Route 308 connects the Solana Beach Transit Center with the Escondido Transit Center via the unincorporated community of Rancho Santa Fe. Route 308 travels along Lomas Santa Fe Drive in the City and provides transit service throughout the day at 60-minute headways.
The highest ridership levels occur at the Highway 101 and Plaza Street/Lomas Santa Fe Drive bus stops, where over 100 boardings and alightings occur at each of the three stops serving this intersection. The Route 101 bus stop located at the far side of this intersection in the northbound direction has the highest daily boardings and alighting of any stop within the City, with about 160 average daily boardings and alightings reported for the year 2010.
D. Roadways and Freeways
The roadway network is comprised of regional facilities such as I-5 and Highway 101, as well as numerous arterials and local streets. Figure C-4 displays the current geometry of the major roadways within the study area, which are also described below. Field verification of the existing roadway geometries as well as the collection of traffic count data was completed in May of 2012, unless otherwise noted below. Functional roadway classifications are based on County of San Diego Public Roadway Standards.

1. Interstate 5
I-5 is a major north-south regional facility that provides access between Solana Beach and other communities in San Diego County such as Del Mar, Encinitas, Carlsbad, Oceanside, and San Diego. It also provides a connection to Orange and Los Angeles counties to the north. I-5 has eight mixed flow/general purpose lanes (four in each direction), two auxiliary lanes (one in each direction) and two carpool lanes (one in each direction). Local access is provided via interchanges at Lomas Santa Fe Drive and Via De La Valle.
The California Department of Transportation (Caltrans) maintains and operates I-5. In 2009, I-5 accommodated 195,000 to 208,000 average daily trips (ADT) through Solana Beach. Trucks comprise about five (5) percent of the total traffic on I-5. Caltrans recently extended the High Occupancy Vehicle (HOV) lanes on I-5 from Via de la Valle to approximately Manchester Avenue. The HOV lane allows for carpool and vanpool vehicles travelling through the City to utilize the HOV lane as an alternative to Single Occupancy Vehicle (SOV) lanes. The next extension of the HOV lane is being designed and would run to La Costa Avenue. Caltrans and the San Diego Association of Governments (SANDAG) are currently designing major improvements to the I-5 corridor (as part of the I-5 North Coast Study) that would add highway lanes and operational improvements to a 27-mile stretch of the freeway from Oceanside to the Carmel Valley area of San Diego.
2. Highway 101
Highway 101 is a four-lane major arterial. It provides the primary north-south access to numerous beaches and parks along the coast as well as connections to the communities of Encinitas, Carlsbad and Oceanside to the north and Del Mar and La Jolla to the south. Existing (2009) daily traffic volumes are approximately 19,500 vehicles per day north of Lomas Santa Fe Drive and approximately 16,000 vehicles per day south of Lomas Santa Fe Drive. Highway 101 is also a popular route for bicyclists.
In 2013 a City revitalization project made significant improvements to Highway 101. The Highway 101 West Side Improvement project includes an increase in the number of parking spaces, creation of a bicycle and pedestrian friendly corridor, improvements to the aesthetics of the surrounding area, traffic calming along Highway 101, installation of two new traffic signals and two new mid-block crosswalks, other hardscape and landscape improvements, and drainage improvements.
Completion of this project brings a renewed vibrancy to the historic Highway 101 corridor. It also supports the Highway 101 Corridor Specific Plan by enhancing the links between the businesses on the west side of Highway 101 and the Coastal Rail Trail and the Cedros Design District. A key element of the project is traffic calming. Construction of the project began in 2012 and was completed in the summer of 2013.
3. Key Arterials and Local Streets
North-South Roadways
Sierra Avenue is parallel to and west of Highway 101. It is a two-lane roadway with a posted speed limit of 25 miles per hour (mph). It currently carries approximately 3,600 ADTs. Although there is no designated bicycle facility along this roadway, it is regularly traveled by cyclists as it provides a strong north-south connection parallel to Highway 101 with relatively low vehicular traffic volumes.
Cedros Avenue is parallel to and east of Highway 101. It is a two-lane roadway with a posted speed limit of 25 mph. As such, its primary function is to provide local access to businesses and residences adjacent to the roadway. In 2009, Cedros Avenue carried approximately 4,500 ADT. It should be noted that South Cedros Avenue between Marsolan Avenue and Via de la Valle is fronted entirely by residential properties. There are bicycle sharrows along Cedros Avenue. The existing functional classification of Cedros Avenue is a two-lane collector roadway.
Nardo Avenue is a two-lane roadway that provides north-south access to largely residential land uses. It has a posted speed limit of 25 mph and currently carries approximately 3,000 ADTs. There are currently no designated bicycle facilities along Nardo Avenue. The existing functional classification of Nardo Avenue is a two-lane collector roadway.
Stevens Avenue is a north-south commercial roadway, extending from Lomas Santa Fe to Valley Avenue. It provides access to business and residential areas along both sides of the roadway, as well as a middle school, public library, and a private school. The posted speed ranges from 25 mph to 35 mph depending on the presence of school zones. Its existing cross-section varies from two lanes undivided to four lanes undivided. In 2009, ADT volumes along Stevens Avenue ranged from approximately 10,000 near Lomas Santa Fe Drive to approximately 13,000 near La Colonia Park. There are no designated bicycle facilities along Stevens Avenue except for a bike lane from Turfwood Lane south to Via de la Valle. The existing functional classification of Stevens Avenue is a four-lane commercial collector roadway.
Valley Avenue is a north-south commercial collector and local roadway, extending from Genevieve Avenue to Via De La Valle. Between Genevieve Avenue and Stevens Avenue, Valley Avenue is classified as a residential street and provides access to some businesses, residential areas, and La Colonia Park. Posted speeds are 25 mph along this portion of Valley Avenue. South of Stevens Avenue, Valley Avenue is classified as a collector street. In this area, Valley Avenue is an extension of Stevens Avenue providing access to Via de la Valle and I-5. Its existing cross-section is two lanes undivided. Between Stevens Avenue and Via de la Valle, the 2009 ADT for Valley Avenue was approximately 13,000. Posted speeds are 40 mph along this portion of Valley Avenue. There is a designated bike lane along this portion of Valley Avenue.
Santa Helena is a two-lane residential roadway with a posted speed limit of 25 mph. It currently carries a range of ADTs from 700 to 1,300. It provides a north-south connection between Lomas Santa Fe, east of I-5, north into residential neighborhoods in the northeast quadrant of Solana Beach. Santa Helena currently has Class II Bike Lanes from Lomas Santa Fe to Sun Valley Road. The existing functional classification of Santa Helena is a two-lane collector roadway.
Las Banderas is a north-south two-lane roadway that intersects with Lomas Santa Fe, east of I-5. Its posted speed limit is 25 mph, and it currently carries about 3,700 ADTs. It provides a north-south connection between Lomas Santa Fe, east of I-5, north into residential neighborhoods in the northeast quadrant of Solana Beach. There are currently no designated bicycle facilities along Las Banderas. The existing functional classification of Las Banderas is a two-lane collector roadway.
San Andres Drive is a two-lane curving collector. It provides secondary access to the southeastern quadrant of Solana Beach, which is primarily a residential area. The posted speed limit is 40 mph. In 2009, ADT along San Andres Drive ranged from approximately 6,500 ADT south of Highland Drive to approximately 3,300 ADT near Las Banderas Drive. There is a designated bike route along the southerly portions of San Andres Drive. The existing functional classification of San Andres Drive is a two-lane collector roadway.
Highland Drive is a north-south oriented two-lane collector. It provides important neighborhood access in both the southeastern and northeastern portions of the City and connects to the San Dieguito County Park. Posted speed limits are 25 mph. There is a designated bike route running along Highland Avenue, east of San Andreas; and there is a designated bike lane along the portion of Highland Drive near Lomas Santa Fe. North of Lomas Santa Fe, there is a designated bike route along Highland Drive. At its northern terminus, Highland Drive intersects with El Camino Real, a major regional arterial providing access to a number of surrounding communities. In 2009, Highland Drive carried approximately 5,200 ADTs. The use of licensed golf carts on portions of Highland Drive between San Lucas Court and San Andres Drive was approved in 2010. In 2013 an improvement project was completed on Highland Drive, including construction of a sidewalk on the west side of Highland Drive from Lomas Santa Fe Drive to Sun Valley Drive, as well as other traffic calming features. The existing functional classification of Highland Drive is a two-lane collector roadway.
East-West Roadways
Lomas Santa Fe Drive runs east-west and is a four-lane divided roadway with limited on-street parking. It provides coastal and inland access for Solana Beach and access to and from I-5. West of I-5, traffic volumes range from 18,000 ADTs near Highway 101 to approximately 26,000 ADTs near I-5. East of I-5, traffic volumes drop considerably to about 11,000 ADT near Highland Drive. Posted speeds are 35 mph. A bike lane is striped on both sides of the street. The existing functional classification of Lomas Santa Fe is a four-lane major roadway.
Santa Victoria is a two-lane residential roadway with a posted speed limit of 25 mph. It currently carries less than 1,000 ADTs and primarily serves as access to residential uses in the northeast quadrant of the City. Traffic volumes may be higher during the school year. There are no designated bike facilities along Santa Victoria. The existing functional classification of Santa Victoria is a two-lane collector road.
Santa Petra is a two-lane residential roadway that provides a connection between Santa Victoria and Highland Drive. It currently carries less than 500 ADTs and has a posted speed limit of 25 mph. There are no designated bike facilities along Santa Petra. The existing functional classification of Santa Petra is a two-lane collector roadway.
San Mario is a two-lane residential roadway that provides a connection between Santa Petra and San Marino Drive. It currently carries less than 1,000 ADTs and has a posted speed limit of 25 mph. There are no designated bike facilities along San Mario. The existing functional classification of San Mario is a two-lane collector roadway.
Sun Valley Road is a two-lane residential roadway with a posted speed limit of 25 mph. It provides a connection between Santa Victoria and Highland Drive. It currently carries about 3,200 ADTs and has a posted speed limit of 25 mph. Sun Valley Road is designated as Class III Bike Boulevard which is designated with both signs and sharrows. The existing functional classification of Sun Valley Road is a two-lane collector roadway.
Important Roadways Outside of City Limits
The following roadways are located outside of City limits, but provide access to Solana Beach or serve as major north/south or east/west corridors. The City has no control over these roadways since they are located outside of its jurisdiction.
Jimmy Durante Boulevard provides a north-south extension of Valley Avenue into the City of Del Mar at the intersection with Via De La Valle. It is a four-lane roadway with a center-left turn-lane. The posted speed limit is 45 mph and it currently carries about 9,100 ADTs. There is a designated bike lane along Jimmy Durante Boulevard, south of Via De La Valle. The existing functional classification of Valley Avenue is a two-lane collector roadway.
El Camino Real, is a two-lane roadway with a posted speed limit of 25 mph. In the vicinity of Solana Beach, El Camino Real carries about 2,000 to 4,500 ADTs. There are no designated bike facilities along the segments of El Camino Real near the City of Solana Beach.
Border Avenue is a two-lane east-west roadway within the City of Del Mar. It connects Highway 101 to the southern end of Sierra Avenue in Solana Beach, and has a posted speed limit of 25 mph. There is no designated bike facility along Border Avenue. It currently carries about 3,300 ADTs.
Via De La Valle runs east-west and is a four-lane divided roadway with limited on-street parking and bike lanes. West of Jimmy Durante Boulevard, Via De La Valle is primarily located within the City of Del Mar. To the east of Jimmy Durante Boulevard, Via de la Valle is primarily located within the City of San Diego. It provides inland and beach access, as well as interregional access via an interchange with I-5. Via De La Valle also provides direct access to the Del Mar Fairgrounds, a major seasonal traffic generator. Between I-5 and Jimmy Durante Boulevard, traffic volumes average about 43,300 ADT. West of Jimmy Durante Boulevard, average daily traffic is 18,200. East of I-5, traffic volumes are about 20,000 ADT.
E. Airports and Goods Movement
1. Airports
Solana Beach does not have an airport within its jurisdiction, but is serviced by two nearby airports: the McClellan-Palomar Airport located in the City of Carlsbad to the north and the San Diego International Airport at Lindbergh Field located in the City of San Diego to the south.
2. Goods Movement
Goods movement in Solana Beach occurs both by rail and by truck. The passenger rail tracks described in Section C.1 are shared with freight trains that typically run during the late evening hours. The primary points of regional truck access are provided along Highway 101, Lomas Santa Fe, and I-5. Trucks traveling through the city most likely use these routes unless they have a local delivery, in which case they may utilize other local roadways to reach their destination.
F. Transportation Demand Management
A common community concern about traffic conditions relates to speeding, cut-through traffic, and safety of local residential streets. The City has established a traffic calming program, which allows residents to interact with staff to study and identify potential solutions to neighborhood traffic issues. The City has historically provided funding to implement minor capital projects that result from the traffic calming program recommendations. The program identifies solutions that involve traffic control techniques, neighborhood/driver education, and/or increased law enforcement and physical controls. Physical controls include various horizontal and vertical measures such as medians, chicanes, bulb-outs, and traffic circles or roundabouts.
Community members have also expressed concern with traffic congestion near schools. Over the past decades, many school districts have discontinued busing services, resulting in more parents driving their children to school. This causes short yet pronounced periods of congestion near schools during the morning drop-off and afternoon pick-up times. City staff have been working with schools and parents to identify operational improvements and educational programs, along with infrastructure improvements, in order to improve traffic flow and safety near schools. This includes identifying Safe Routes to School for walking and bicycling to cut down on vehicular traffic.
G. Utility Infrastructure
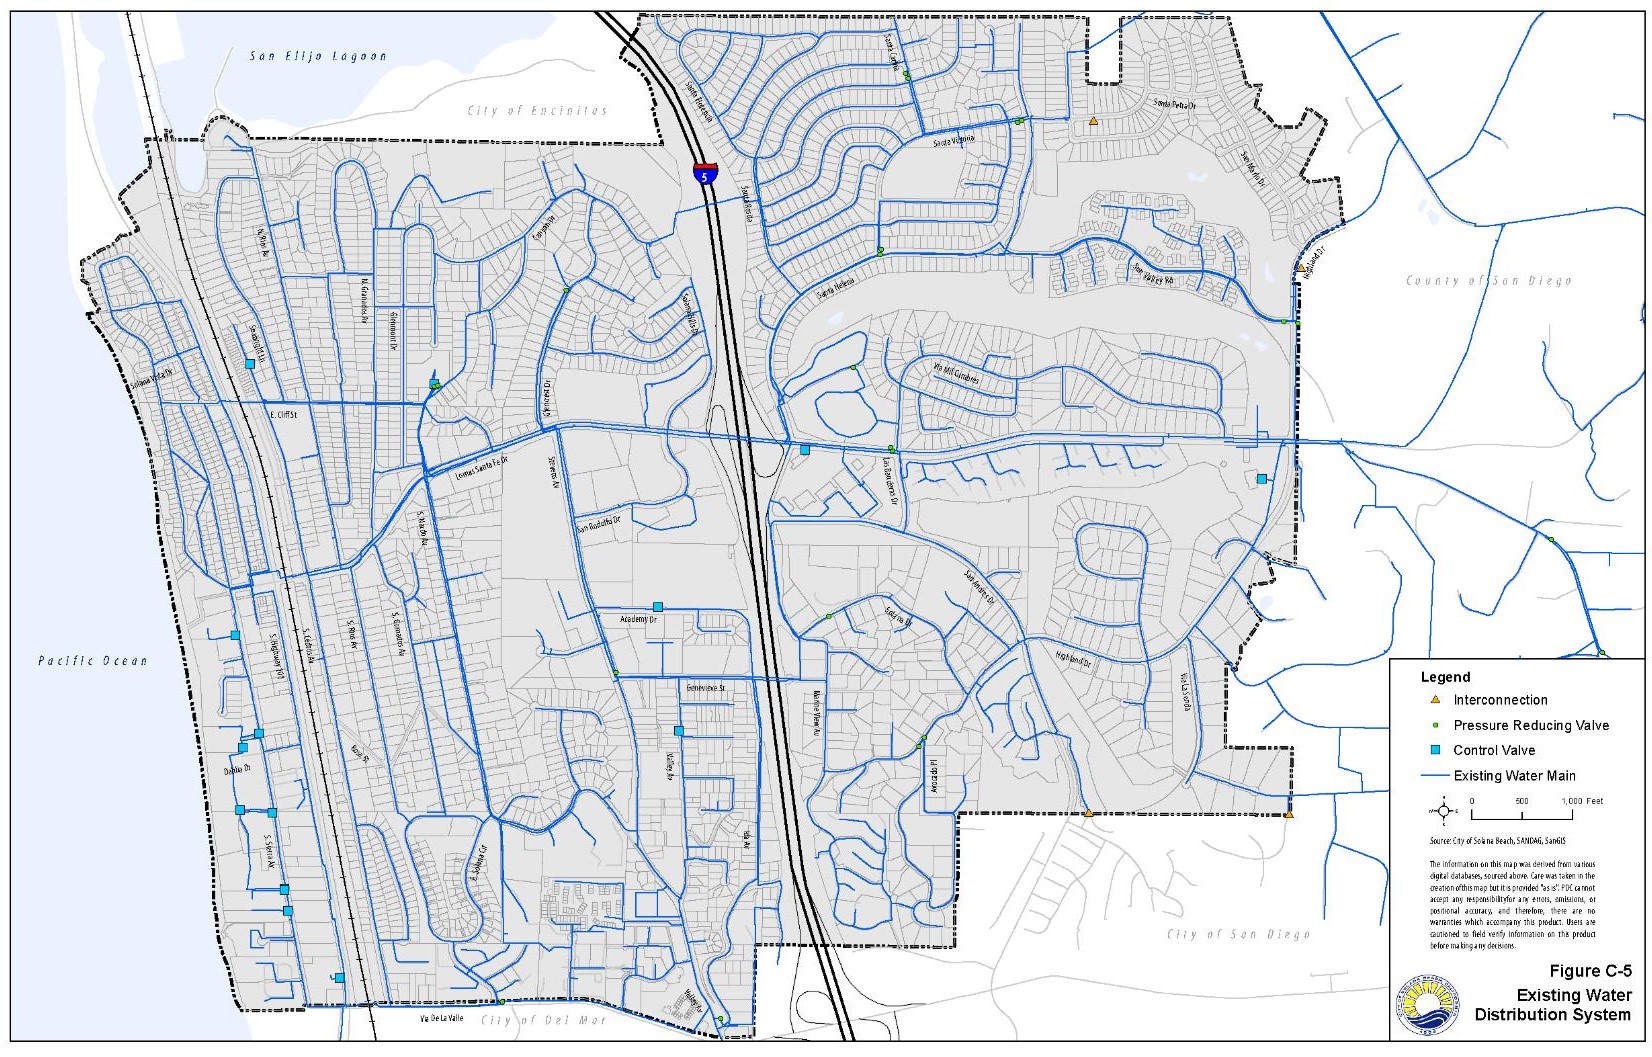
1. Water
Supply
Solana Beach receives its water from the Santa Fe Irrigation District. The District service area contains approximately 10,200 acres, of which 2,850 acres are in Solana Beach, 6,490 acres are in Rancho Santa Fe, and 920 acres are in Fairbanks Ranch1. The present population of the District is approximately 19,386, of which two-thirds is in the Solana Beach area. The District provides potable water service for domestic, commercial, outdoor irrigation, and agricultural demands.
The District maintains a diverse water supply portfolio. Local water supplies include surface water from Lake Hodges that is treated at the District’s Badger Plant, and recycled water purchased wholesale from the San Elijo Joint Powers Authority (SEJPA) for resale to District customers. As a member agency of the Water Authority, the District’s supplies also include raw imported water that the District treats at its Badger Plant, imported treated water, and other wholesale supplies available from the Water Authority’s diversified water supply portfolio.
Demand
In 2010, actual potable water deliveries totaled 11,208 acre feet2. Approximately 87 percent of the potable water use in the District’s service area was for single-family and multi-family residential purposes. Potable water consumption totaled four percent to commercial uses, six percent to landscape uses, and three percent to industrial, institutional, and agriculture uses. When non-potable recycled water is factored into the District’s portfolio, residential uses comprise 83 percent and all other uses remain the same. Recycled water used for landscape irrigation comprises four percent of total water use in the service area.
The Santa Fe Irrigation District has based future demands on population projections prepared by the San Diego Association of Governments (SANDAG) utilizing a gallons-per-capita-per-day (gcpd) multiplier that relates to the District’s unique demand characteristics. The District assumes that projected potable water demands will reach 11,426 acre feet per year by 20353. Recycled water demand is anticipated to increase as additional recycled water supplies and transmission infrastructure are made available.
Actual water demand in the District has decreased due to a comprehensive water conservation program. Potable water use in 2010 was 740 acre feet per year lower (6 percent) than 2005 potable water use3. Diversifying the Water Authority’s supply by reducing imported water and increasing new supply sources, such as seawater desalination, will serve to substantially increase the reliability of the Water Authority’s future supplies. The Water Authority is currently implementing the Emergency Shortage Project (ESP), which would protect the San Diego region from service interruptions during emergency situations and ensure reliability of supplies. The ESP is a system of reservoirs, interconnected pipelines, and pumping stations designed to make water available to all communities in the San Diego region in the event of a disaster that would interrupt imported water deliveries. In addition, the Water Authority is committed to supporting its member agencies in complying with requirements of the Water Conservation Bill of 2009 and therefore reducing urban water consumption by 20% by the year 2020. The Water Authority reports that if municipal water district, Water Authority, and member agency supplies are developed as planned, along with achievement of the retail conservation target, no shortages are anticipated within the Water Authority’s service area in a single-dry year through 2035. In average precipitation years, the District has sufficient water to meet its customers’ needs through 2035. This is based on continued commitment to conservation measures, availability of local supplies, and commitment by the Water Authority to meet member agency demands.
Distribution
The Santa Fe Irrigation District utilizes its Capital Improvement Program (CIP) to maintain and upgrade its distribution infrastructure. As of the writing of this plan, the District has been implementing several upgrades to the system including replacement of the Pressure Reducing Stations (PRS), replacement of aging pipeline segments, and extension of the existing recycled water distribution system4. Figure C-5 identifies the existing water lines in Solana Beach.
2. Sewer
The City of Solana Beach owns and is responsible for approximately 283,000 linear feet of wastewater conveyance pipeline and four active pump stations5. The City’s sewer system is comprised of three major individual drainage basins containing gravity pipelines ranging in size from four to 24 inches in diameter. The City’s four permanent wastewater pump stations are maintained by the San Elijo Joint Powers Authority.
Average wastewater flow for the city is approximately 1.22 million gallons per day (gpd) resulting in a computed wastewater generation rate of approximately 175 gallons per equivalent dwelling unit (EDU) per day. For planning and facility sizing purposes, the City utilizes a conservative estimate of 200 gpd per EDU to account for increased summertime flows due to activities at the Del Mar fairgrounds/racetrack.
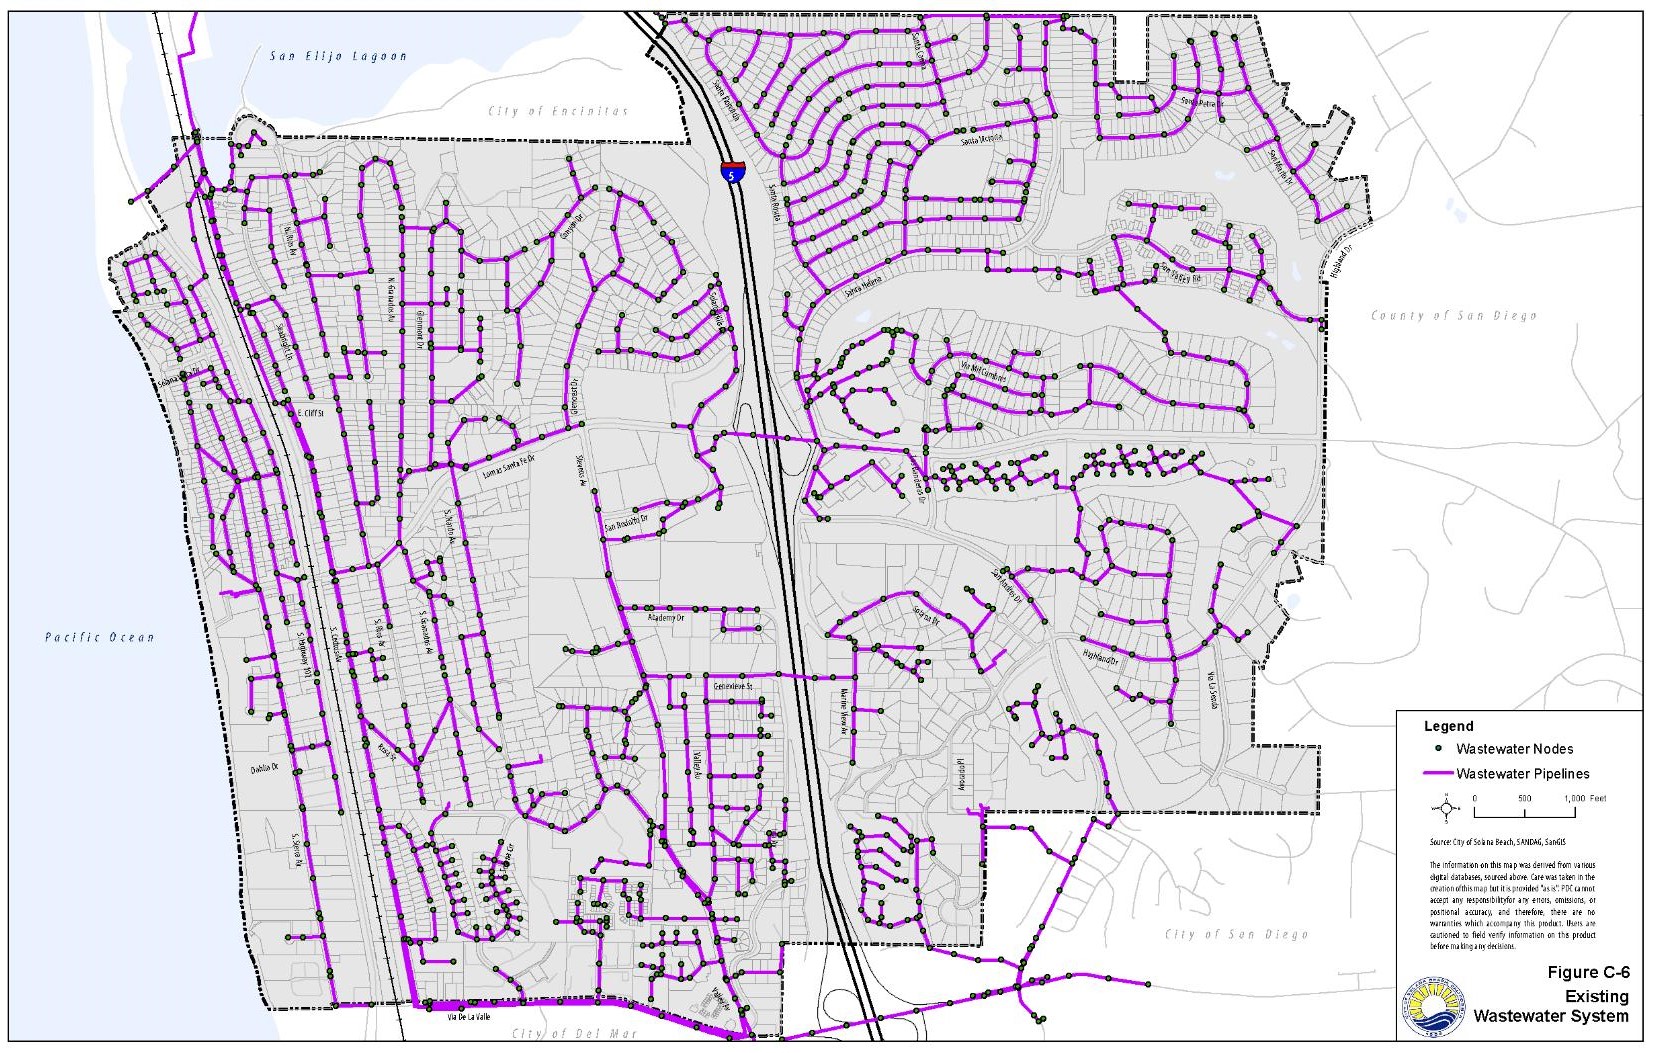
The City’s Capital Improvement Program (CIP) is utilized to maintain and upgrade the sewer system. It follows recommendations outlined in the Sanitary Sewer Master Plan, which estimated a future population of 15,620 people or a net gain of 688 EDUs at ultimate build-out. This estimate is consistent with the build-out projections outlined in this General Plan. Therefore, the City’s wastewater infrastructure is considered adequate to accommodate projected growth. Figure C-6 identifies the existing sewer system.
3. Hydrology/Drainage
Portions of Solana Beach fall within two watersheds: the San Dieguito Watershed and the Carlsbad Watershed6. The San Dieguito River watershed is a drainage area of approximately 346 square miles in west-central San Diego County. The watershed includes portions of the cities of Del Mar, Escondido, Poway, San Diego, and Solana Beach, and unincorporated San Diego County. In terms of land area, the majority of the watershed (79.8%) is within the unincorporated jurisdiction. The major water bodies within the San Dieguito Watershed include the San Dieguito River, San Dieguito Lagoon, and Lake Hodges.
The Carlsbad watershed is approximately 210 square miles in area extending from the headwaters above Lake Wolhford in the east to the Pacific Ocean in the west, and from Vista and Oceanside in the north to Solana Beach, Escondido, and the community of Rancho Santa Fe to the south. There are numerous important surface hydrologic features within the Carlsbad watershed including four unique coastal lagoons, three major creeks, and two large water storage reservoirs. The major water bodies within the Carlsbad Watershed are Loma Alta Creek, Buena Vista Creek, Buena Vista Lagoon, Agua Hedionda Creek, Agua Hedionda Lagoon, San Marcos Creek, Batiquitos Lagoon, Escondido Creek, San Elijo Lagoon, and Lake Wolhford. Only a small portion of the San Elijo Lagoon falls within Solana Beach city limits. This area is protected with an open space designation.
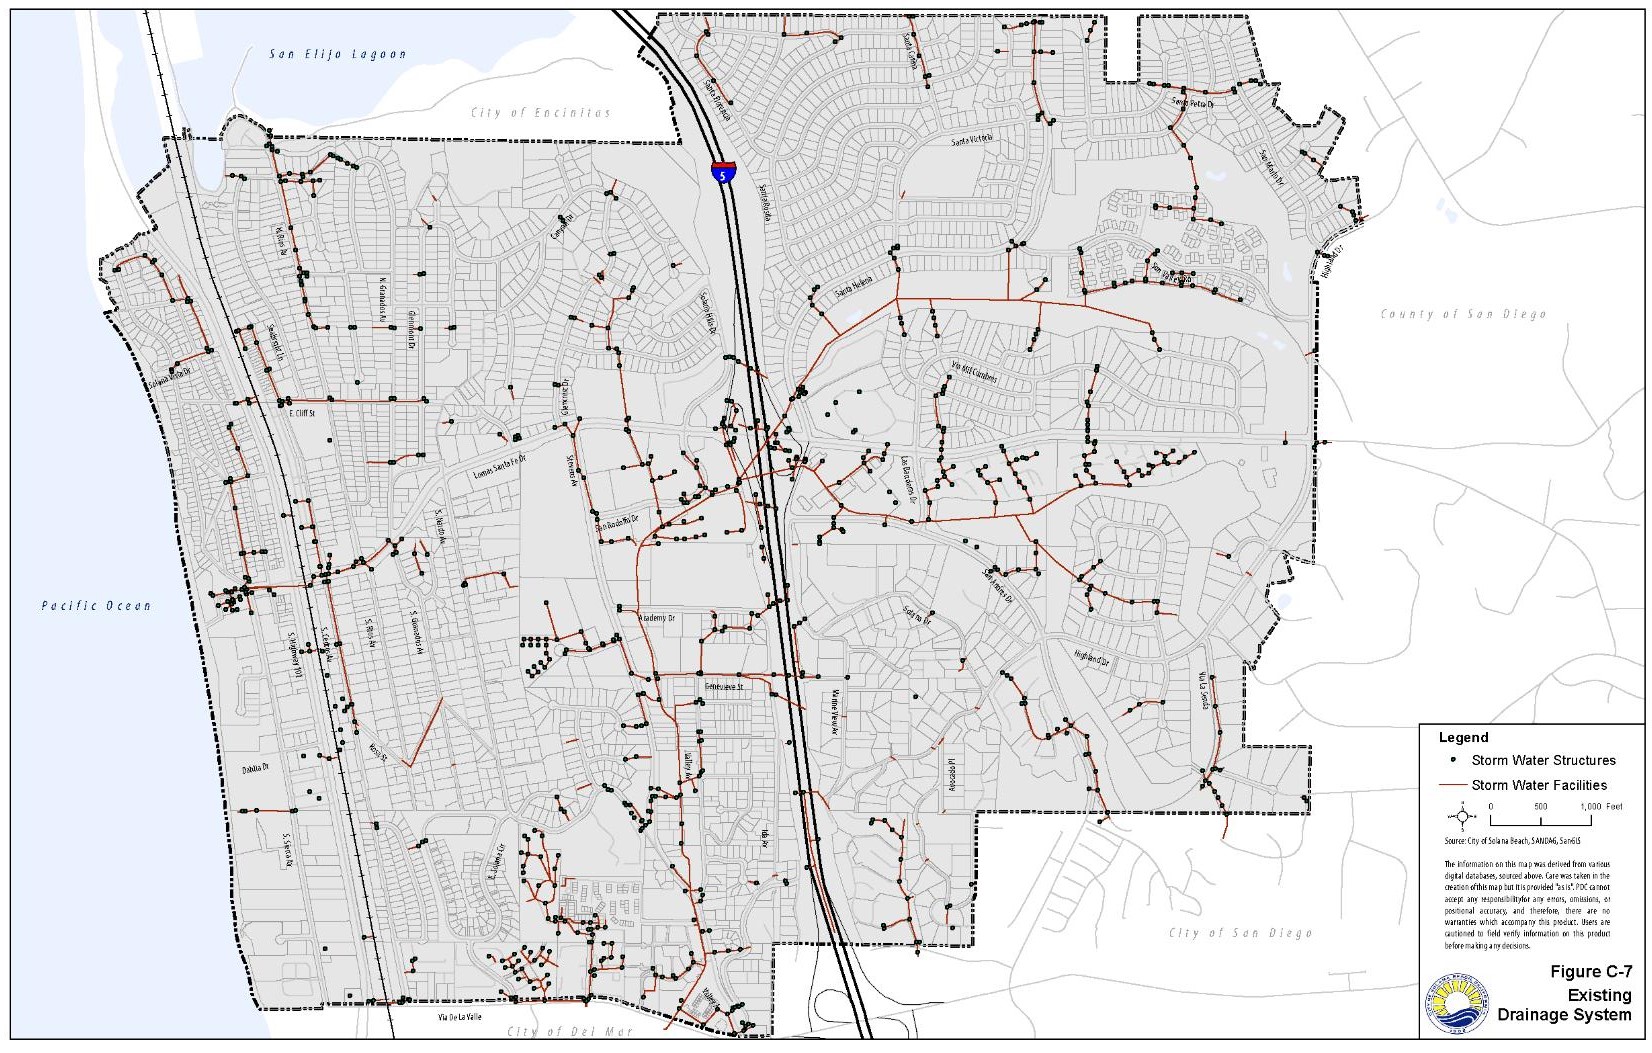
Solana Beach developed a Drainage Master Plan in 2004, which was subsequently updated in 2010. The plan provides an inventory of all existing public drainage facilities along with hydrologic and hydraulic analyses to determine existing system capacities. The City’s Capital Improvement Program (CIP) is utilized to maintain and upgrade the drainage system. It follows recommendations outlined in the Drainage Master Plan. Figure C-7 identifies the existing drainage facilities in Solana Beach.
Due to the built-out nature of the city, there are limited possibilities for additional land that can accommodate bio-filtration for storm flows. However, the City has a storm water management ordinance that establishes standards and minimum requirements for storm water management, site design, and best management practices to improve water quality and reduce the adverse effects of polluted runoff discharges.
4. Waste Disposal/Recycling Facilities
The City of Solana Beach has agreements with EDCO Waste and Recycling Services for commercial trash and recycling collection services, and with Coast Waste Management, Inc., for residential trash and recycling collection. Solid waste collected in Solana Beach is transported to either the Otay Landfill or the Sycamore Canyon Landfill. Commercial recyclables are processed in EDCO’s Material Recovery Facility located in Lemon Grove. Residential recyclables are taken to the Waste Management Recycling Center located in Orange, California at 2050 Glassell Street.
The Otay Landfill is located at 1700 Maxwell Road in Chula Vista and is operated by Allied Waste Industries. The landfill can accept a maximum of 5,830 tons per day. Operations are estimated to cease at this landfill in 20287. The Sycamore Canyon Landfill is located at 8514 Mast Boulevard at West Hills Pkwy in San Diego and is also operated by Allied Waste Industries. It can accept a maximum of 3,965 tons per day. Operations are estimated to cease at this landfill in 20311.
Once the Otay Landfill in Chula Vista and the Sycamore Canyon Landfill in San Diego reach capacity, there are two sites that could become potential disposal sites for Solana Beach’s waste: Gregory Canyon Landfill and the East Otay Mesa Landfill. The construction permit process is underway for the Gregory Canyon Landfill, which is proposed on 308 acres south of Highway 76 and about 3 1/2 miles east of Interstate 15 near Pala. The opening date is uncertain due to opposition to the facility. A countywide initiative (Proposition A) to provide for the siting of a new recycling center and solid waste landfill in the East Otay Mesa area of unincorporated San Diego County was approved by voters on June 8, 2010. The proposed recycling collection center and class III solid waste landfill would occupy approximately 340 acres. This project is currently in the permitting and environmental review process. There are no plans to provide future solid waste disposal facilities within Solana Beach.
There are three permanent household hazardous waste facilities that accept common household hazardous waste products from Solana Beach residents. One facility is located in Vista at 1145 East Taylor Street at Laguna Lane. Another facility is located in Poway in the South Poway Business Park at 12325 Crosthwaite Circle at Stowe Drive. The third facility is located in Escondido at 1044 west Washington Avenue. In addition, Solana Beach residents can make an appointment for door-to-door collection service for a small co-payment of $10 (the City subsidizes the disposal cost). Homebound and elderly residents (over the age of 65) may utilize the door-to-door pickup free of charge. E-Waste and SHARPs are free to dispose of either at the permanent facilities or through the door-to-door program for all residents.
5. Energy
The California Public Utilities Commission (CPUC) has the sole authority to regulate privately-owned public utilities in California. Its power extends to all aspects of the location, design, construction, maintenance, and operation of public utility facilities. The CPUC has provisions for regulated utilities to work closely with local governments and consider their concerns.
The state also regulates energy consumption under Title 24 of the California Code of Regulations. Title 24 provides Building Energy Efficiency Standards for heating, cooling, ventilation, water heating, lighting, and cool (reflective) roofs in new residential and non-residential structures.
The primary public utility in the region is San Diego Gas and Electric (SDG&E). SDG&E, operated by Sempra Energy, is an investor-owner public utility, which provides energy service to more than three million consumers in San Diego and the southern portions of Orange County8. SDG&E’s service area spans approximately 4,100 square miles. The utility delivers both natural gas and electricity throughout Solana Beach.
Natural Gas
Natural gas is delivered to customers in the city via a network of gas pipelines that runs throughout the county. Natural gas is considered a “cleaner” fuel. The burning of natural gas still produces nitrogen oxides and carbon dioxide, but in lower quantities than burning coal or oil.
The number of gas meters in SDG&E’s service area is expected to increase an average of 1.2 percent annually from 2011 to 20309. However, total load, including electric generation demand, is expected to decline from a total of 124 billion cubic feet (Bcf) in 2012 to 116 Bcf in 2030 due to increased conservation and energy efficiency measures.
Electricity
As of 2010, overall consumption in the SDG&E planning area totaled 20,300 gigawatt hours (GWh) and peak demand totaled 4,355 megawatts (MW)10. To estimate future electricity demand, SDG&E looks at three scenarios – high, mid, and low. The high case is characterized by low electricity rates, high population growth, high levels of efficiency, and low self-generation. Inversely, the low case is characterized by high electricity rates, low population, etc. Information from the mid scenario is presented in this General Plan. The mid demand scenario estimates 2.1 percent average annual growth in consumption and 2.0 percent annual growth in peak demand from 2011 to 202211. This increase is mainly due to population growth. Electricity consumption and peak demand savings are estimated to increase due to the 2010 revision to Title 24 building standards as well as AB1109 lighting savings and television standard savings. Total consumption savings due to stricter building and appliance standards equaled 2,882 GWh in 2010 and are expected to reach 5,635 GWh in 2022. Peak demand savings equaled 643 MW in 2010 and are expected to reach 1,261 MW in 20221.
Renewable Energy
In 2011, SDG&E provided 20.79% of their retail electricity sales from renewable power12. Solana Beach has limited control over natural gas or electricity delivery in the city. However, the City can attempt to reduce energy consumption through conservation education programs and promoting self-generation activities such as the installation of solar panels and other alternative energy systems.
III. Goals and Policies
The following goals and policies are consistent with the requirements and purpose of this element and are responsive to the key issues affecting Solana Beach. They are intended to guide future circulation improvements within the city.
Goal C-1.0: Correlated land use and circulation planning.
Policy C-1.1 Allow, encourage, and facilitate transit-oriented development, mixed-use, and infill projects in appropriate locations, especially near the transit station and along key corridors such as Highway 101.
Policy C-1.2 Require new development to provide and enhance connectivity to existing transportation facilities via the provision of key roadway connections, sidewalks (where appropriate or desired in residential neighborhoods), and bicycle facilities.
Policy C-1.3 Require new development and redevelopment to provide good internal circulation facilities that meet the needs of pedestrians, bicyclists, children, seniors, and persons with disabilities.
Policy C-1.4 Require new development and redevelopment to apply universal design standards to the extent feasible.
Policy C-1.5 Work with state, regional and local transportation entities to improve and expand transportation facilities and services that link residents to important land use destinations such as workplaces, schools, community and recreation areas, and shopping opportunities.
Goal C-2.0: A comprehensive circulation network to move people and goods safely and efficiently for all modes of travel.
Policy C-2.1 Utilize multi-modal performance indicators to periodically evaluate the City’s transportation system, with attention to the following guiding framework:
• Balanced Facilities (Multi-Modal Boulevard and Community Connector) – Seek balanced performance of automobile, transit, bike and pedestrian circulation.
• Bicycle Prioritized (Bicycle Boulevards) – Prioritize bicycle travel through the provision of wayfinding signage, pavement markings every 250 to 500 feet, and traffic calming measures approximately every 1000 feet.
• Pedestrian Prioritized (Pedestrian Corridors and Multi-Use Path) – Prioritize pedestrian circulation through the provision of physically separated bicycle and/or pedestrian facilities.
Policy C-2.2 Roadway facilities shall be constructed or upgraded, where feasible, to meet the design guidelines described in Table C-1. For streets that are not currently built to their ultimate design, the City may require the dedication of right-of-way or other improvements as a condition of land development consistent with Solana Beach Municipal Code (SBMC) regulations.
Policy C-2.3 Require new developments to be served by roads of adequate capacity and design standards to provide reasonable access by cars, trucks, transit, pedestrians, and/or bicycles.
Policy C-2.4 Provide a roadway system that complements urban development as established by the City’s adopted general plan. In implementing this policy, the City shall explore possible road extensions and additional roadway links, considering multi-modal forms of transportation.
Policy C-2.5 Pursue measures to reduce congestion at intersections, while also balancing the needs of pedestrians, cyclists and transit riders.
Policy C-2.6 Cooperate with Caltrans, SANDAG, NCTD, and other responsible agencies to identify, plan, and implement necessary transportation improvements.
Policy C-2.7 Endorse and support I-5 interchange improvement projects with minimal environmental impact that provide improved regional access to the Del Mar Fairgrounds.
Policy C-2.8 Reserve and protect adequate right-of-way to accommodate future multi-modal transportation improvement projects.
Policy C-2.9 Support the preparation of travel demand management plans to reduce peak hour commuter traffic impacts.
Policy C-2.10 Work to reduce vehicular travel demands along Lomas Santa Fe between the eastern boundary of the City and Highway 101.
Policy C-2.11 Study and work with schools to implement methods to reduce automobile congestion caused by local school traffic.
Policy C-2.12 Continue to identify areas allowing for licensed golf carts and other low speed vehicles on designated public streets to allow for safe and convenient access to the golf course and neighboring uses.
Policy C-2.13 Develop a program to measure and monitor changes in active transportation/travel.
Goal C-3.0: Adequate measures to ensure traffic safety.
Policy C-3.1 Ensure that the development of new private driveways does not pose significant traffic hazards for major arterials and residential collector roads.
Policy C-3.2 Continue to improve roadways and provide ongoing maintenance to ensure the safety of all users of the roadway system.
Policy C-3.3 Enhance connectivity by eliminating gaps and barriers in roadway, bikeway, and pedestrian networks.
Policy C-3.4 Implement traffic calming techniques, where appropriate, as a means to improve safety, increase efficiency of pick-up and drop-off operations at schools, and provide greater separation between pedestrians and vehicles.
Policy C-3.6 Maintain a roadway circulation system with multiple alternative routes, to the extent feasible, to ensure mobility in the event of emergencies, and to minimize the need for capacity increases on particular streets. As needed, use signage to direct traffic to alternative routes during peak periods.
Policy C-3.7 Consider traffic circles as an intersection traffic control option, where feasible and appropriate.
Policy C-3.8 Maintain safety throughout the circulation system by taking opportunities to introduce a safe design speed to any new roadways or during improvements to existing roads or intersections.
Policy C-3.9 Reduce accident risk on arterial streets by consolidating and minimizing driveways whenever possible.
Goal 4.0: Adequate measures to enforce speed limits in residential neighborhoods and reduce cut-through truck and bus traffic.
Policy C-4.1 Establish designated truck routes located away from residential areas and prohibit trucks from traversing through residential neighborhoods.
Policy C-4.2 Work to discourage through traffic into residential neighborhoods by implementing traffic calming measures.
Policy C-4.3 Enhance the quality of life in the City’s neighborhoods and minimize impacts on schools, hospitals, convalescent homes, and other sensitive facilities through the implementation of traffic calming measures in these areas to reduce vehicle speeds and discourage cut-through traffic.
Policy C-4.4 Work with responsible and affected agencies to enhance infrastructure to facilitate timely movement of goods.
Policy C-4.5 Enforce the use of designated truck routes for both local and regional goods transport.
Goal 5.0: Adequate funding to support build-out of the City’s multi-modal transportation system, linked to the capital improvements program.
Policy C-5.1 Develop and maintain a transportation impact fee (TIF) program that collects fees from development projects based on the number of additional trips (across all modes of transportation) the development is projected to generate. The fees collected from the TIF program will be used to fund the construction of CIP projects as well as to administer and maintain the TIF program. In support of the TIF program, a comprehensive nexus study will be required to determine the cost required to adequately build-out the City’s transportation system, develop a fee structure that fairly collects the funds required to build-out the City’s transportation system from development projects and demonstrate that participation in the TIF program will mitigate a development projects transportation related impacts.
Policy C-5.2 Encourage improvements that minimize land acquisition and major construction, such as, but not limited to, lane restriping, enhanced road markings, synchronized traffic signals, Intelligent Transportation System (ITS) network management, and left turn lane restrictions.
Goal C-6.0: Compatibility with the regional mobility system.
Policy C-6.1 Consult with SANDAG regarding updates to and implementation of the Regional Transportation Plan (RTP).
Policy C-6.2 Consult with SANDAG regarding Active Transportation programs and grant opportunities for capital and planning-related bicycle, pedestrian, and traffic calming efforts.
Policy C-6.3 Work with Caltrans and adjacent jurisdictions to plan and implement future roadway connections and circulation improvements.
Policy C-6.4 Consult with NCTD regarding local bus routes and related activities.
Policy C-6.5 Support and encourage access to I-5 carpool lanes.
Goal C-7.0: A public transportation system that is safe, convenient, efficient, and meets the identified needs of the Solana Beach community.
Policy C-7.1 Support the establishment of local transit operations when demand levels are sufficient to warrant such service.
Policy C-7.2 Provide multi-modal support facilities near and to/from transit stops for bicyclists and pedestrians, including children and youth, the elderly, and persons with disabilities.
Policy C-7.3 Encourage responsible agencies to provide a well-designed transit system that meets the needs of the community, commerce, and visitors.
Policy C-7.4 Improve bus stops and shelter facilities to increase the comfort of users.
Policy C-7.5 Encourage transit providers to post route maps and pick-up/drop-off times at each stop.
Policy C-7.6 Work with transit providers to maintain and enhance services within the City that are timely, cost-effective, and responsive to growth and redevelopment.
Policy C-7.7 Encourage responsible agencies and affected businesses to provide shuttle service between transit stations to major activity centers, such as the Del Mar Fairgrounds.
Policy C-7.8 Work with responsible agencies to provide convenient bus stop locations.
GOAL 8.0: Safe alternatives to motorized transportation that meet the needs of all city residents, reduce vehicle trips, save energy, and improve air quality.
Policy C-8.1 Encourage businesses to provide flexible work schedules for employees.
Policy C-8.2 Encourage employers to offer shared commute programs and/or incentives for employees to use transit.
Policy C-8.3 Require new or expanded uses to provide adequate bicycle parking and support facilities.
Policy C-8.4 Encourage carpooling and other shared commute programs.
Policy C-8.5 Encourage the use of alternative transportation modes.
Policy C-8.6 Prioritize attention to transportation issues along routes to schools to reduce school-related vehicle trips.
Policy C-8.7 Seek opportunities to reduce vehicle trips before requiring physical roadway improvements.
Goal C-9.0: A comprehensive and integrated bikeway system, which provides for the safe and efficient movement of cyclists.
Policy C-9.1 Prioritize the development of bicycle facilities along Lomas Santa Fe, Stevens Avenue, Highway 101, and near schools.
Policy C-9.2 Develop a citywide bicycle network consisting of Class I bike paths, Class II bike lanes, Class III bicycle routes, and other innovative facilities such as cycle tracks, sharrows, buffered bike lanes, and bicycle boulevards.
Policy C-9.3 Maximize opportunities for citizen input to the process of planning a bikeway system.
Policy C-9.4 Maximize the use of public property (e.g., utility and drainage easements, railroad right-of-way) and lightly traveled roadways for bikeways.
Policy C-9.5 Expand and improve the bikeway system and facilities by establishing bike lanes, separated paths, and bicycle storage facilities at major destinations.
Policy C-9.6 Require new development and redevelopment to provide safe, secure bicycle parking facilities.
Policy C-9.7 Require new commercial development and redevelopment to provide connections to existing and proposed bicycle routes, where appropriate.
Policy C-9.8 Encourage existing businesses and new development or redevelopment projects to promote bicycling and provide bike rack facilities, personal lockers, and shower rooms.
Policy C-9.9 Encourage bicycling through education and promotional programs, in conjunction with the local school districts.
Policy C-9.10 Keep abreast of bicycle facility innovations in other cities and regions, and seek to incorporate these into the bicycle network.
GOAL 10.0: A universally accessible, safe, and convenient system of sidewalks or pathways throughout the city that encourages walking and is harmonious with the surrounding neighborhood.
Policy C-10.1 Prioritize pedestrian circulation within the vicinity of the Cedros Design District, along Highway 101, along Lomas Santa Fe, and near schools, the transit station, and bus stops.
Policy C-10.2 Develop a citywide pedestrian network consisting of sidewalks along roadways, trails, Class I multi-use paths, and pedestrian bridges.
Policy C-10.3 Provide connectivity of wide, well-lit walking environments with safety buffers between pedestrians and vehicular traffic, when feasible.
Policy C-10.4 Require new development and redevelopment to provide adequate pedestrian access and, where appropriate, incorporate pedestrian-oriented street designs that provide a pleasant environment for walking.
Policy C-10.5 Identify and implement necessary pedestrian improvements with special emphasis on providing safe access to schools, parks, community and recreation centers, shopping districts, and other appropriate facilities.
Policy C-10.6 Promote walking and biking as the primary modes of travel to schools.
Policy C-10.7 Improve pedestrian safety at intersections and mid-block crossings.
Policy C-10.8 Reduce architectural barriers that restrict full movement and access by less mobile segments of the population consistent with the Americans with Disabilities Act.
Policy C-10.9 Apply universal design standards to the pedestrian system.
Policy C-10.10 Provide a continuous pedestrian network (which may or may not include sidewalks) within and between neighborhoods to facilitate pedestrian travel free from major impediments and obstacles.
Policy C-10.11 Support the development of pedestrian corridors in key activity centers.
GOAL C-11.0: An adequate supply of private off-street and public parking to meet the needs of residents and visitors to the city in a way that balances economic development, livable neighborhoods, environmental health, and public safety.
Policy C-11.1 In general, maintain parking requirements for specified land uses, but allow for a reduction in parking requirements for existing buildings that change uses and cannot accommodate current parking standards without significantly altering the site. In determining what constitutes sufficient parking under these circumstances, the City may take into consideration: 1) the overall effectiveness of the circulation system as a whole (i.e., pedestrians, bicyclists, motorized vehicles, etc.); 2) the particular needs of a specific location and/or project; 3) the parking generation demand of the proposed use; 4) the availability of public parking spaces; and 5) the ability of the project to aid in the reduction of personal vehicle use and the corresponding reduction in air pollution, energy consumption, greenhouse gas emissions, and other environmental effects.
Policy C-11.2 Ensure balance among visitor, business, and residential parking needs.
Policy C-11.3 Encourage new development and redevelopment to locate off-street parking facilities behind storefronts to create a more inviting environment adjacent to the street, where feasible.
Policy C-11.4 Require parking lots to provide shade through the use of landscaping (i.e., a tree canopy) and encourage the use of solar photovoltaic shading to reduce the heat island effect, where feasible.
Policy C-11.5 Where appropriate and feasible, provide on-street diagonal or parallel parking to increase the number of spaces and calm traffic to create more pedestrian-friendly streets.
Policy C-11.6 Require the use of universal design standards in parking design and compliance with the Americans with Disabilities Act accessibility guidelines.
Policy C-11.7 Provide clearly marked pedestrian paths between on-street parking, off-street parking facilities, and the buildings they serve, where feasible.
Policy C-11.8 Maintain parking time limitations, where appropriate.
Policy C-11.9 Work cooperatively with developers and the business community to develop funding mechanisms for the construction of future parking facilities.
Policy C-11.10 Encourage shared parking, valet parking, special district parking, and joint development of parking facilities to the maximum extent feasible.
Goal C-12.0: Efficient, high quality public infrastructure, facilities, and services and assurance that new, upgraded, or expanded facilities and services are phased in conjunction with the development they are intended to service.
Policy C-12.1 Establish and maintain a development strategy relating economic growth and logical land use and circulation patterns with the provision of public services and utilities.
Policy C-12.2 Periodically review and update land use and circulation plans to ensure that a balance is maintained between employment and housing opportunities, and to ensure the availability of sufficient municipal revenues to maintain adequate levels of public services.
Policy C-12.3 Develop and implement methods for ensuring that new development does not create an adverse economic impact on the City, or a need for new additional or different public facilities which have not been provided by the City.
Policy C-12.4 Require new development and redevelopment to provide fair share contributions toward the costs of the public facilities, services, and infrastructure necessary to serve the development, including, but not limited to, transportation, water, sewer and wastewater treatment, solid waste, flood control and drainage, schools, fire and law enforcement protection, and parks and recreation.
Policy C-12.5 Ensure that development impact fees reflect the costs of improvements.
Policy C-12.6 Update the capital improvement program for the improvement of existing public facilities and the development of new facilities, as needed, and plan for the equitable distribution of infrastructure improvements and public facilities.
Policy C-12.7 Leverage federal and state funds to support public works projects, as appropriate.
IV. Circulation Plan
The City’s Circulation Plan promotes the concept of complete streets, which are transportation facilities that are planned, designed, constructed, and operated to provide safe and efficient mobility for users of all abilities and ages. The emphasis on active, alternative modes of transportation, such as walking, cycling, and using transit, provides many benefits, including increased overall capacity of the transportation network, less need for costly roadway expansions, improved air quality, a reduction in greenhouse gases, and improved quality of life. In addition to developing multi-modal street typologies, this Element incorporates performance methodologies for all modes of travel.
Much of Solana Beach was developed prior to the City’s incorporation in 1986. As a result, many streets are constructed to standards that do not conform to current street typologies and/or do not have existing rights-of-way to accommodate the roadway classifications identified on the Circulation Plan. This is especially true in residential neighborhoods, where the semi-rural “beachy” character is valued by residents. For streets that are not currently built to the standards proposed in the Circulation Element, the City may require dedication of right-of-way as a condition of land development. This is expected to occur along key boulevards and corridors rather than on local residential streets.
A. Street Typologies
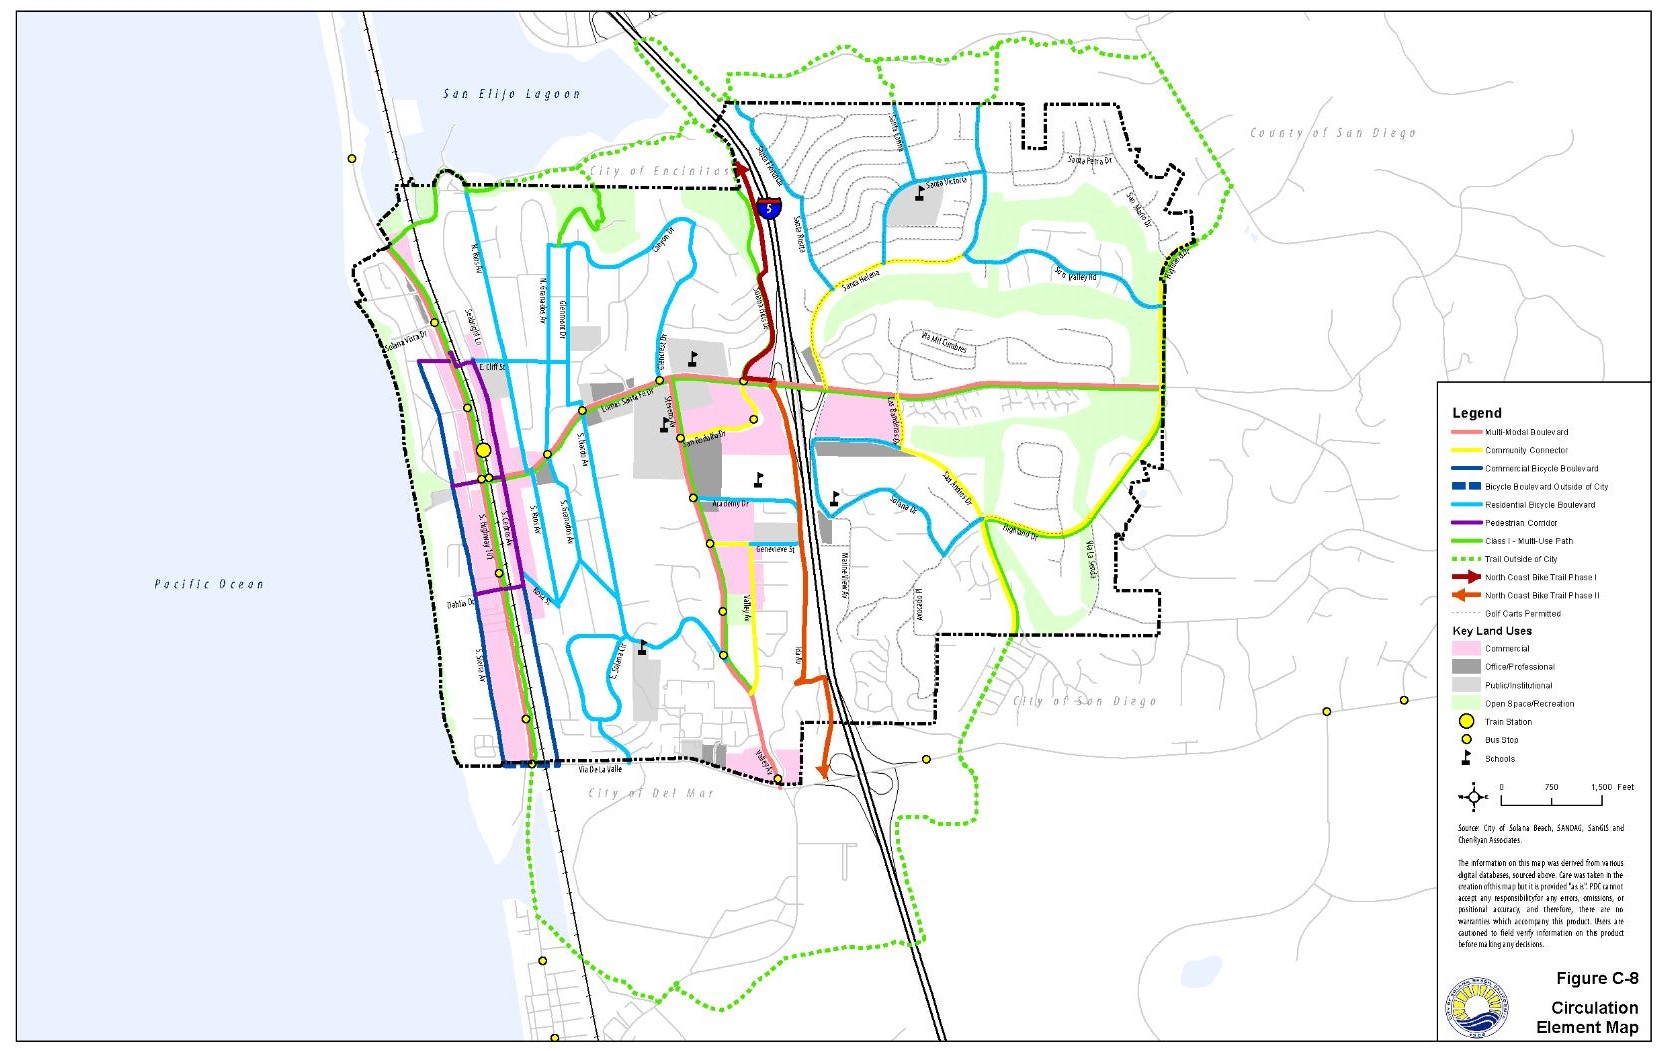
The City of Solana Beach’s multi-modal circulation system provides enhanced connectivity, safety, and comfort for all transportation options. The following street typologies have been developed based on complete street principles to better balance the needs of all roadway users. Refer to the Circulation Plan (Figure C-8), which identifies the streets in Solana Beach that are assigned to these various classifications.
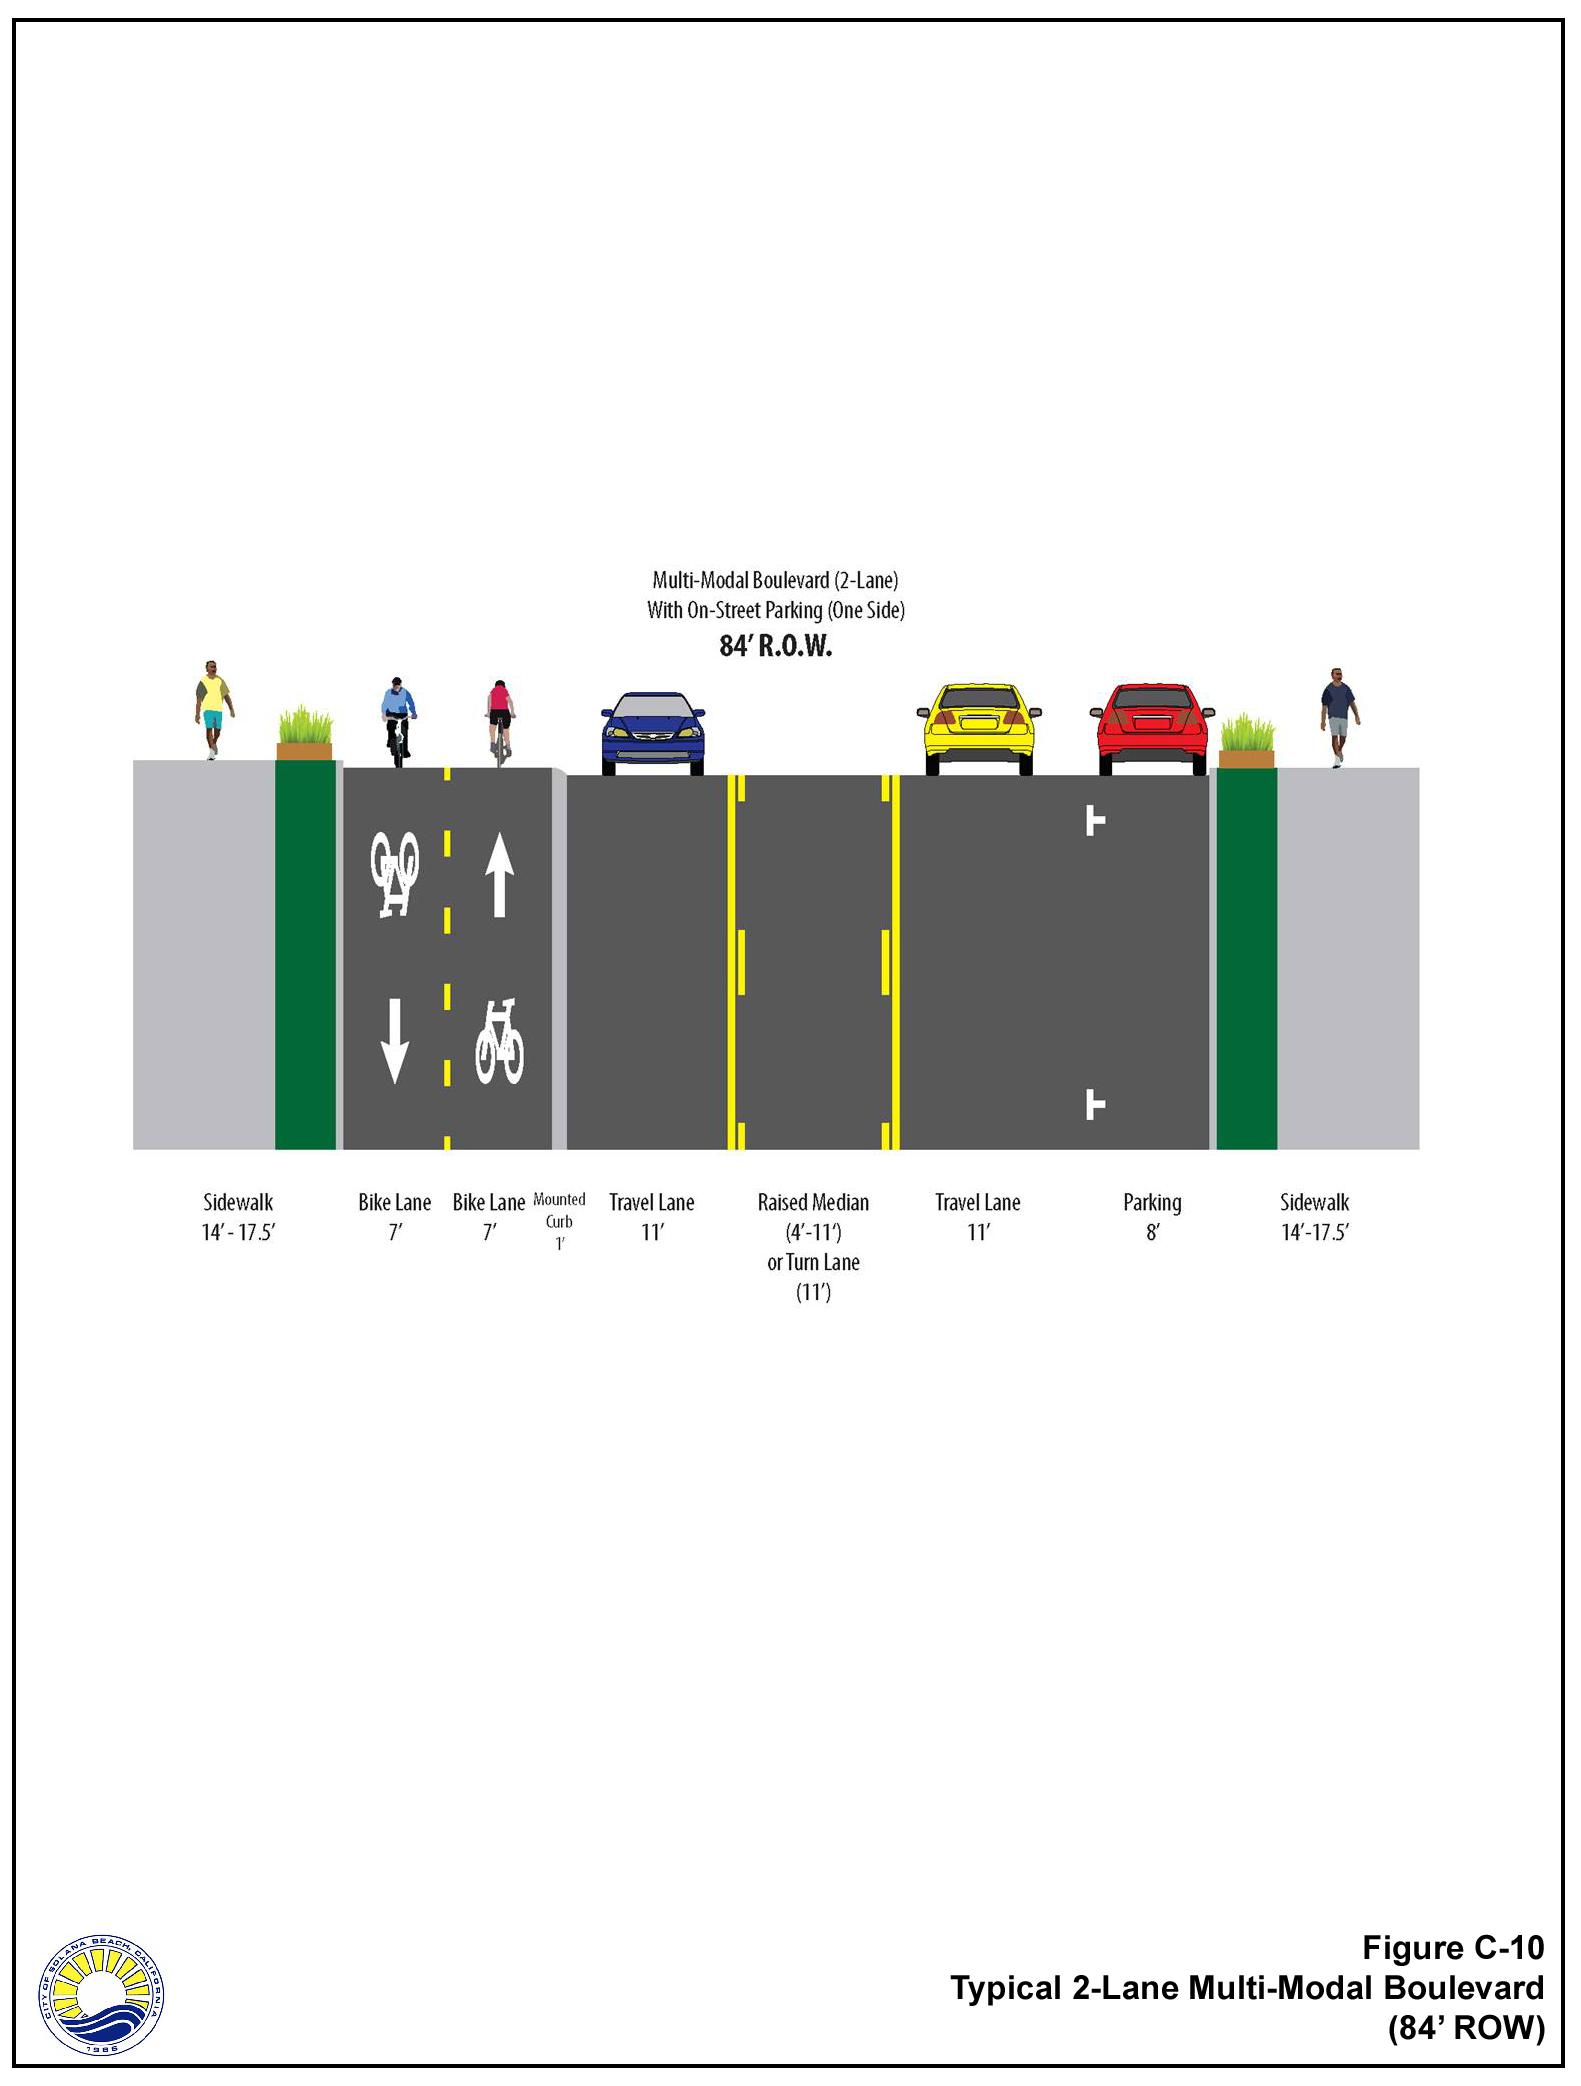
1. Multi-Modal Boulevard
Multi-modal boulevards are four-lane or two-lane divided roadways that provide access to major community amenities, commercial uses, and services within Solana Beach. They also serve as regional connections to cities to the north, south, and east of Solana Beach. These facilities should be balanced in their provision of mobility and accessibility by foot, bike, transit, and car and include separated bicycle facilities.
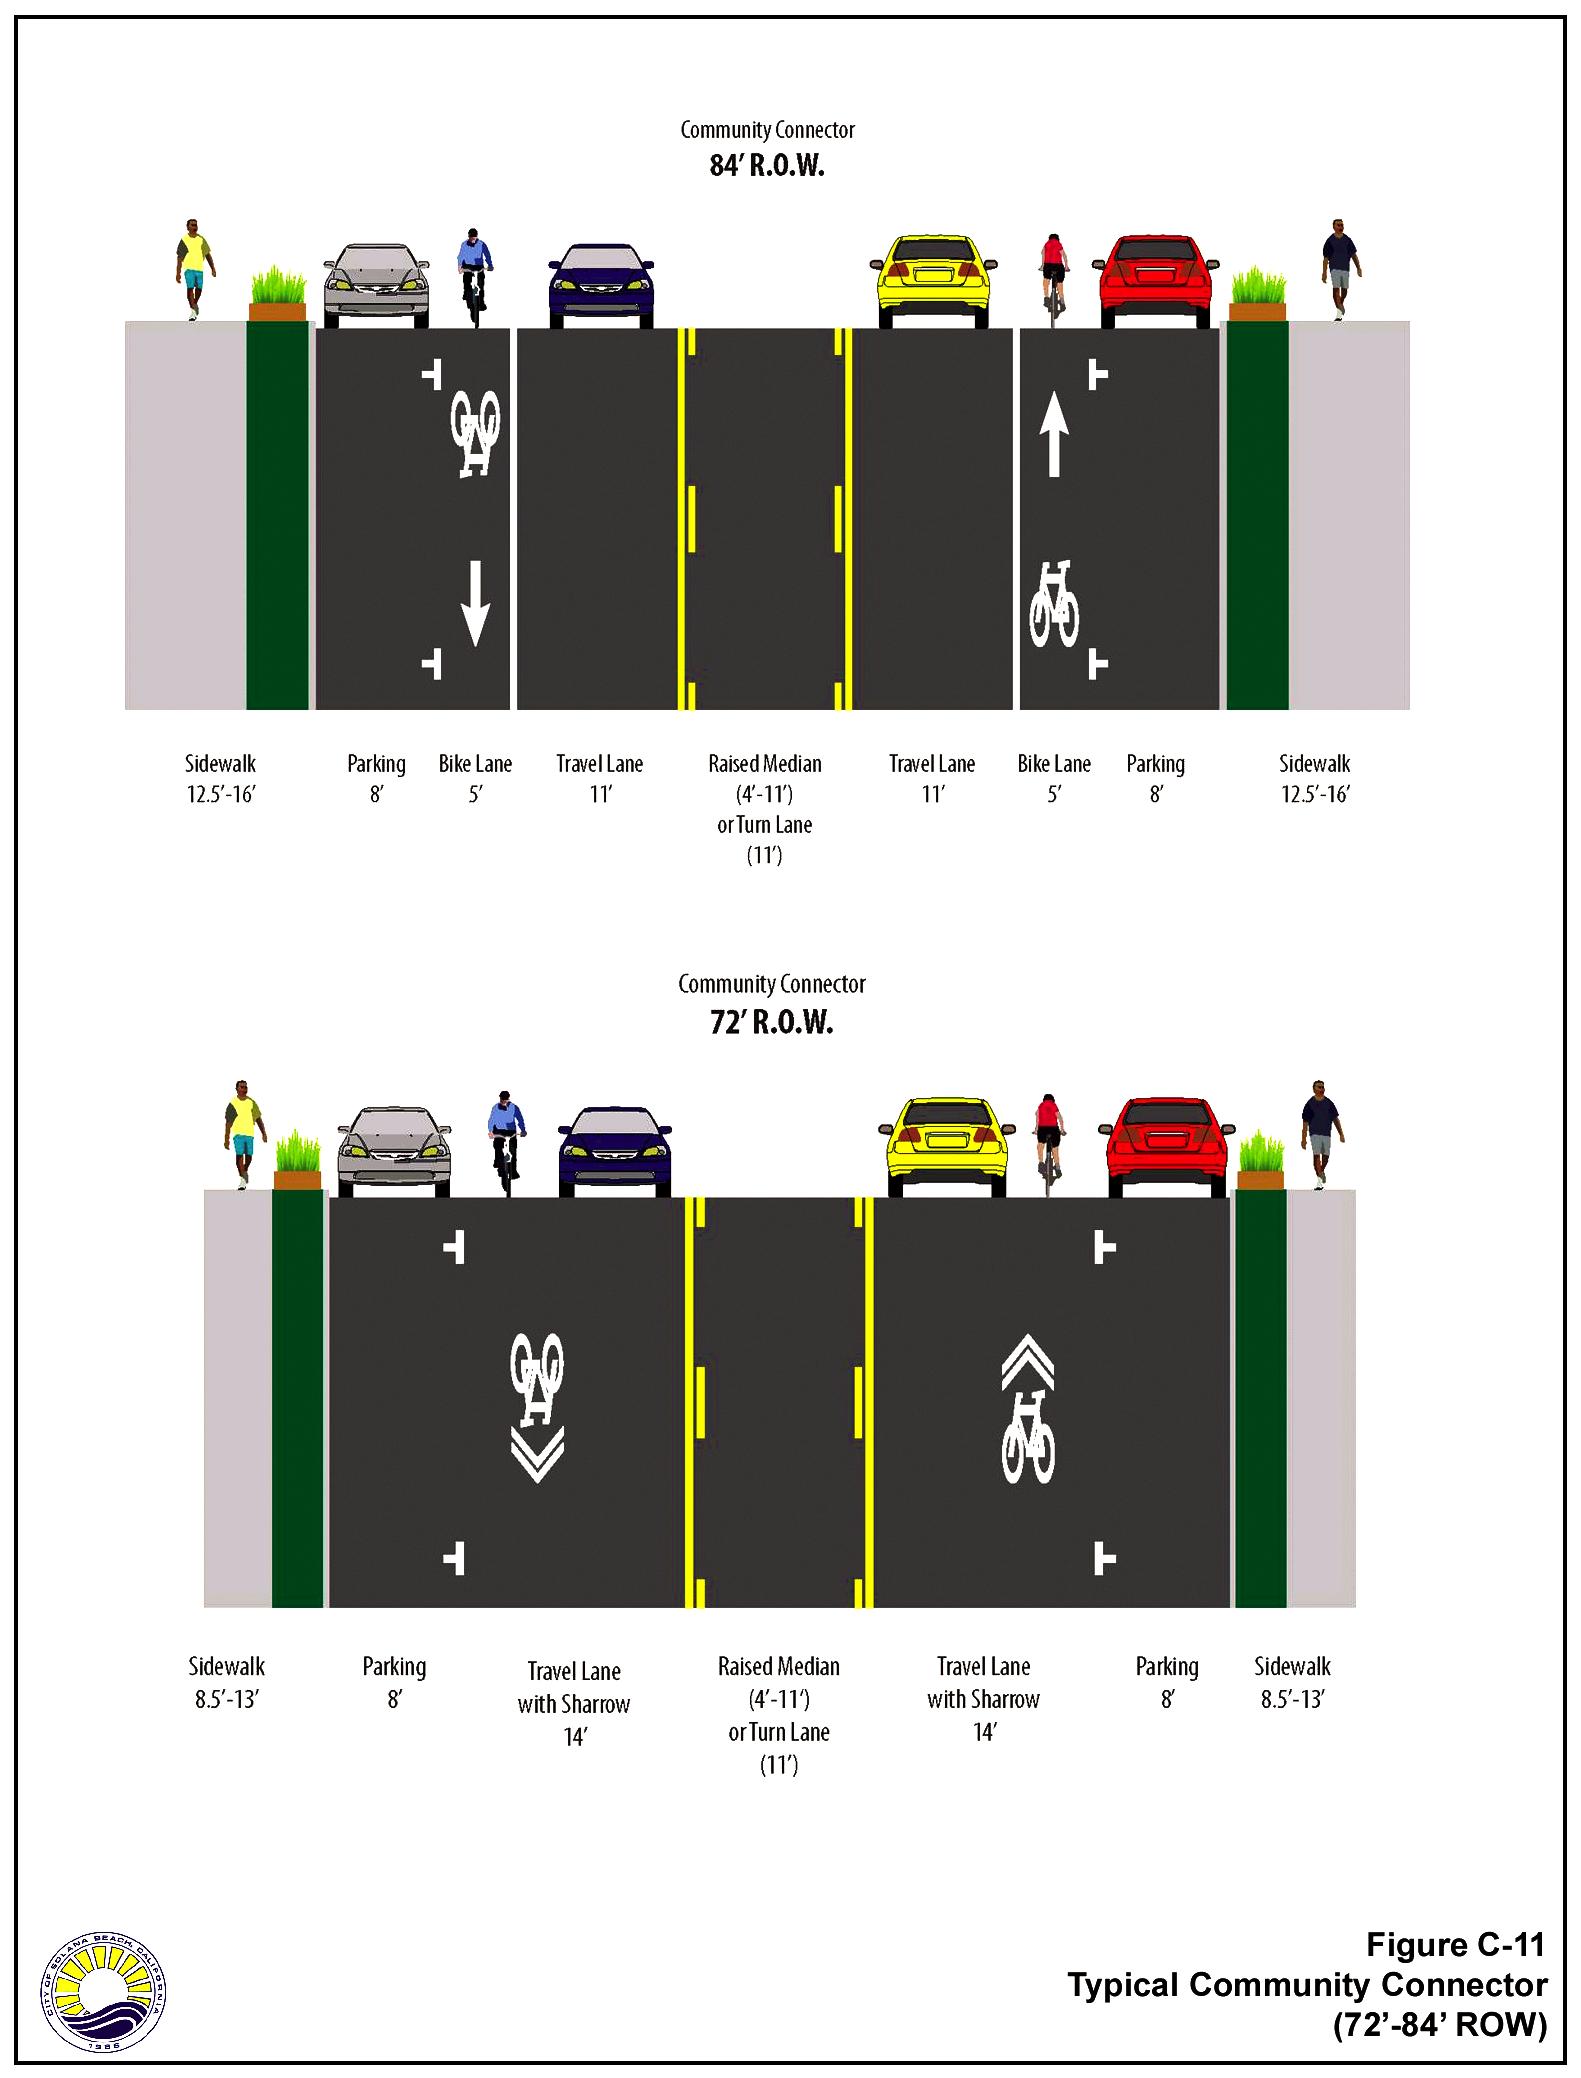
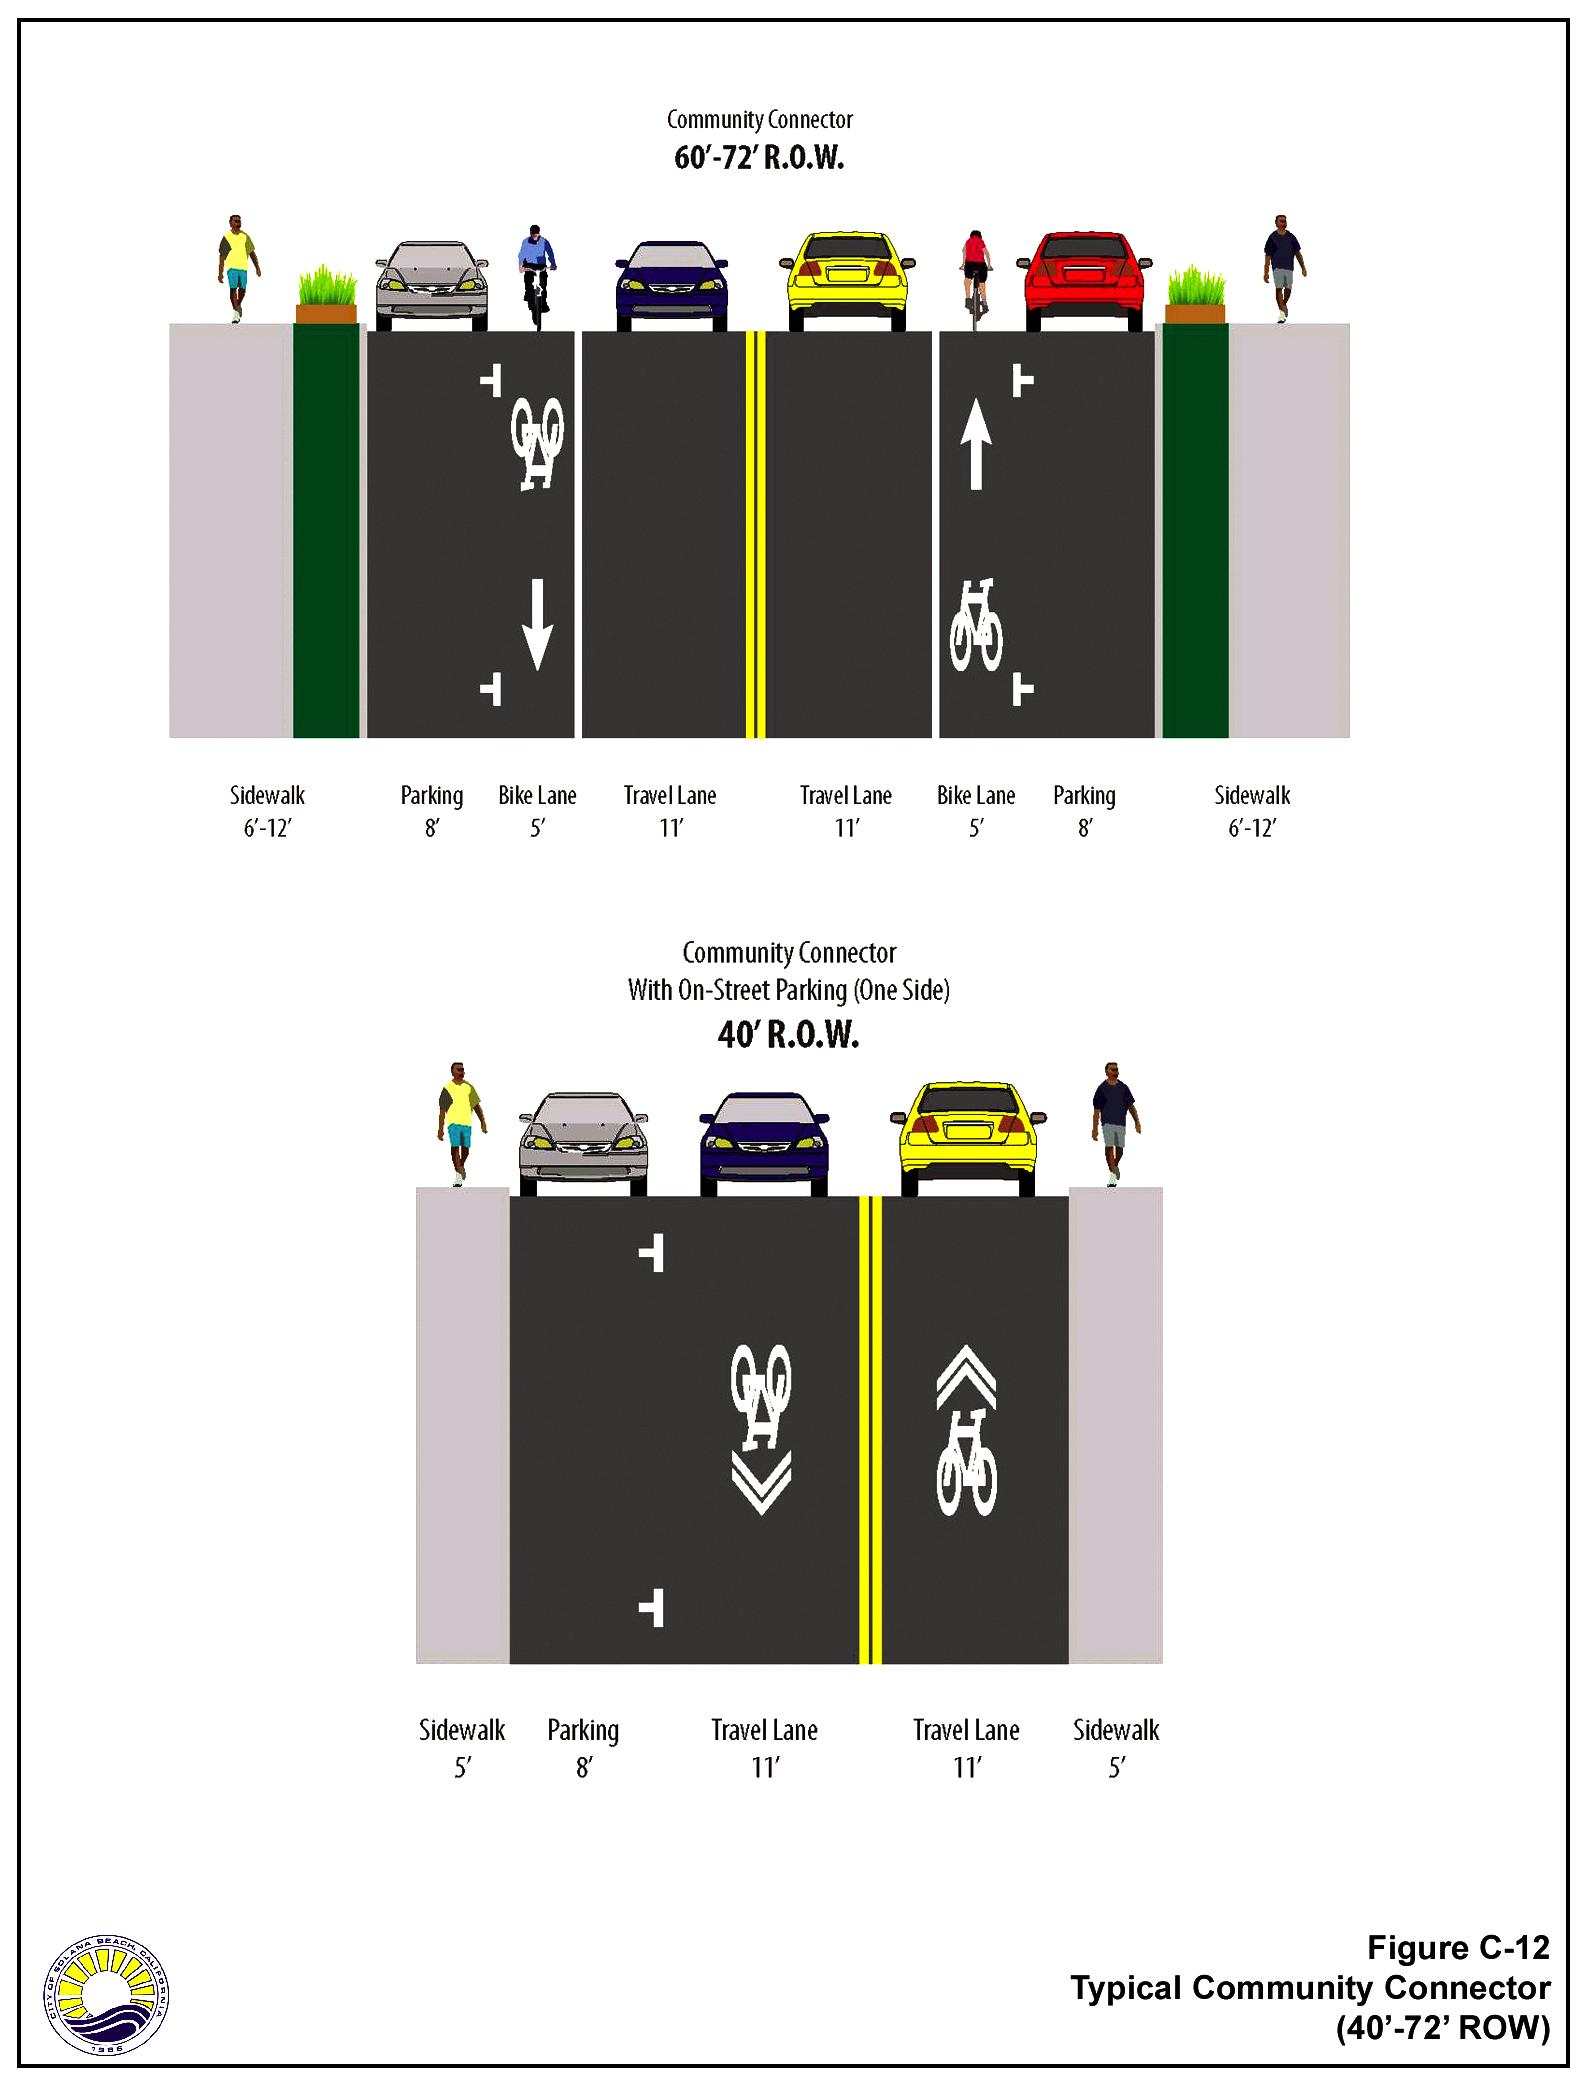
2. Community Connector
Community connectors are two-lane divided or undivided roadways that provide for a balanced mix of pedestrian, bicycle, and automobile access between residential neighborhoods, the city’s multi-modal boulevards, and points outside the city. The facilities should have enhanced bicycle and pedestrian treatments to ensure safe travel between residential neighborhoods and multi-modal boulevards or locations outside the city.
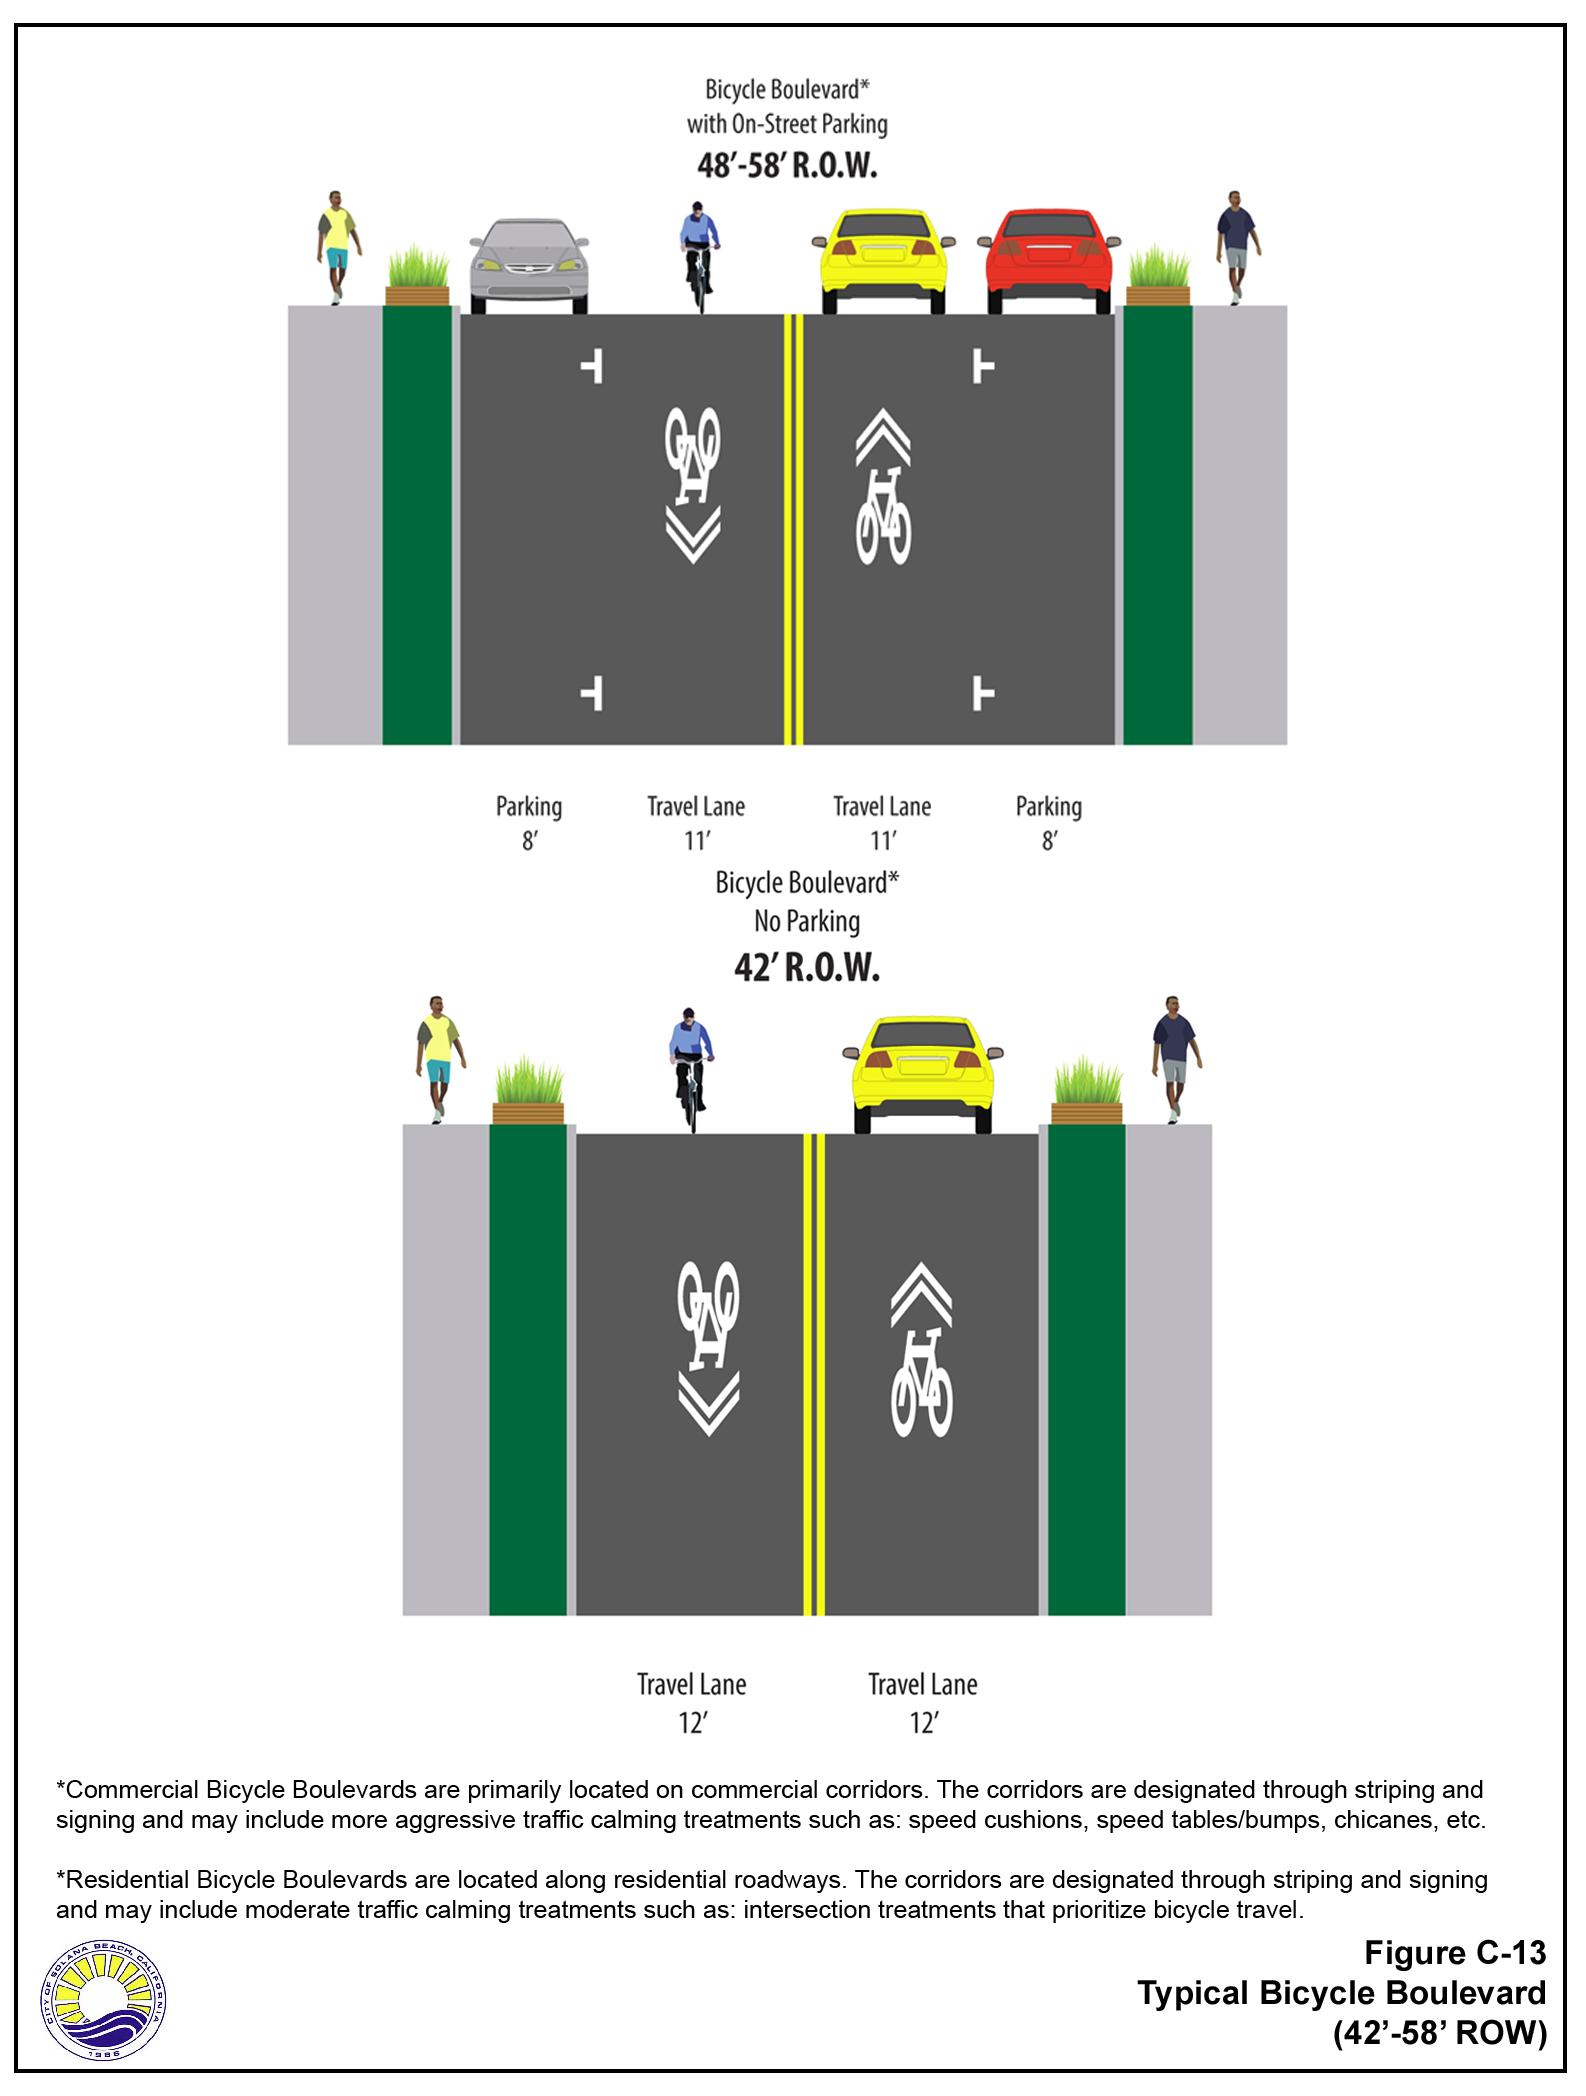
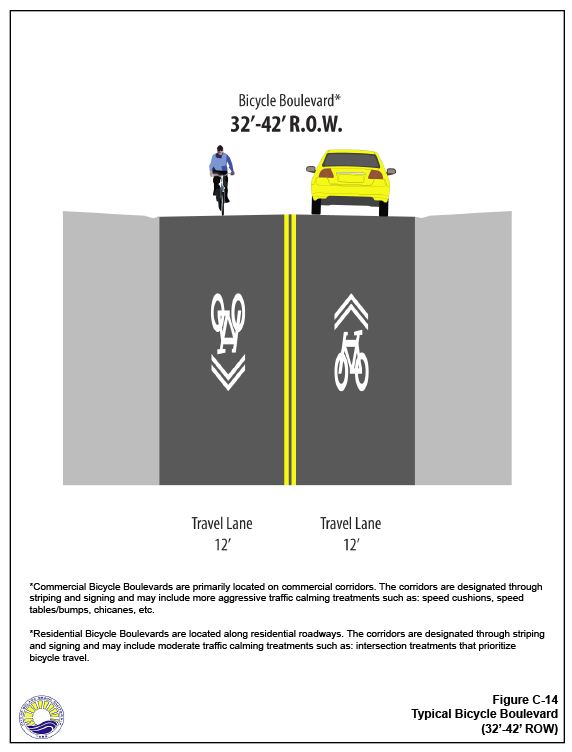
3. Bicycle Boulevard
Bicycle boulevards are two-lane roadways that provide pedestrian, bicycle, and automobile access, although non-motorized modes are distinctly prioritized through traffic calming, traffic diversion, and various bicycle treatments, such as vertical and horizontal signage, priority phasing for cyclists at signalized intersections, and wayfinding. The bicycle boulevard network allows for convenient and safe bicycle travel between residential neighborhoods and schools, commercial, transit, and recreation.
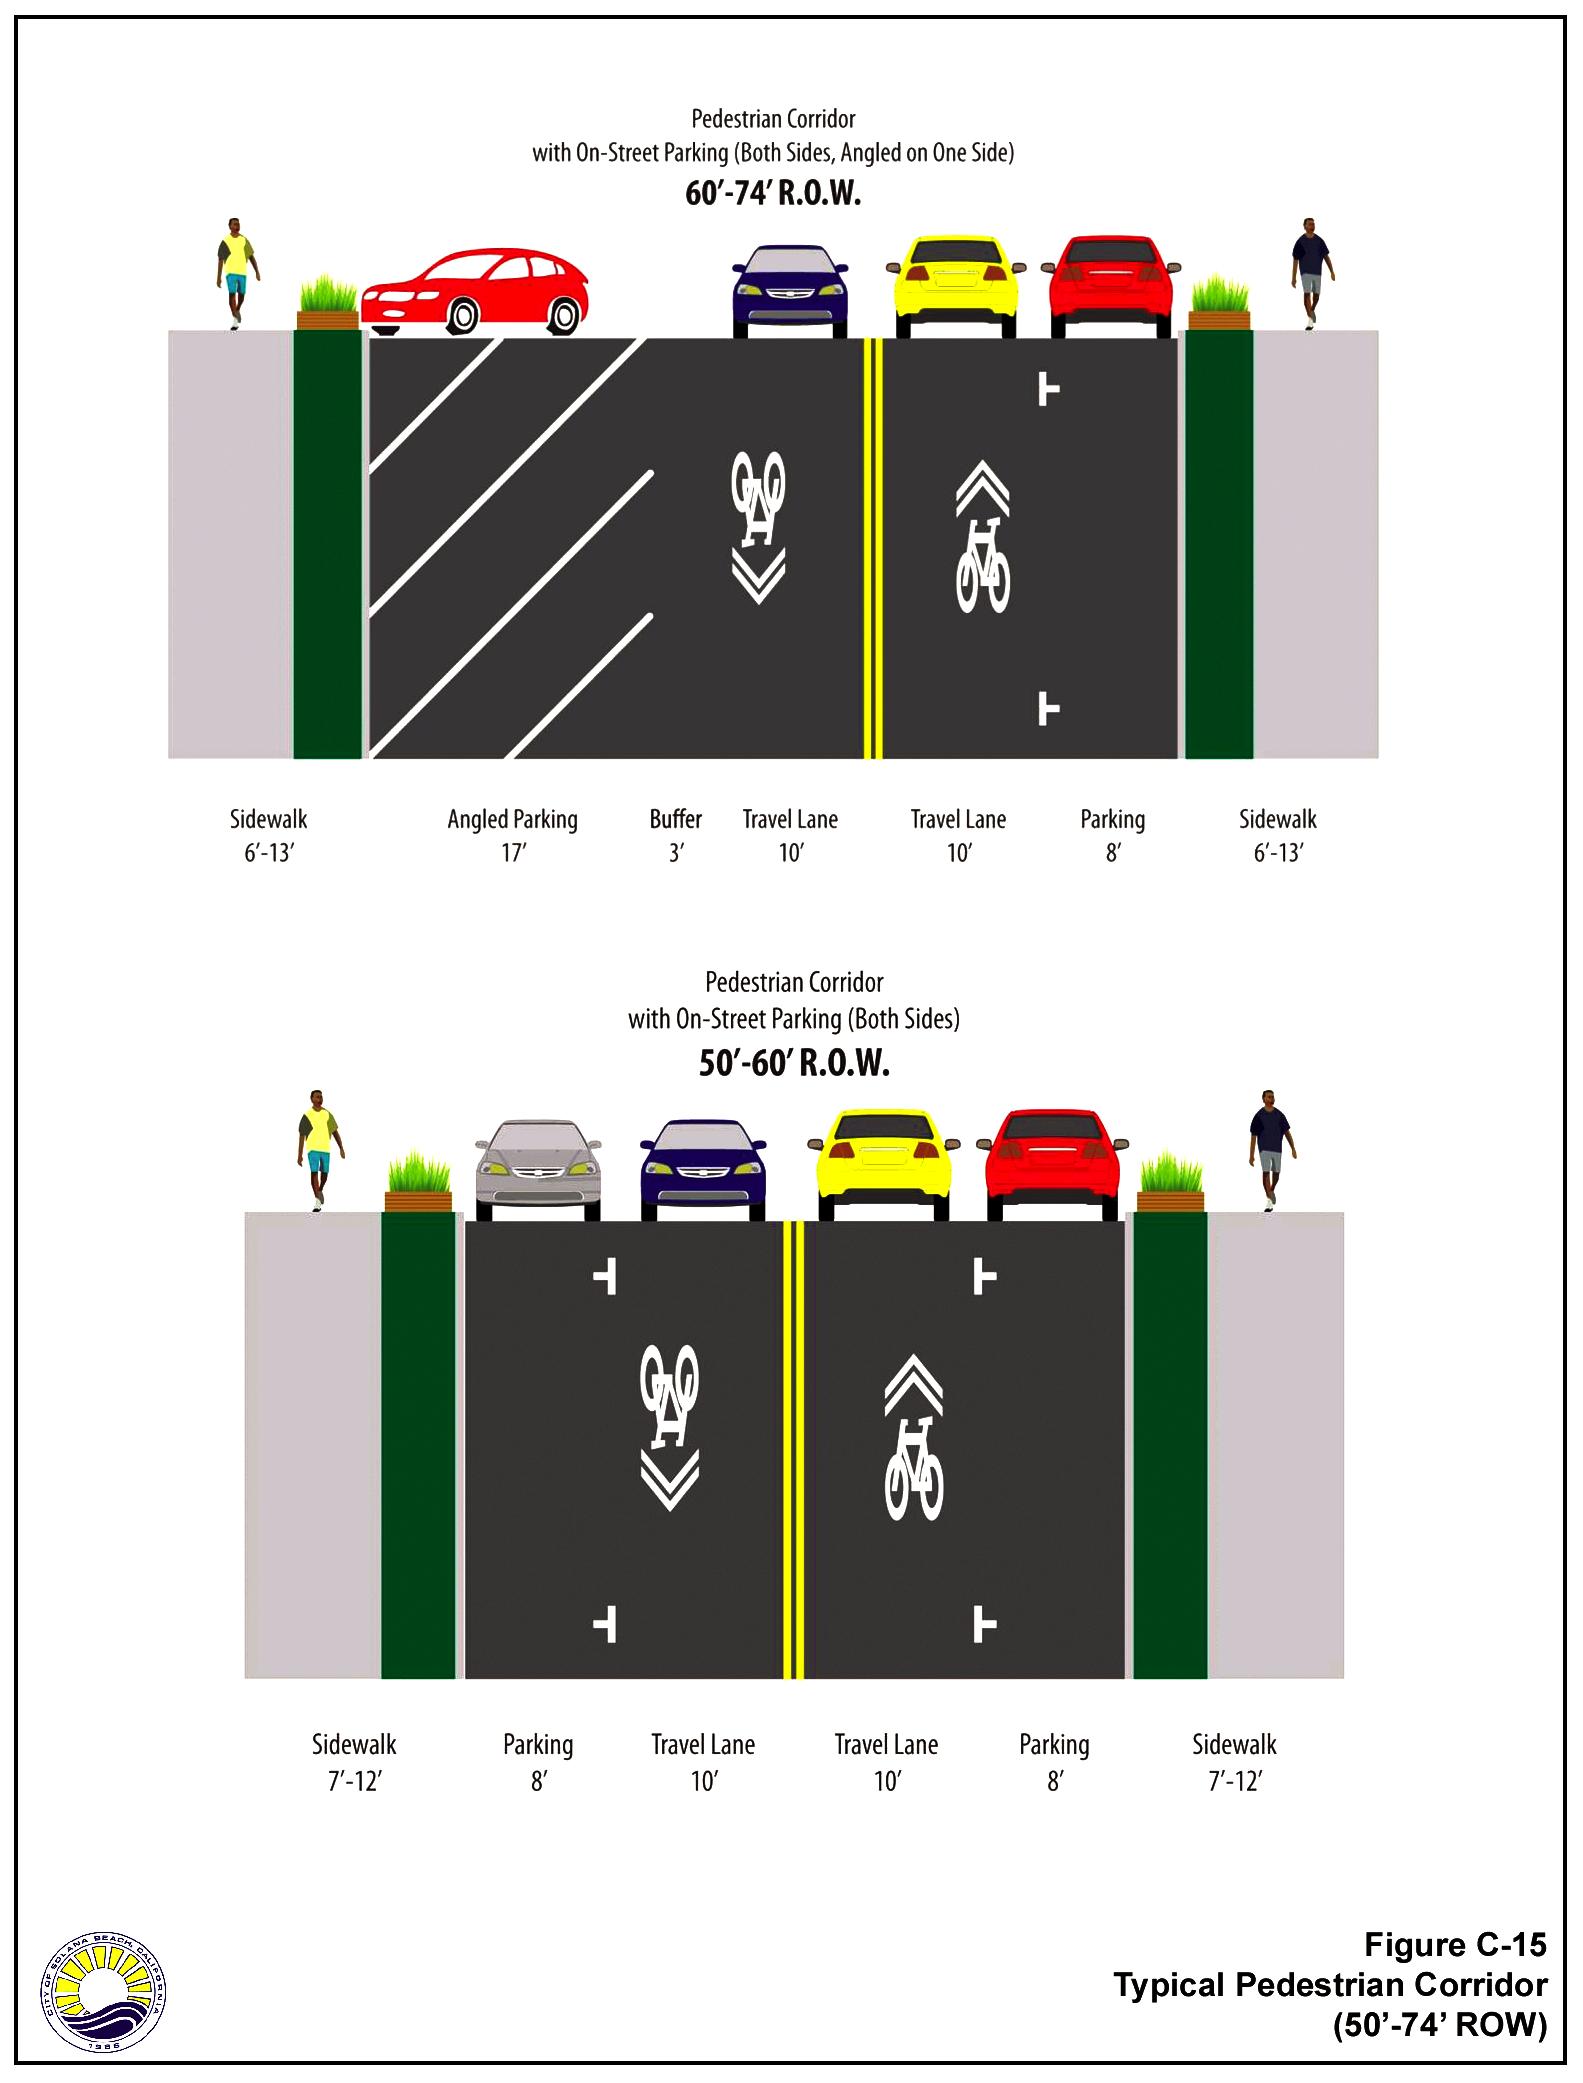
4. Pedestrian Corridor
Pedestrian corridors are two-lane roadways that provide pedestrian, bicycle, and automobile access, although pedestrian travel is distinctly prioritized through traffic calming and pedestrian treatments, such as raised crosswalks, high visibility crosswalks, bulb-outs, and pedestrian priority phasing at signalized crossings.
5. Class I Multi-Use Path
Class I multi-use paths provide a travel option for bicycle and pedestrian commuters and recreational users that is fully separated from automobile traffic.
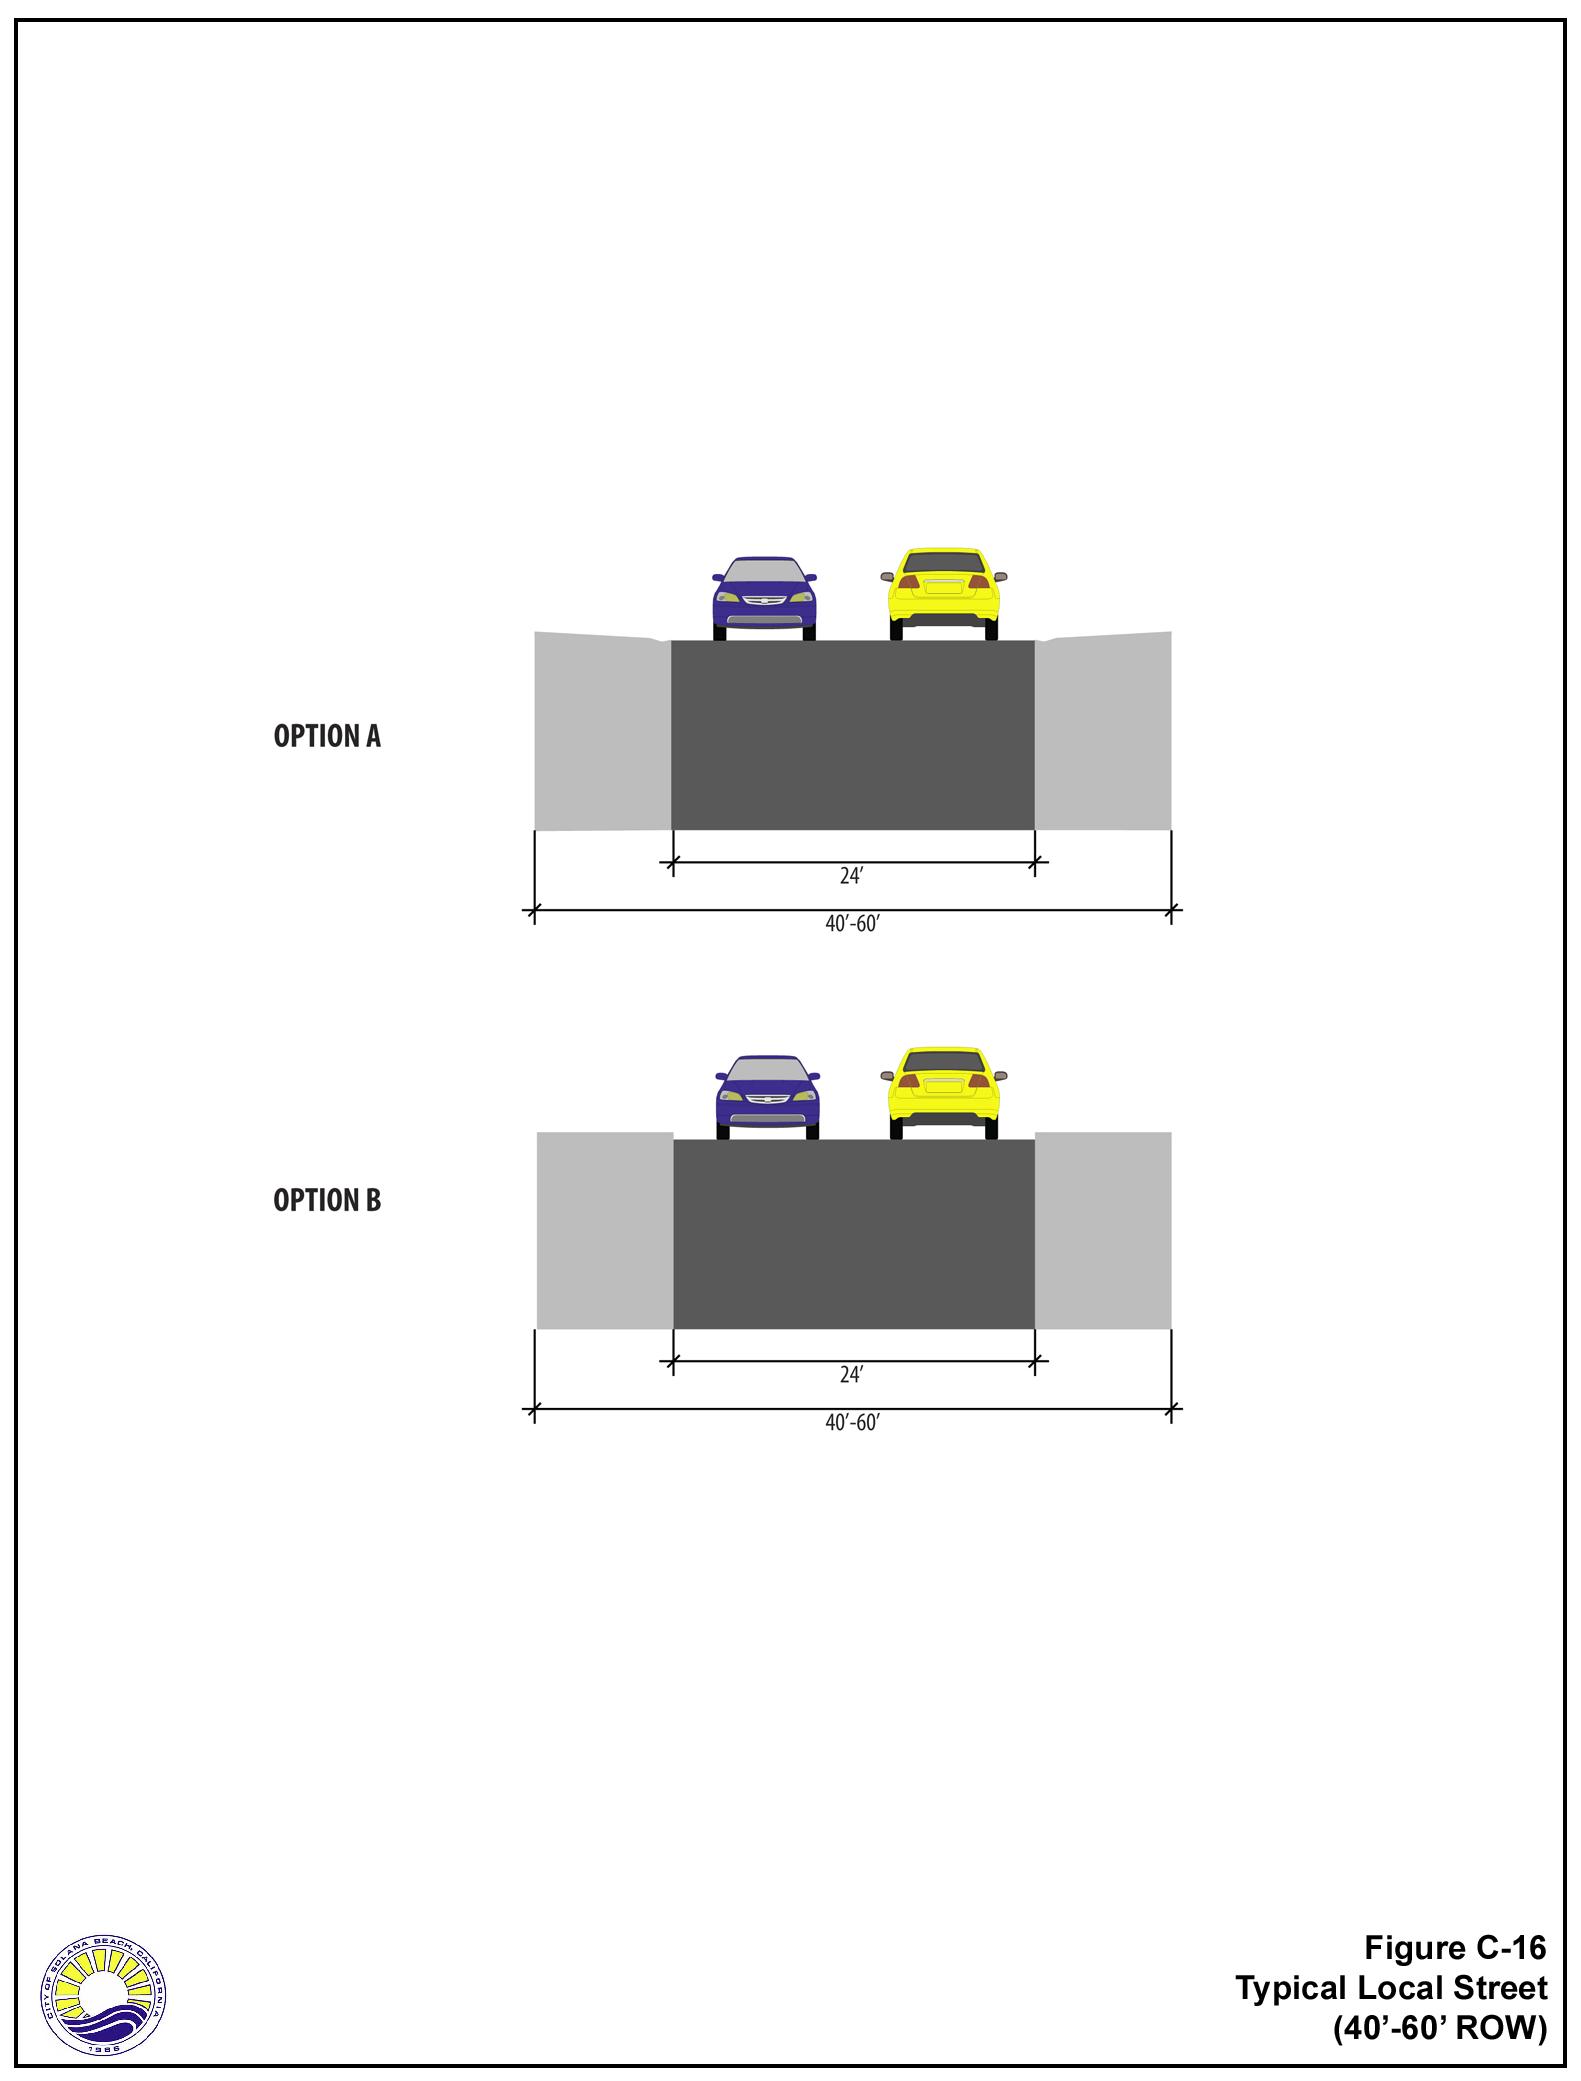
6. Local Streets
Local streets, not considered Circulation Element roads, are two-lane undivided roadways that provide access to adjacent residential land uses. These roadways should include traffic calming techniques to control vehicular speed and discourage cut-through traffic. The quality of life in residential areas takes the highest priority on local streets as the livability of these streets is paramount to the success of the neighborhoods.
B. Typical Cross Sections
Cross sections have been developed to illustrate the typical features associated with each of the street typologies (refer to Figures C-9 through C-16). The proposed enhancements were designed to maintain the existing community character and to minimize the need to acquire additional roadway width to the extent feasible. Table C-1 provides a description of the physical attributes for each roadway typology.
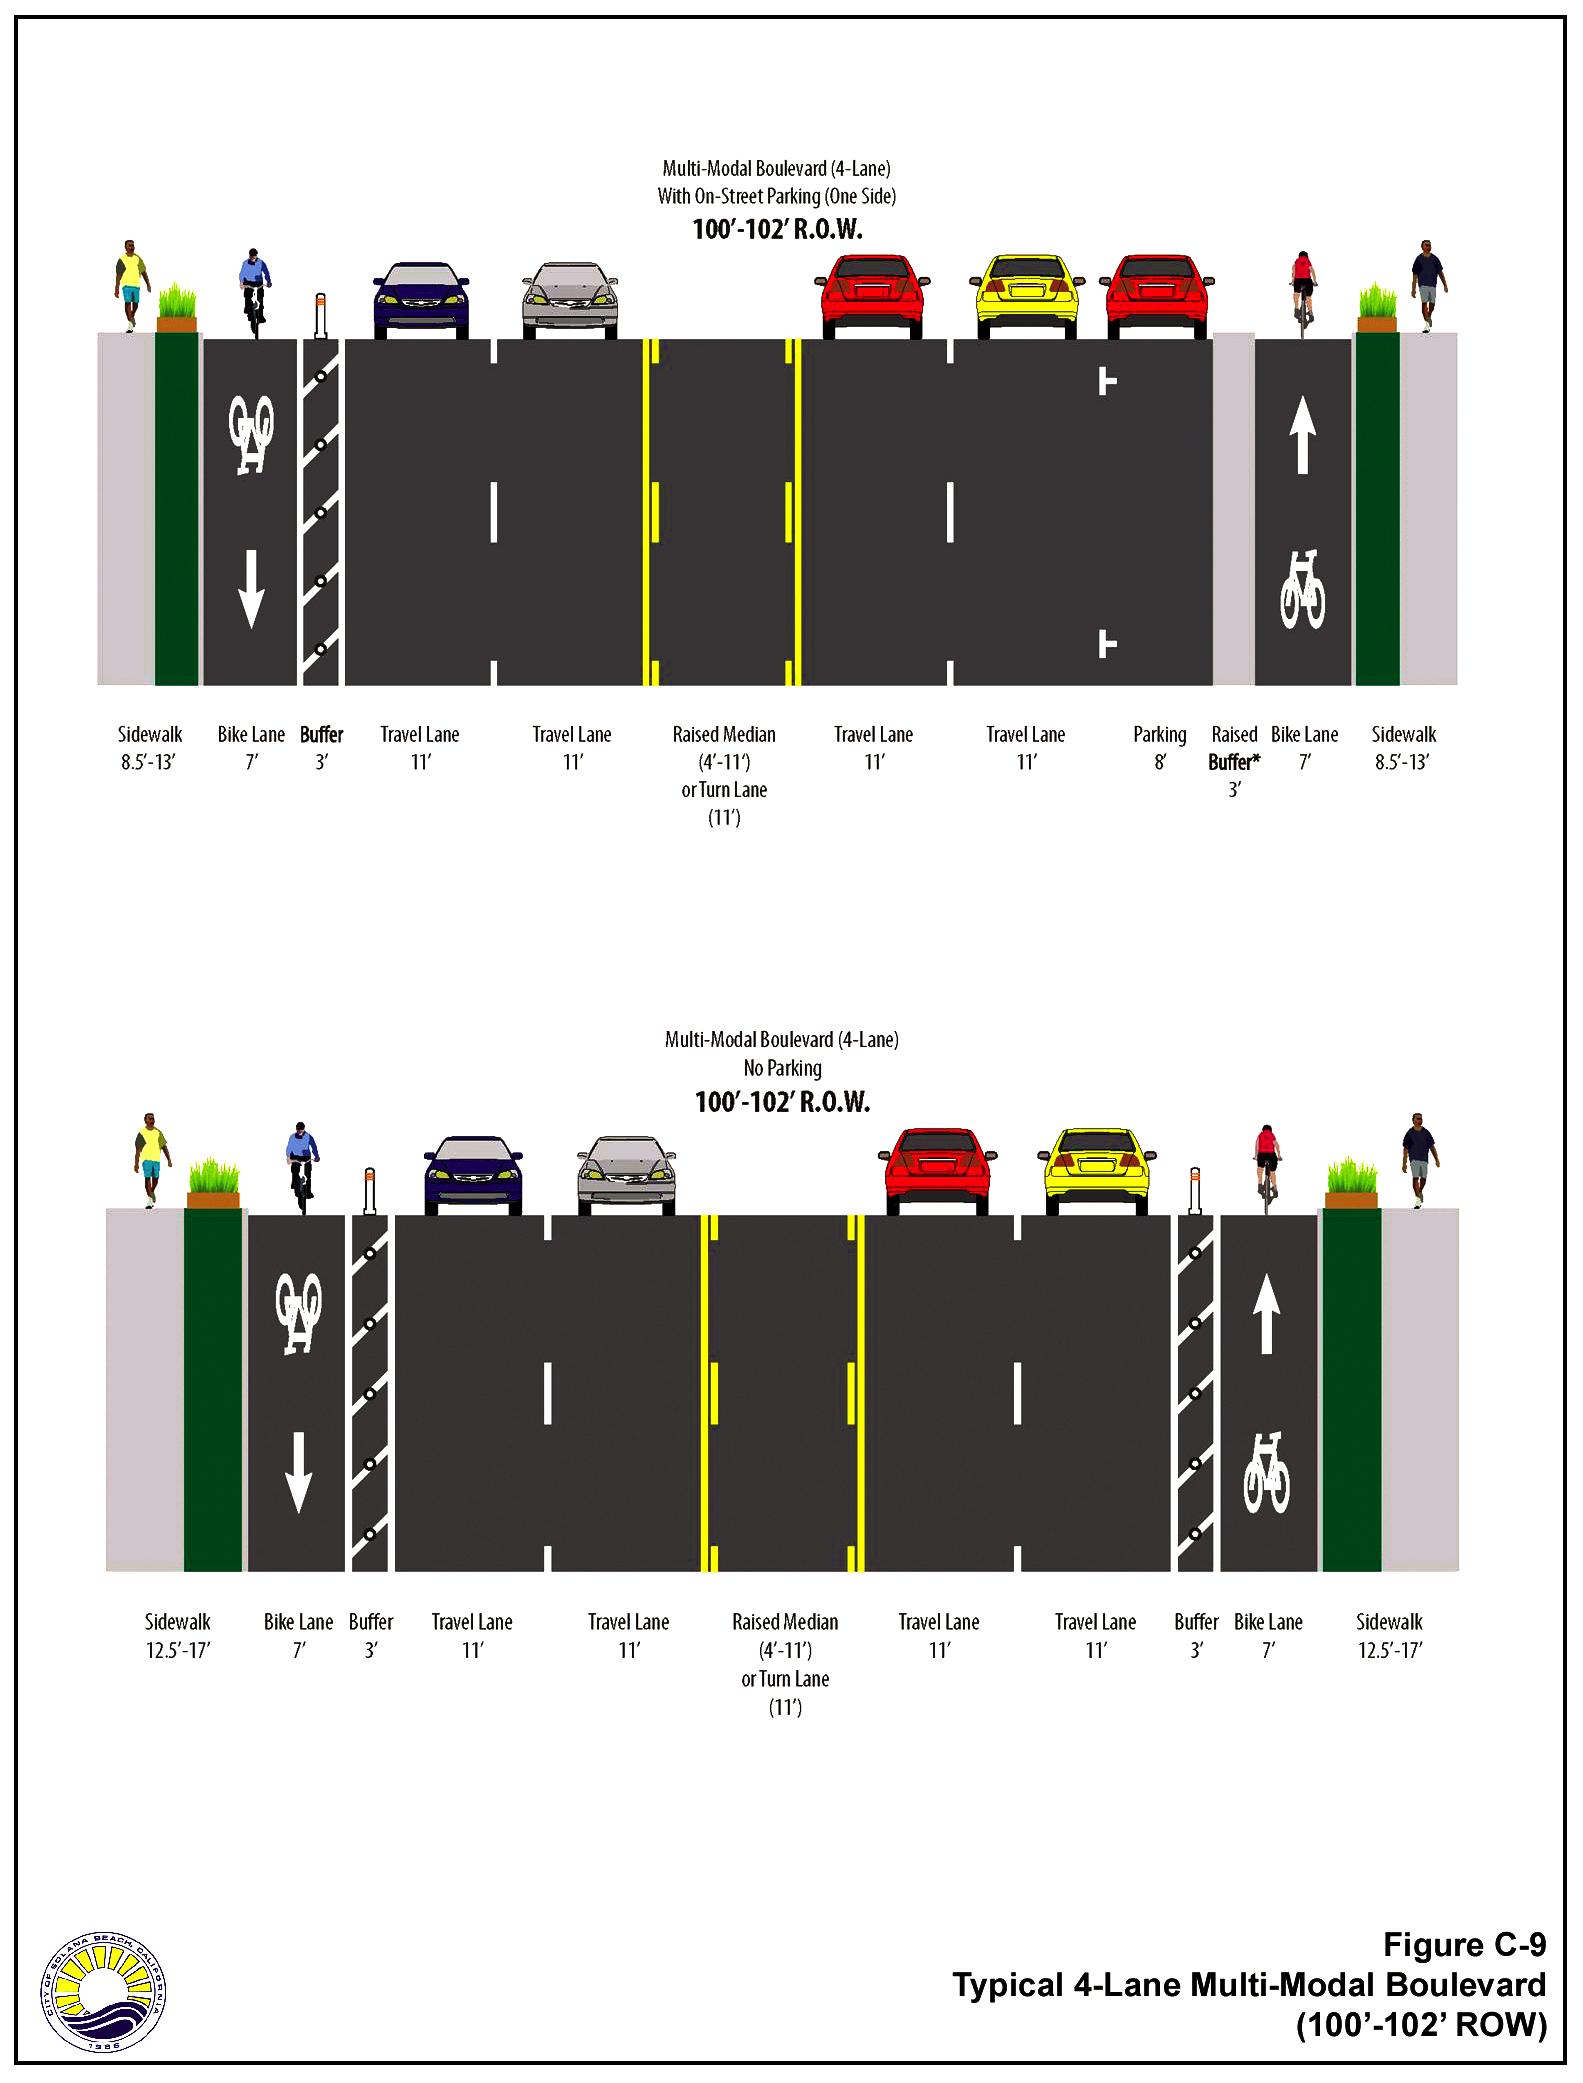
|
Figure Number |
Typology |
Minimum R-O-W |
Travel Lanes |
Parking |
Raised Median or Turn Lane |
Bicycle Facility |
Sidewalk or Pedestrian Walking Area (Curb to Property Line Distance) |
|---|---|---|---|---|---|---|---|
|
C-9 |
Multi-Modal Boulevard |
100’-102’ |
4-Lane (11’) |
No |
Yes (4’-11’) |
Cycle Track w/ Buffer1/Bike Lane |
Yes (12.5’–17’) |
|
C-9 |
100’-102’ |
4-Lane (11’) |
Yes (8’ on one side) |
Yes (4’-11’) |
Cycle Track w/ Buffer1/Bike Lane |
Yes (8.5’–13’) |
|
|
C-10 |
84’ |
2-Lane (11’) |
Yes (8’ on one side) |
Yes (4’-11’) |
Cycle Track w/ Buffer1/Bike Lane |
Yes (14’-17.5’) |
|
|
C-11 |
Community Connector |
84’ |
2-Lane (11’) |
Yes (8’ on both sides) |
Yes (4’-11’) |
Bike Lane (5’) |
Yes (12.5’-16’) |
|
C-11 |
72’ |
2-Lane (14’) |
Yes (8’ on both sides) |
Yes (4’-11’) |
Bike Route w/ Sharrows |
Yes (8.5’–13’) |
|
|
C-12 |
60’-72’ |
2-Lane (11’) |
Yes (8’ on both sides) |
No |
Bike Lanes (5’) |
Yes (6’–12’) |
|
|
C-12 |
40’ |
2-Lane (11’) |
Yes (8’ on one side) |
No |
Bike Route w/ Sharrows |
Yes (5’) |
|
|
C-13 |
Residential Bicycle Boulevard |
48’-58’ |
2-Lane (11’) |
Yes (8’ on both sides) |
No |
Bike Route w/ Multiple Treatments |
Yes (5’–10’) |
|
C-13 |
42’ |
2-Lane (12’) |
No |
No |
Bike Route w/ Multiple Treatments |
Yes (9’) |
|
|
C-14 |
32’-42’ |
2-Lane (12’) |
No |
No |
Bike Route w/ Multiple Treatments |
Optional2 |
|
|
C-13 |
Commercial Bicycle Boulevard |
48’-58’ |
2-Lane (11’) |
Yes (8’ on both sides) |
No |
Bike Route w/ Multiple Treatments |
Yes (5’-10’) |
|
C-13 |
42’ |
2-Lane (12’) |
No |
No |
Bike Route w/ Multiple Treatments |
Yes (9’) |
|
|
C-14 |
32’-42’ |
2-Lane (12’) |
No |
No |
Bike Route w/ Multiple Treatments |
Yes (4’-9’) |
|
|
C-15 |
Pedestrian Corridor |
60’-74’ |
2-Lane (10’) |
Yes (17’ + 3’ Buffer and 8’) |
No |
Bike Route w/ Multiple Treatments |
Yes (6’–13’) |
|
C-15 |
Pedestrian Corridor |
50’-60’ |
2-Lane (10’) |
Yes (8’ on both sides) |
No |
Bike Route w/ Multiple Treatments |
Yes (7’–12’) |
|
C-16 |
Local Street Option A |
40’-60’ |
2-Lane (10’) |
Yes |
No |
No |
Optional2 |
|
Local Street Option B |
40’-60’ |
2-Lane (10’) |
Yes |
No |
No |
Optional2 |
1) Notes: Cycle track can either be one-way serving both sides of the roadway, or two-way on one side of the roadway. A one-way cycle track would require a minimum of 16’, with each direction requiring a 5’ travelway and a 3’ buffer. A two-way cycle track would require a minimum of 11’, with two 4’ travelways and one 3’ buffer.
2) Rolled curbs, vertical curb and gutters, concrete sidewalks, decomposed granite walkways, or other treatments are all allowed for these facilities.
C. Performance Monitoring
It is important for the City to track trends over time in order to understand how the circulation system is performing. Table C-2 displays proposed circulation system factors that the City should monitor on a regular basis, or as resources allow, in order to understand progress toward achieving a balanced and healthy circulation system.
Table C-2
Circulation Monitoring Program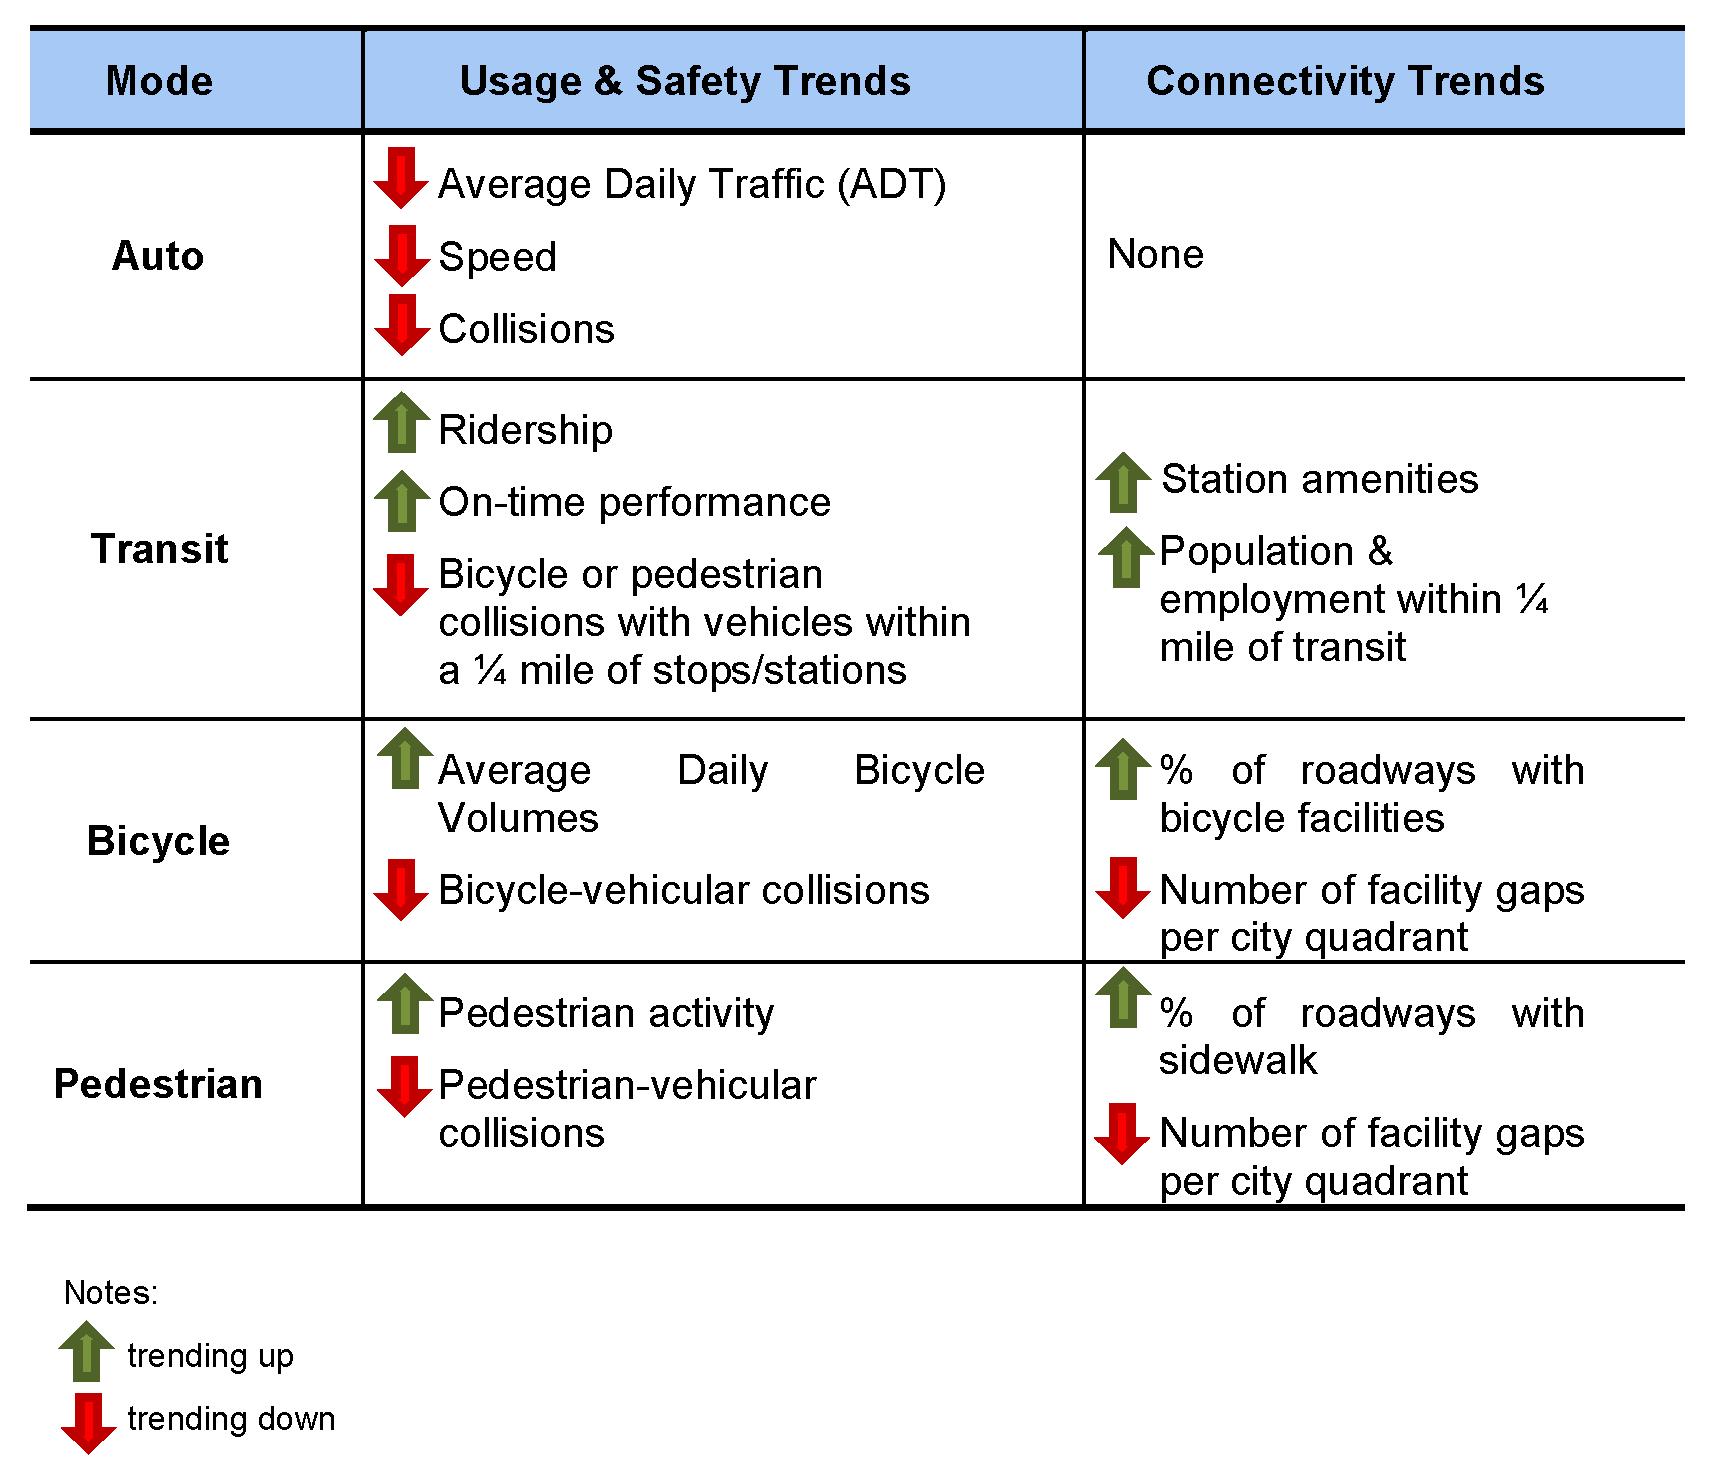
Factors associated with usage, safety and connectivity are proposed for each mode. These factors provide a broader understanding of circulation system performance than LOS. As shown in Table C-2, usage associated with automobile travel should trend downward. Usage for transit, bicycle and pedestrian should trend upward. Collision incidents should trend down for all modes over time, while connectivity measures should trend upward. A performance monitoring program will be outlined in detail in the Solana Beach Comprehensive Active Transportation Strategy which will serve as an implementation tool for the current Circulation Element, defining specific locations, durations, scheduling and costs associated with data collection necessary to support the performance monitoring program.
D. Relationship to Land Use
Physical modifications to the circulation system alone are not enough to increase multi-modal travel within the community. Although streets that incorporate pedestrian and bicycle facilities and traffic calming devices can help facilitate more walking and bicycling, increased use of such facilities is closely associated with shorter travel distances and site design. Therefore, such changes to the multi-modal network must be considered in conjunction with land use patterns and the character of land development.
Land development patterns have a significant influence over travel behavior. For example, the relative mix of land uses in a given area affects the distances between trip origins and destinations. The separation of uses into segregated zones for residential, commercial, and office/professional uses increases travel distances between trip origins and destinations and; therefore, inhibits non-motorized travel. On the other hand, mixed residential, commercial, and office zones reduce the distance between trip origins and destinations and make non-motorized travel a more viable option.
Site design also impacts travel patterns in much the same way as street design. Building design, orientation, setbacks, and other aesthetic considerations create environments that are either attractive or unattractive for non-motorized travel. For example, bland building exteriors, large building setbacks, and significant distances between buildings dedicated to expansive parking lots result in uninviting, uninteresting auto-oriented developments. Pedestrian, bicycle, and transit-oriented focused developments are generally designed so that housing, jobs, commercial, civic, and recreational uses are within easy walking distance of each other. Such developments encourage pedestrian and bicycle use by creating interesting spaces that are defined by such features as small scale buildings oriented towards the street, wide sidewalks, trees and other landscaping, functional street furniture, lighting, and public art. High speed vehicular traffic is discouraged in favor of a safer environment for pedestrians, bicyclists, and transit riders.
Pedestrian, bicycle, and transit-oriented development is permitted within the land use designations identified in the Land Use Element. Because of the built-out nature of Solana Beach, additional mixed-use and more intensive infill development is anticipated to occur through redevelopment or reuse of currently developed parcels. As additional development occurs and Solana Beach evolves, it is critical to develop and maintain multi-modal facilities within the roadway network, as well as provide opportunities for multi-modal trips through appropriate land development and site design.
Santa Fe Irrigation District. (June 2011). 2010 Urban Water Management Plan. Retrieved December 11, 2012 from
http://www.sfidwater.org.
Santa Fe Irrigation District. (June 2011). 2010 Urban Water Management Plan. Retrieved December 11, 2012 from
http://www.sfidwater.org.
Santa Fe Irrigation District. Capital Improvement Project Fact Sheet. Retrieved December 11, 2012 from http://www.sfidwater.org.
Santa Fe Irrigation District. Capital Improvement Project Fact Sheet. Retrieved December 11, 2012 from http://www.sfidwater.org.
City of Solana Beach (2000). Sanitary Sewer Master Plan.
Project Clean Water. San Diego Watersheds. Retrieved December 12, 2012 from
http://www.projectcleanwater.org/html/watersheds.html.
CalRecycle. Solid Waste Information System (SWIS). Retrieved December 12, 2012 from http://www.calrecycle.ca.gov.
California Gas and Electric Utilities (2012). 2012 California Gas Report. Retrieved December 10, 2012 from
http://www.socalgas.com/regulatory/cgr.shtml.
California Gas and Electric Utilities (2012). 2012 California Gas Report. Retrieved December 10, 2012 from
http://www.socalgas.com/regulatory/cgr.shtml.
California Energy Commission. (2012). California Energy Demand 2012-2022 Final Forecast Volume 2: Electricity Demand by Utility Planning Area. Retrieved December 13, 2012 from
http://www.energy.ca.gov/2012publications/CEC-200-2012-001/CEC-200-2012-001-CMF-V2.pdf.
California Energy Commission. (2012). California Energy Demand 2012-2022 Final Forecast Volume 2: Electricity Demand by Utility Planning Area. Retrieved December 13, 2012 from
http://www.energy.ca.gov/2012publications/CEC-200-2012-001/CEC-200-2012-001-CMF-V2.pdf.
California Public Utilities Commission. (2007). California Renewables Portfolio Standard. Retrieved December 13, 2012 from
http://www.cpuc.ca.gov/PUC/energy/Renewables/index.htm.