


A. About Kirkland
Historical Perspective
The original inhabitants of the eastern shore of Lake Washington were the Duwamish Indians. Native Americans, called Tahb-tah-byook, lived in as many as seven permanent longhouses between Yarrow Bay and Juanita Bay and at a village near Juanita Creek. Lake Washington and its environment provided a bounty of fish, mammals, waterfowl and plants. Small pox, brought by fur traders in the 1830s, eliminated much of the Native American civilization. However, survivors and their descendants continued to return to Lake Washington until 1916 when the lake was lowered for building the Ship Canal which destroyed many of their food sources. The salmon spawning beds in the marshes dried out and the mammal population, dependent on salmon for food, died off. With most of their food sources gone, the Native American population in Kirkland declined dramatically.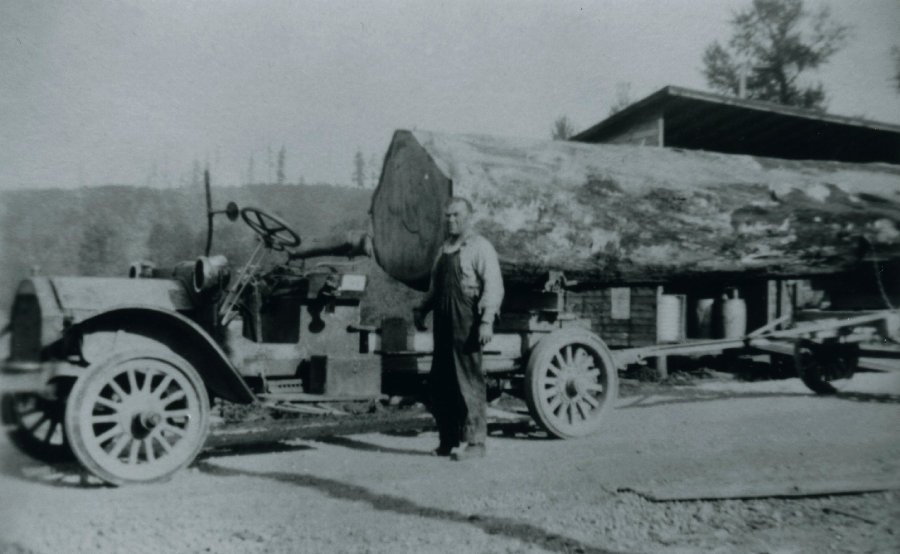
Harry Langdon in Juanita with logging truck about 1920
Source: Kirkland Heritage Society
The first Euro-American settlers in what is now Kirkland arrived at Pleasant (Yarrow) Bay and Juanita Bay in the late 1860s. By the early 1880s, additional homesteaders had settled on the shore of Lake Washington between these two bays. Inland growth was slow because the land beyond the shoreline was densely forested and few decent roads for overland travel existed. By 1888 the population along the shoreline between Houghton and Juanita Bay was approximately 200. The settlement at Pleasant Bay was renamed Houghton in 1880 in honor of Mr. and Mrs. William Houghton of Boston, who donated a bell to the community’s first church.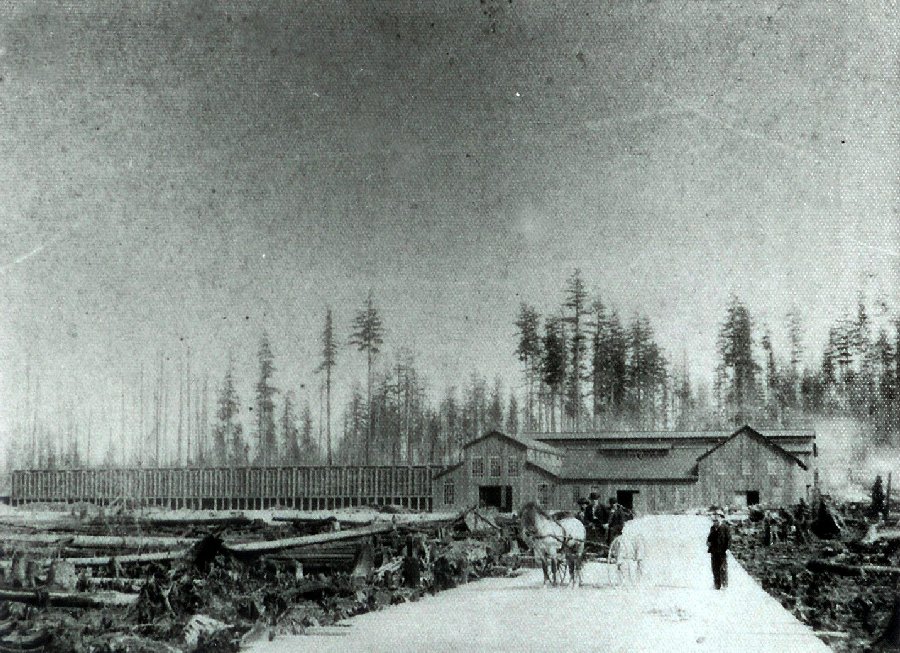
North Rose Hill steel mill 1890, Source: Kirkland Heritage Society
Early homesteaders relied on farming, logging, boating/shipping, hunting, and fishing for survival. Logging mills were established at both Houghton and Juanita Bay as early as 1875. The promise of industrialization for Kirkland came in 1888 with the discovery of iron ore deposits near Snoqualmie Pass and the arrival of Peter Kirk, an English steel industrialist. Kirkland was slated to become the center of a steel industry – the “Pittsburgh of the West.” Platting of the Kirkland townsite, planning and construction of the steel mill near Forbes Lake on Rose Hill, and development of a business and residential community proceeded through the year 1893. The financial panic of 1893 put an end to Kirk’s industrialist dreams before the steel mill could open. Kirkland became a virtual ghost town, and a subsistence economy again arose as the lifeblood of the remaining inhabitants.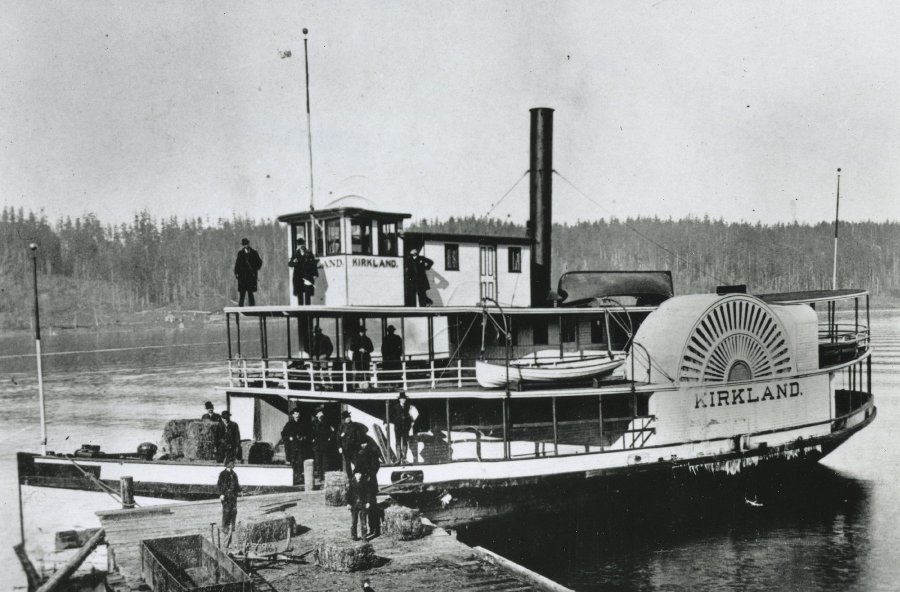
Ferry in Juanita about 1890, Source: Kirkland Heritage Society
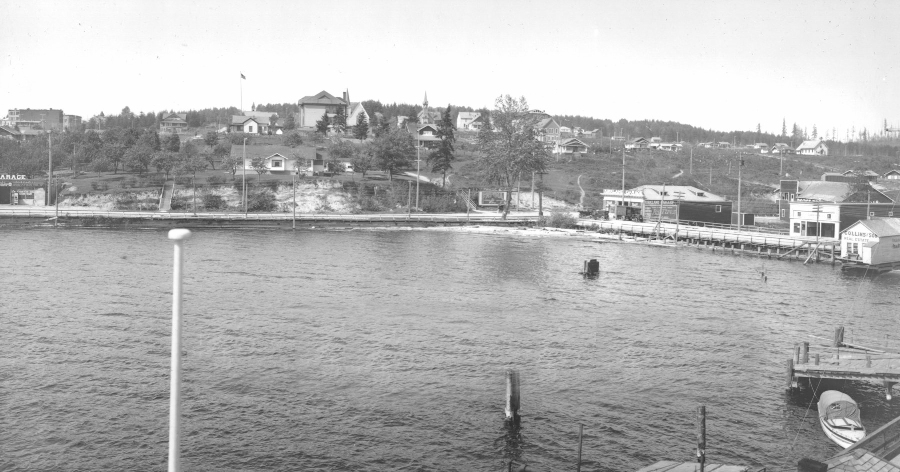
1914 Waterfront, Marina Park in middle, before Lake Washington Ship Canal. Source: Kirkland Heritage Society
Along with Seattle and the Puget Sound region, Kirkland began to grow and prosper, at the time of the Klondike gold rush. In 1910, Burke and Farrar, Inc., Seattle real estate dealers, acquired many of the vacant tracts that had been platted in the 1890s. They created new subdivisions and aggressively promoted the Kirkland ferry service running between Seattle and Kirkland. The population grew from 392 people at incorporation in 1905 to 532 by 1910 and to 1,354 by 1920. Logging and farming remained the primary occupations in Kirkland, but the town was also becoming a bedroom community for workers who commuted by ferry to Seattle.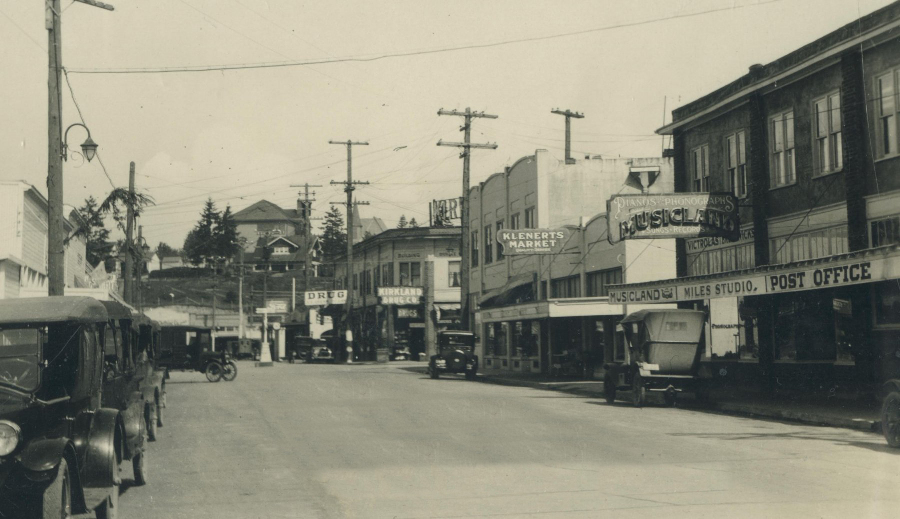
1926 Central Business District, looking north on Lake Street, Hectors on the right, Source: Kirkland Heritage Society
The Klondike gold rush was also a boon for Houghton. The Alaska-Yukon Exposition of 1909, held in Seattle, prompted the Anderson Steamboat Company, located at the future site of the Lake Washington Shipyards, to build several ships to ferry passengers to the Exposition. Employment at the Steamboat Company increased from 30 to 100 men. World War I and the construction of the Lake Washington Ship Canal brought further expansion of the shipyard and employment increased to 400. By the outbreak of World War II, the Anderson Steamboat Company had become the Lake Washington Shipyards. After the attack on Pearl Harbor, defense contracts allowed the shipyard to quadruple in size and employment exceeded 8,000. The Kirkland-Houghton area became an industrial metropolis virtually overnight. By 1944, an estimated 13,000 to 14,000 people were served by the Kirkland Post Office.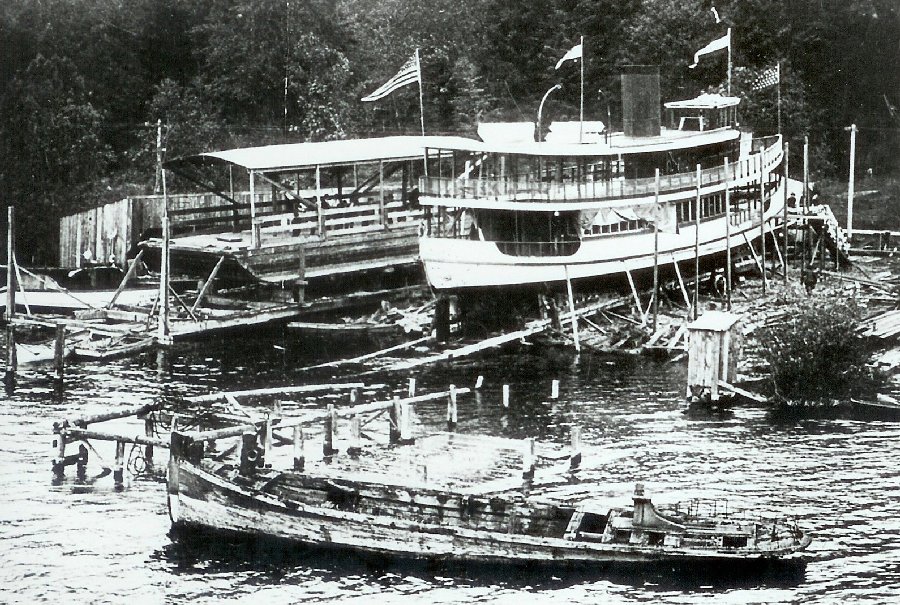
Lake Washington Shipyard 1908
Source: Kirkland Heritage Society
The rapid growth associated with the war effort came at a cost. By the end of the war, many residents felt the loss of a sense of small town community and stability. In addition, serious environmental concerns surrounded the growth of the shipyards and the population. An inadequate septic system threatened water supplies and lake beaches, while an oil spill at the shipyards in 1946 fouled the beaches and killed wildlife along the eastern shore of Lake Washington. The shipyards closed at the end of 1946 and, to avoid future industrialization of their waterfront, Houghton moved to incorporate in 1947 and zoned the waterfront for residential uses.
Following World War II, the automobile and better roads opened up the Eastside to development. Improvements in regional transportation linkages have had the greatest impact on Kirkland’s growth since the demise of Peter Kirk’s steel-mill dream, when Kirkland was considered “the townsite waiting for a town.” Access to Kirkland, which began with the ferry system across Lake Washington, was improved later with the completion of the Lacey V. Murrow floating bridge in 1940, the opening of the State Route 520 bridge across Lake Washington in 1963, and the construction of Interstate 405 in the 1960s. Kirkland continued to grow as a bedroom community as subdivision development spread rapidly east of Lake Washington. Commercial development also grew following the war, providing retail services to the new suburban communities.
Acquisition of Kirkland’s renowned waterfront park system started many years ago with the vision and determination of community leaders and City officials. Waverly Park and Kiwanis Park were Kirkland’s first waterfront parks dating back to the 1920s. A portion of Marina Park was given to the City in 1937 and then the remaining parkland was purchased from King County in 1939. Houghton Beach was deeded to the City of Houghton from King County in 1954, and came into the City as part of the 1968 Houghton incorporation. It was expanded in 1966 and again in 1971. In the early 1970s, Marsh Park was donated by Louis Marsh, and Dave Brink Park was purchased; and subsequent land purchases expanded both parks. The Juanita Golf Course was purchased in 1976 and redeveloped as Juanita Bay Park with further park expansion in 1984. Yarrow Bay Park Wetlands were dedicated to the City as part of the Yarrow Village development project. The latest waterfront park to come under City ownership is Juanita Beach Park, which was transferred to the City from King County in 2002. With the 2012 park levy, the City took over maintenance of O.O. Denny Park while the City of Seattle still retains ownership of the park.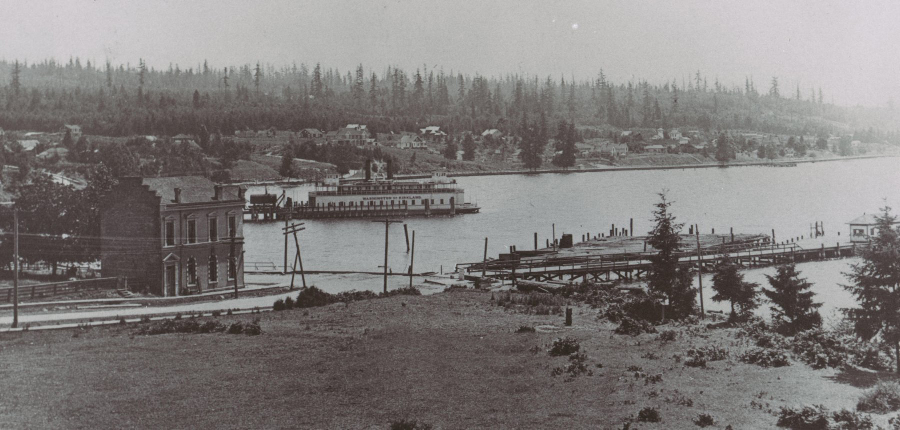
Heritage Park view, 1908, Source: Kirkland Heritage Society
In 1968, just over 20 years after its initial incorporation, the town of Houghton consolidated with the town of Kirkland. The 1970 population of the new City of Kirkland was 15,070. Since that time, the City has continued to grow in geographic size and population. For example, the 1989 annexations of Rose Hill and Juanita added just over four square miles of land and 16,000 people to the City. In 2011, another large annexation occurred with Finn Hill, North Juanita, and Kingsgate adding more than 30,000 residents. See Figure I-1 for Kirkland’s history of annexations.
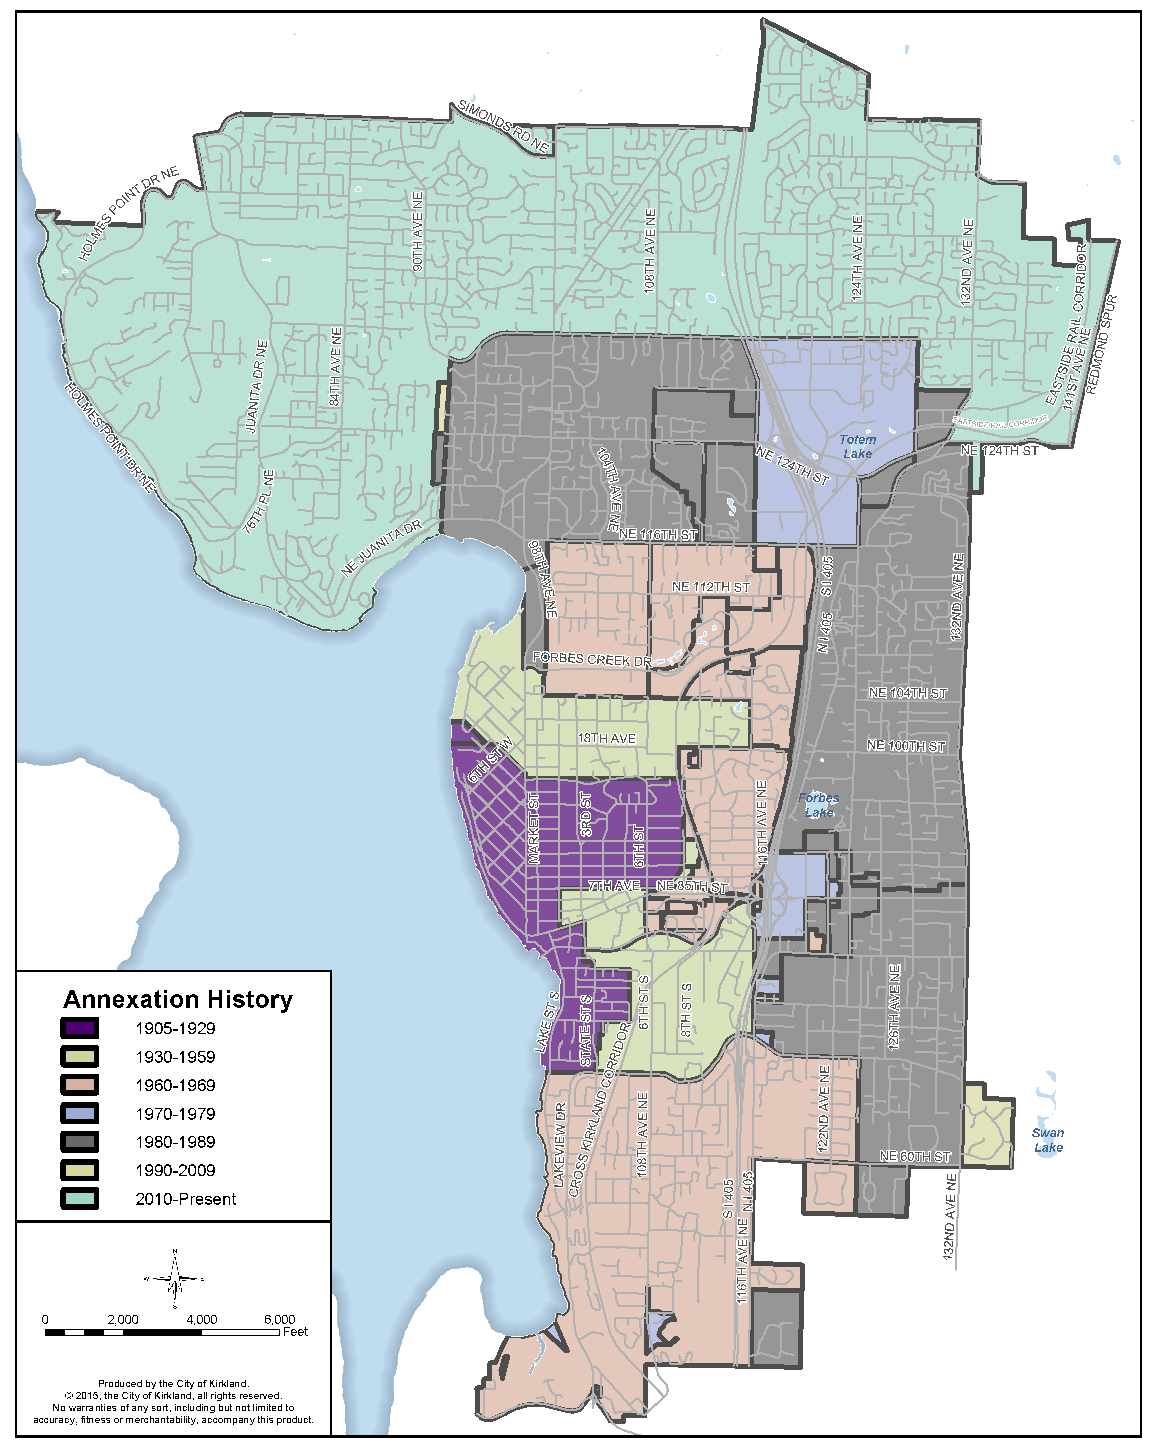
Figure I-1: City of Kirkland Historical Annexation Areas
Between 1980 and 2004, major retail, office and mixed-use developments were built in many areas of the City, including Park Place, Yarrow Bay Office Park, Kirkland 405-Corporate Center, Juanita Village, and Carillon Point, constructed on the former site of the Lake Washington Shipyards. City Hall moved from Central Way and 3rd to its current location at 1st and 5th Avenue to provide expanded services in response to years of growth. Downtown Kirkland intensified with mid-rise buildings around the perimeter. Housing, art galleries, restaurants and specialty shops joined existing office and basic retail uses. The Downtown civic hub came alive with the addition of a library, senior center, teen center and performing art theatre bordering on Peter Kirk Park. Many new multifamily complexes were built near the commercial centers and along arterial streets while redevelopment of single-family neighborhoods resulted in traditional subdivisions and innovative developments offering a variety of housing choices. Evergreen Health Care was expanded, giving Kirkland a strong array of medical services. Lake Washington Technical College and Northwest University also expanded, giving Kirkland a strong educational presence. Lake Washington School District remodeled or reconstructed most of its schools. The City also made major investments in capital facilities for roads, bike lanes and sidewalk construction, sewer improvements and park purchases. This was also a period of time when neighborhood associations, business organizations and community groups were established to work on issues of interest and to form partnerships for improving the quality of life in Kirkland.
Since 2004, the Downtown has continued to redevelop with mid-rise mix use buildings. Former industrial areas are being replaced with high technology campuses. The range of housing choices continue to expand, including small lot subdivisions and micro units. The South Kirkland Park and Ride facility has been converted into a transit oriented development with housing for a mix of incomes. In 2012, the City purchased a 5.75-mile segment of the 42-mile Eastside Rail Corridor from the Port of Seattle. At the end of 2015, construction of an interim trail was completed for walking and biking. Kirkland envisions the trail as a major spine connection to schools, parks, businesses and neighborhoods, and a multimodal transportation corridor.
Kirkland has grown beyond a bedroom community, becoming a commercial and employment center in its own right. See Figure I-2 for a map of Kirkland and surrounding area. Kirkland today has come a long way from Peter Kirk’s vision as the center of the steel industry and the “Pittsburgh of the West.”
Portions condensed from: Harvey, David W. Historic Context Statement and Historic Survey: City of Kirkland, Washington. Unpublished manuscript, March 1992, on file, Kirkland Department of Planning and Community Development.
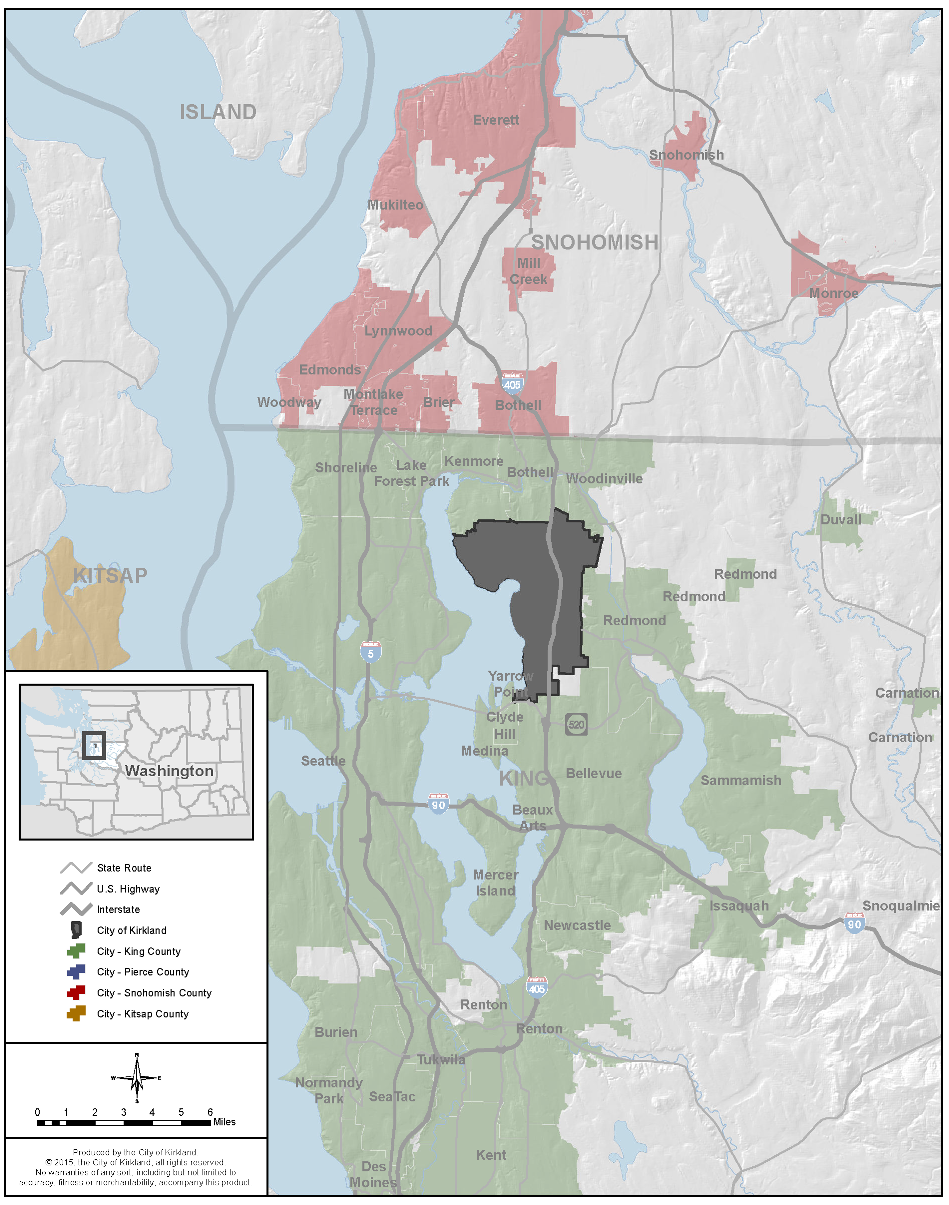
Figure I-2: Kirkland and Surrounding Area
Community Profile
An update to the community profile was completed in 2014 and includes relevant Kirkland data about demographics, housing, economics, land use and capacity. This data was compiled from a variety of sources, including the U.S. Census Bureau, Washington State Office of Financial Management, Puget Sound Regional Council, ARCH (A Regional Coalition for Housing), King County and the City of Kirkland Finance Department.
KIRKLAND AT A GLANCE
Kirkland is a city in the Puget Sound region of western Washington. The City is located in Seattle’s greater suburban area known as the Eastside, on the shores of Lake Washington. See Figure I-2. In 2014, at nearly 83,000 population, Kirkland is the sixth largest municipality in King County and the thirteenth largest in the state. Kirkland has long been a regional commerce center as well as a popular destination for recreation, entertainment and the arts. Over the past 11 years since the last Comprehensive Plan update, the City has grown and changed with the annexation of Finn Hill, North Juanita and Kingsgate, high technology companies laying roots and the Downtown continuing to redevelop as an urban village. Quick facts provided below represent a “snapshot” of Kirkland in 2014:
|
CITY |
|
|
• |
Incorporated: 1905 |
|
• |
Area: 17.81 square miles |
|
• |
Population: 82,590 (April 2014 estimate, Washington State Office of Financial Management) |
|
• |
Rank: thirteenth largest municipality in Washington State; sixth largest in King County (2013) |
|
• |
Miles of streets, highways: approximately 300 miles (includes private streets and some driveways) |
|
• |
Elevation range: ~15' to ~535' above sea level |
|
• |
Real property parcels: approximately 24,300 |
|
• |
Neighborhoods: 15, represented by 13 neighborhood associations |
|
• |
City government: City Council/City Manager; 554 permanent staff (December 2014) |
|
DEMOGRAPHICS |
|
|
• |
Minority population: 10,095 (2010); 21% of total population |
|
• |
Median age: 36.6 (2012) |
|
• |
Junior and senior population: 9,155 younger than age 18; 5,299 65 and older (2010) |
|
• |
Households: 22,445 total; 12,014 family, 10,431 non-family (2010) |
|
• |
Average household size: 2.15 (2010) |
|
• |
Median household income: $86,656 (2012 est.) |
|
• |
Households below poverty level: 1,306; 5.85% of total (2011) |
|
HOUSING |
|
|
• |
Housing units: 36,866 (2013 est.) |
|
• |
Housing unit growth: 107% increase from 1990 to 2014 |
|
• |
Housing unit types: 21,176 single-family, 16,188 multifamily (2014) |
|
• |
Median rent: $1,370 (2012) |
|
• |
Rental vacancy rate: 3.9% (2012 est.) |
|
• |
Median home price: $464,200 (2012 est.) |
|
• |
Owner versus rental: owner-occupied 12,897; renter-occupied 9,429 (2012 est.) |
|
• |
Rental expenditure: 37% of renters spend more than 30% of income |
|
• |
Mortgage expenditure: 42% of owners spend more than 30% of income |
|
• |
Households in poverty: 520 family households and 786 other households (2012) |
|
ECONOMY |
|
|
• |
Property assessed valuation: $4.9 billion (2000); $11 billion (2010); $13.9 billion (2013) |
|
• |
Largest employer: Evergreen Healthcare; 3,762 employees (2014) |
|
• |
Total employment: 30,124 (2012 est.) |
|
• |
Kirkland residents who work in Kirkland: 6,108 (2012 est.) |
|
• |
Number of business licenses: 4,688 (July, 2014) |
|
• |
Home business licenses: 1,972 (July, 2014) |
|
• |
City government revenues: $108.6 million (2013) |
|
• |
Sales tax generated: $16.6 million (2013) |
|
• |
City permit valuation: $151.4 million (2011) |
|
• |
Future employment forecasts: 59,309 jobs (2025); 65,893 jobs (2030) (PSRC) |
|
LAND USE AND FUTURE GROWTH CAPACITY |
|
|
• |
Single-family housing zoning: 53% of City (2014) |
|
• |
Multifamily housing zoning: 8% of City (2014) |
|
• |
Commercial mix use/office/industrial/institutional zoning: 10% (2013) |
|
• |
Parks/open space: 8% of City (2013) |
|
• |
Right-of-way: 20% of City (2013) |
|
• |
Residential density (range by neighborhood): Moss Bay Neighborhood at 25 units/acre followed by Totem Lake at 17 units/acre (highest); Finn Hill at 4 units/acre followed by Bridle Trails Neighborhood (equestrian area) at 2.6 units/acre (lowest) |
|
• |
Housing unit growth capacity: 10,000 additional; 2,900 in Totem Lake Neighborhood (2035) |
|
• |
Employment growth capacity: 23,000 additional; 7,300 in Totem Lake Neighborhood (2035) |
Source: Community Profile
Population
With an estimated 2014 population of 82,590, Kirkland grew by over 30,000 people in 2011 with the annexation of Finn Hill, North Juanita and Kingsgate. Although future annexations are unlikely, Kirkland will continue to have a steady increase primarily due to new redevelopment of existing structures. By the year 2030, Kirkland’s population is expected to grow by more than 10,000 to approximately 92,800.
Table I-1 below shows how Kirkland’s population has grown over time and what the projected population is expected to be over the next 20 years.
|
Year |
Population |
Population Increase |
Land Area Increase |
|---|---|---|---|
|
1910 |
532 |
||
|
1930 |
1,714 |
27% |
2% |
|
1950 |
4,713 |
130% |
112% |
|
19701 |
15,070 |
150% |
170% |
|
19902 |
40,052 |
113% |
67% |
|
2010 |
48,787 |
8.3% |
0% |
|
20143 |
82,590 |
69.3% |
64.9% |
|
2025 |
89,000 |
7.7% |
0% |
|
20354 |
95,000 |
0.6% |
0% |
1 Includes consolidation with the City of Houghton in 1968 which included 1.91 square miles.
2 Includes annexations of Rose Hill and Juanita in 1988. Source: Office of Financial Management.
3 Includes annexations of Bridleview (2009), Finn Hill, North Juanita, and Kingsgate (2011). Washington Office of Financial Management.
4 PSRC 2014.
Kirkland’s median age has increased from 36.1 in 2000 to 36.6 in 2012. At the same time, however, the percentage of the population under 18 years old has also increased from 18.2 percent in 2000 to 18.8 percent in 2010 and the percentage of the population 65 and older has also increased from 10.1 percent to 10.9 percent. The largest age cohort in both 2000 and 2010 was the 25 – 44 cohort. See Figure I-3 for Kirkland’s Age Group Composition 2000 – 2010.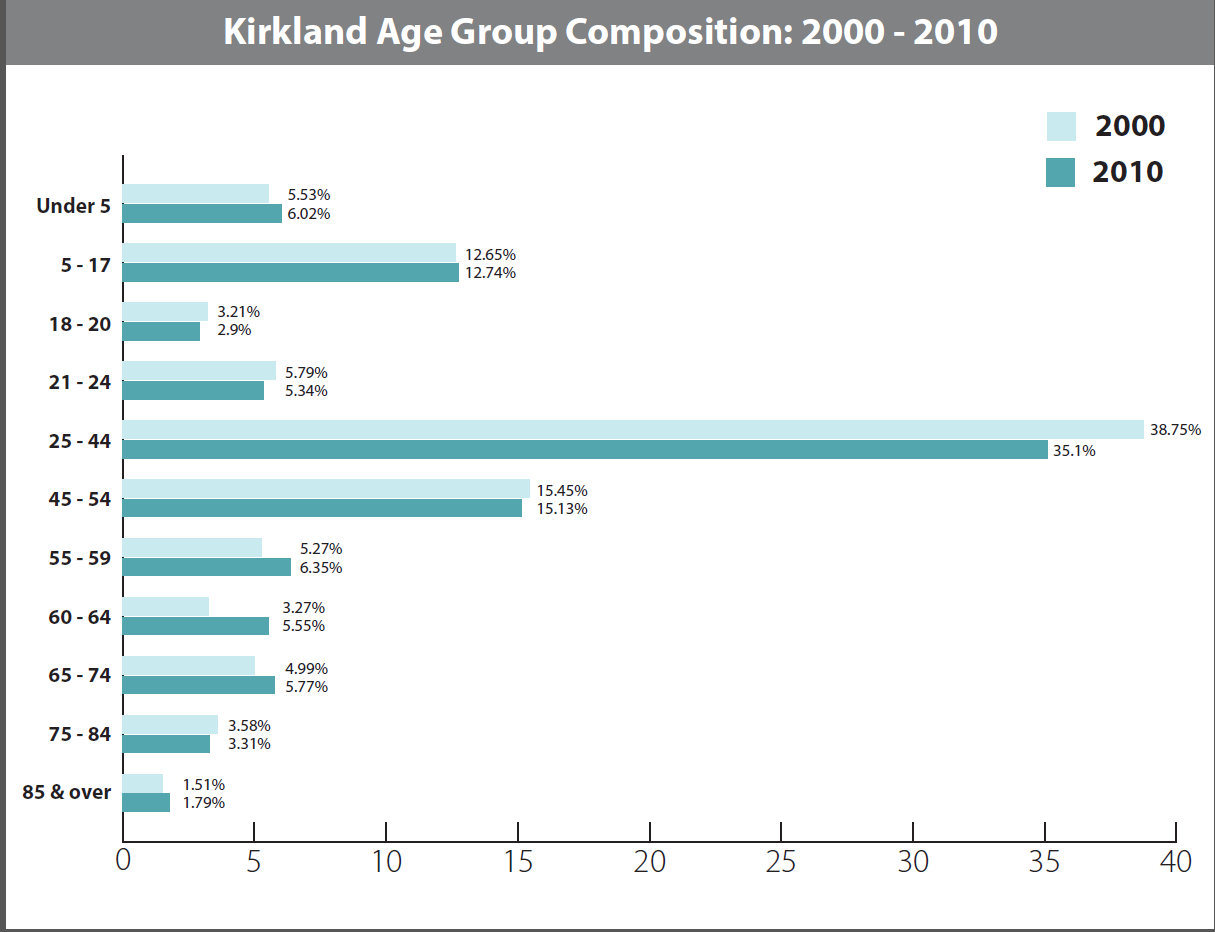
Figure I-3: Kirkland Age Group Composition
Source: State Office of Financial Management
Household Income
Median household income and poverty status are two measures that indicate economic well-being. As indicated in Figure I-4 below, Kirkland’s median household income in 2012 was $86,656, which is 21.7 percent higher than King County’s median of $71,175. In 2010, 31 percent of the City’s households were considered low- to moderate-income (80 percent or less of the County median income) which has remained the same over the past 10 years. Poverty is still present within the City – the 2010 Census reported that 5.85 percent of all individuals in Kirkland fell below federal poverty thresholds. This is an increase over the past 10 years as compared to 9.92 percent for King County as a whole.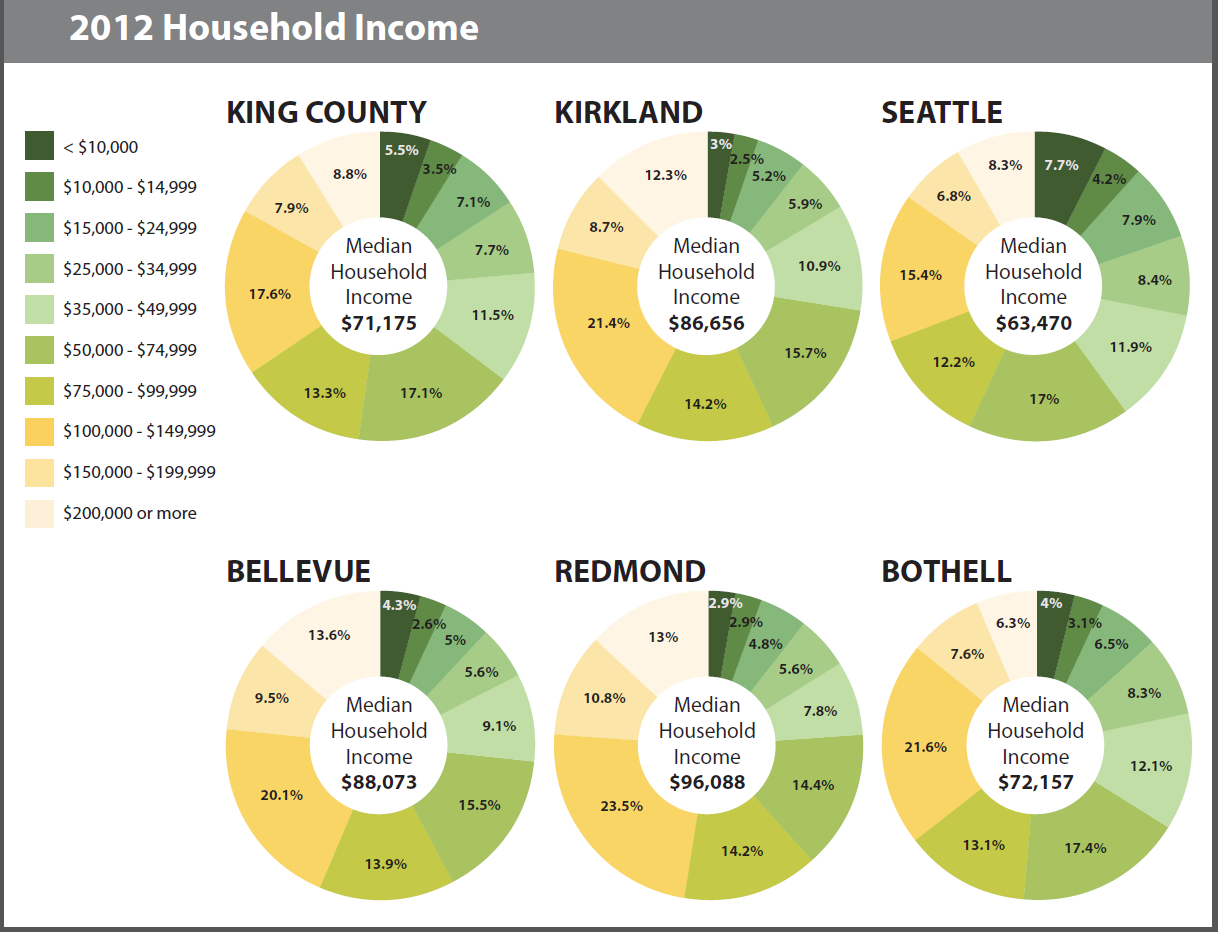
Figure I-4: 2012 Household Income
Source: U.S. Census Bureau
Housing
Changes in the population characteristics have implications for the average household size. In past decades, Kirkland and other jurisdictions throughout King County have experienced a decrease in the average household size. However, more recently in Kirkland, the average household size stayed about the same with 2.14 persons per household in 2000, increasing slightly to 2.15 persons per household in 2010. However, with the 2011 annexation average household size increased due to the addition of single-family homes. Nonetheless, Kirkland has the second lowest household size for renter occupied behind Seattle and the lowest household size for owner occupied. See Figure I-5 for Average Household Size (Rent vs. Own) for 2012.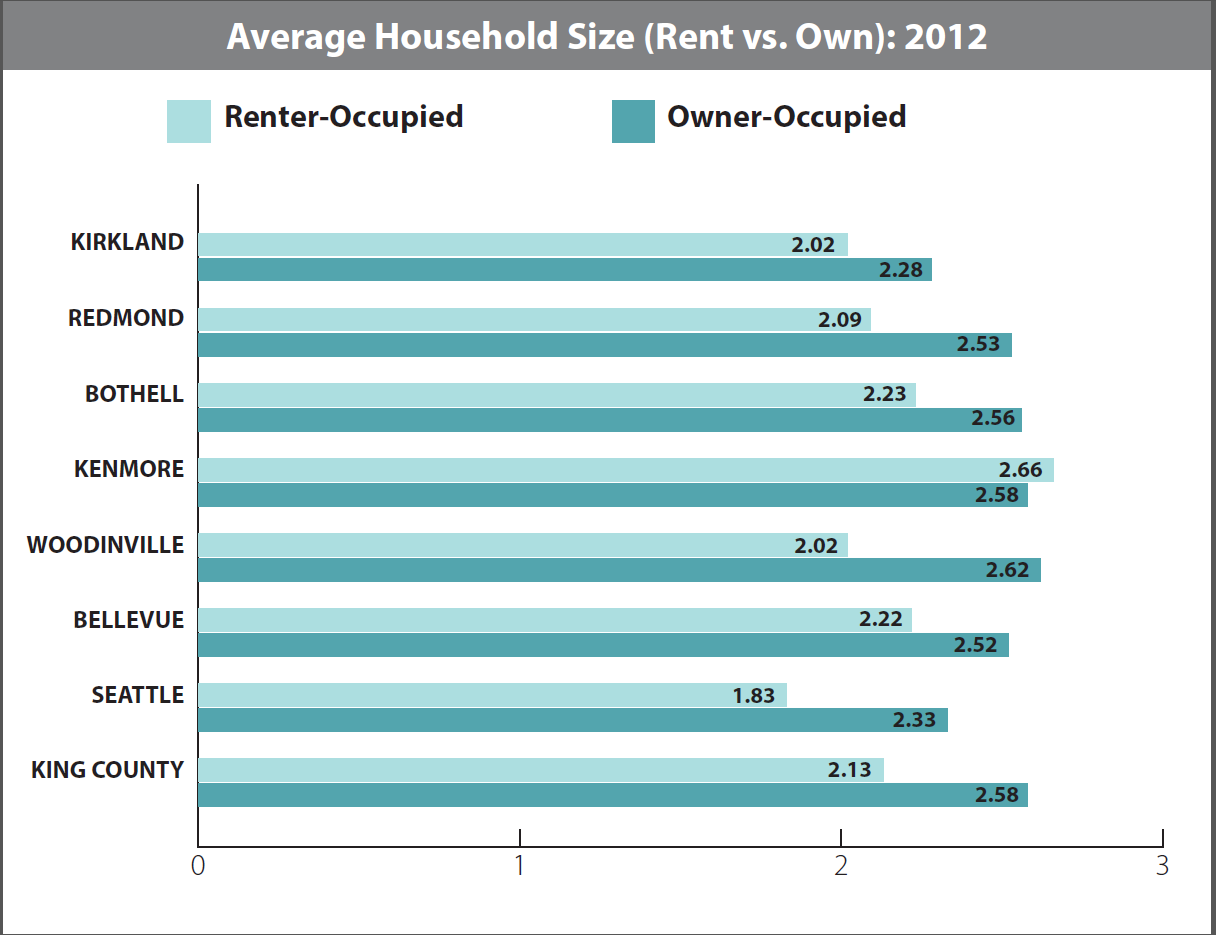
Figure I-5: 2012 Average Household Size (Rent vs. Own)
Source: State Office of Financial Management
King County also has seen little change in household size over the same period. The national trend is a declining household size due to people living longer, fewer children born, a rise in single-parent households, and an increase in the number of single-occupant households. Given that trend, Kirkland may also see a decline of persons per household over the next 20 years. If so, population growth in the future would result in more housing units per capita and different types of housing to accommodate changing needs.
Due to the 2011 annexation, the City’s housing stock grew from 21,939 units in 2000 to 37,450 units in 2012 – a 71 percent increase. Reflective of the substantial housing increase due to annexation, the population nearly doubled between 2000 and 2014 largely due to annexation. The 2011 annexation also altered the balance of housing unit types. In 2000, there were 50.47 percent single-family units and 49.28 percent multifamily units. By 2010, the ratio was 48.83 percent single-family units to 50.95 percent multifamily units with more multifamily housing. By 2011 with annexation, the balance tipped back to single-family housing with 56.54 percent single-family units and 43.23 percent of multifamily units. See Figure I-6 for the change in single-family and multifamily housing type in Kirkland between 2000 – 2014.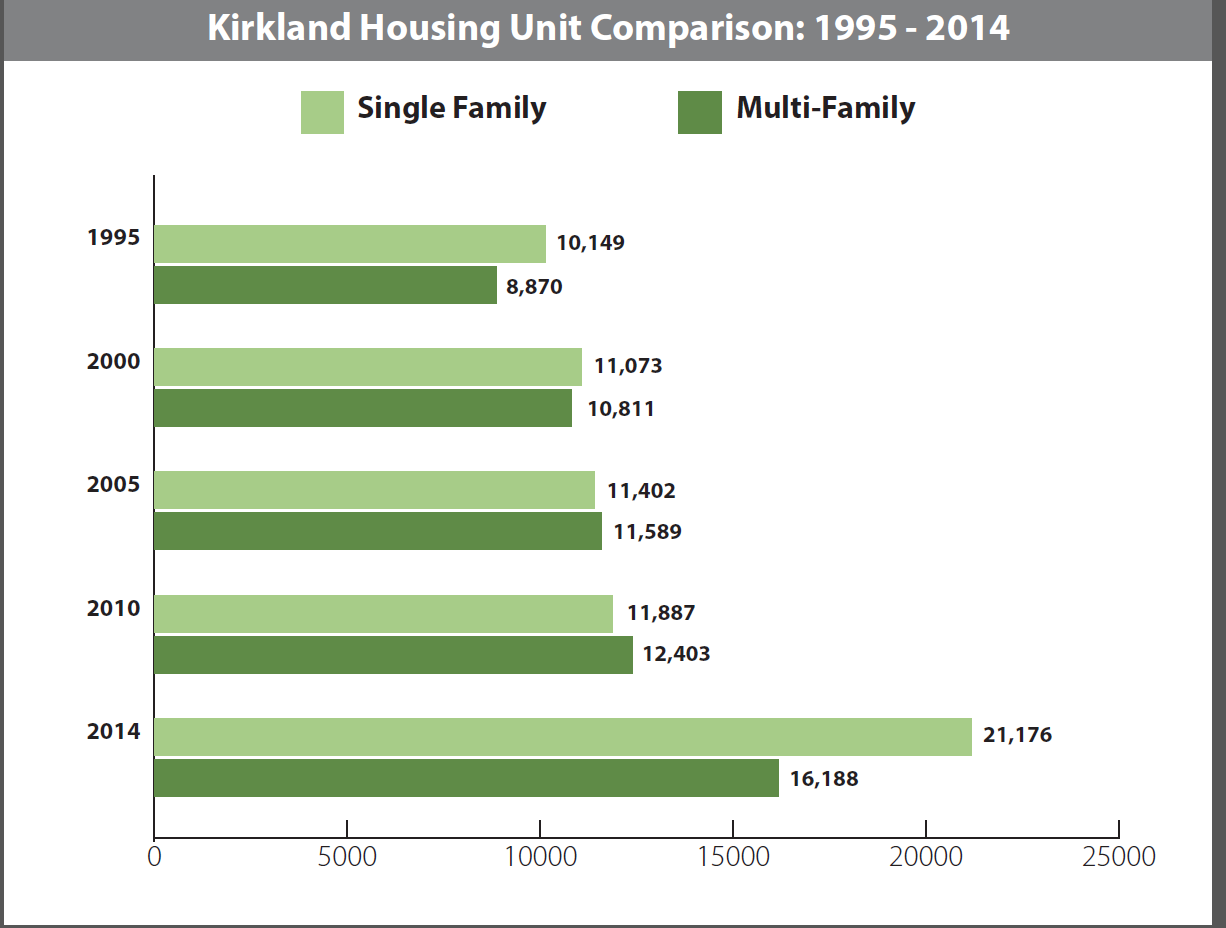
Figure I-6: 2000 – 2014 Kirkland Housing Unit Comparison
Source: State Office of Financial Management
Figure I-7 below compares Kirkland owner-occupied and renter-occupied housing units with King County and other Eastside cities for 2010. In both cases, Kirkland falls within the median range. Only Kirkland did not see a change in the percent of owner-occupied and rental-occupied units between 2000 and 2010. 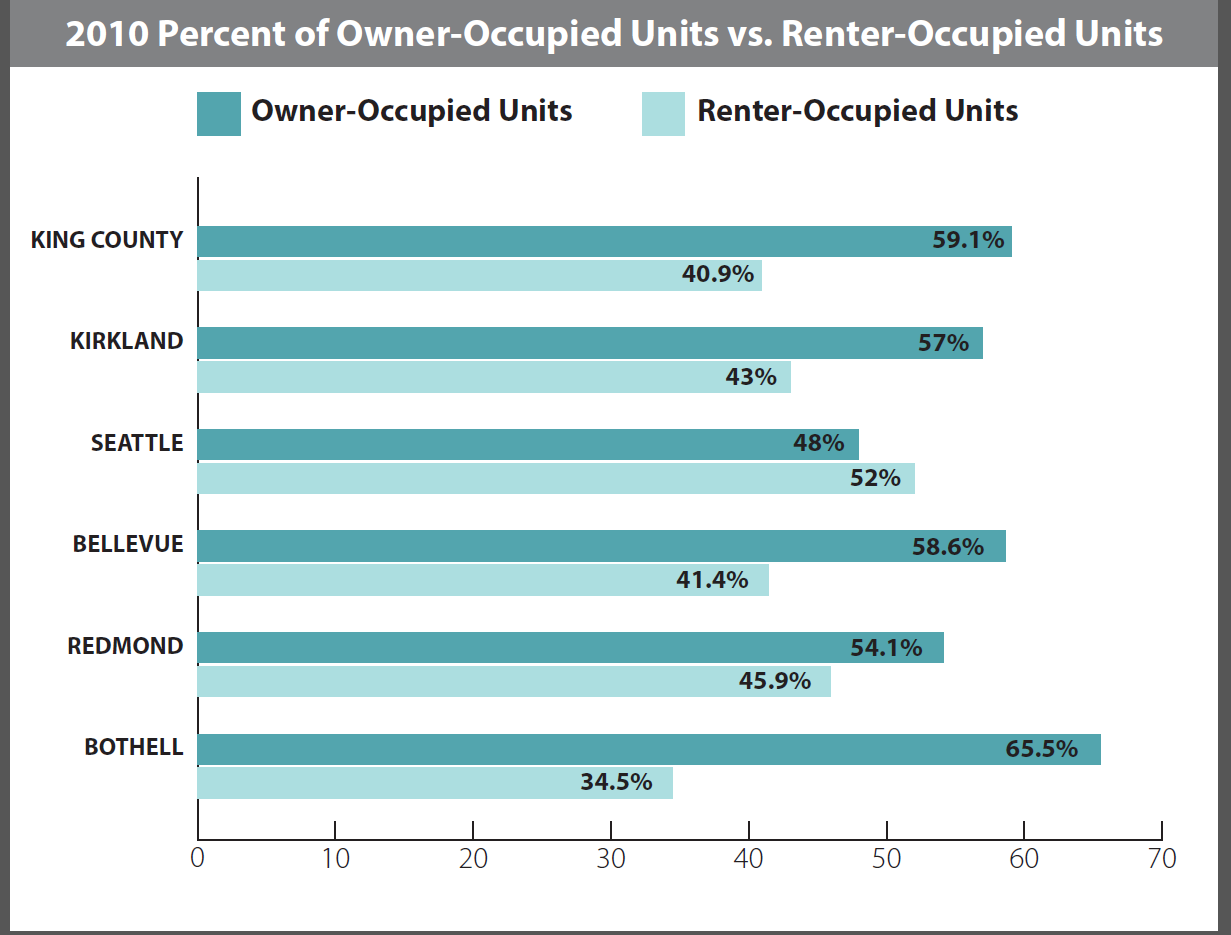
Figure I-7: 2010 Owner-Occupied vs. Renter-Occupied
Source: U.S. Census Bureau
Employment
Kirkland provided approximately 30,942 jobs in 2010 based on the U.S. Census.
In Figure I-8 below, total jobs in 2010 are listed by sector for Kirkland. The highest percentage of all jobs are in the finance, insurance, real estate and services sector (56.5 percent).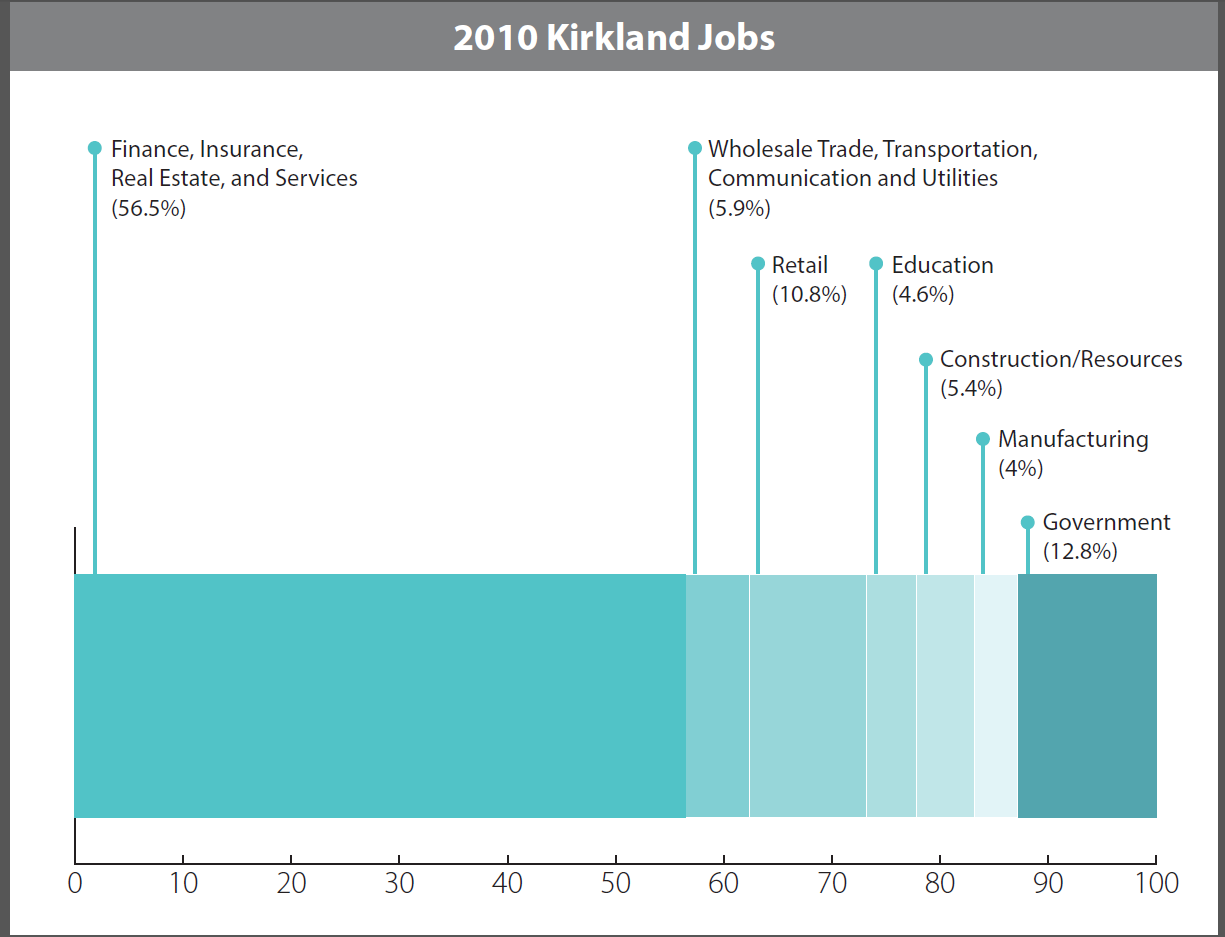
Figure I-8: 2010 Kirkland Jobs
Source: City of Kirkland and PSRC estimates
The 2010 Census reported that 28,140 (69.8 percent) of Kirkland’s residents 16 years and over are employed. This is slightly higher than the 65.6 percent employment of the King County population. Overall, this represents a decline in the number of residents in the workforce that may reflect an increase in young children and/or retired people.
In Kirkland, the jobs to housing ratio is 79 percent (30,124 jobs ÷ 23,932 housing units) compared with 77 percent (1,099,630 jobs ÷ 851,180 housing units) in King County. One of A Regional Collation for Housing’s (ARCH) goals for East King County is to have a close job to housing ratio in order to have a sufficient housing supply that can help to reduce housing costs and commute times.
As of 2014, the largest employers in Kirkland represent a wide range of businesses, including Evergreen Healthcare Center, Google, Inc., City of Kirkland, Kenworth Truck Co., Astronics Advanced Electronics Systems, Costco Wholesale, and Evergreen Pharmaceutical LLC. Health care and high technology is the current trend for major employers in Kirkland.
As described in Figure I-9 below, in 2012, Kirkland ranked first out of the five local cities whose residents worked outside the City with 79.7 percent of its total workforce traveling to other cities to work. Not surprisingly, Seattle, at 67.4 percent, has the greatest proportion of its residents working within its City limits. Workforce includes those 16 years and older.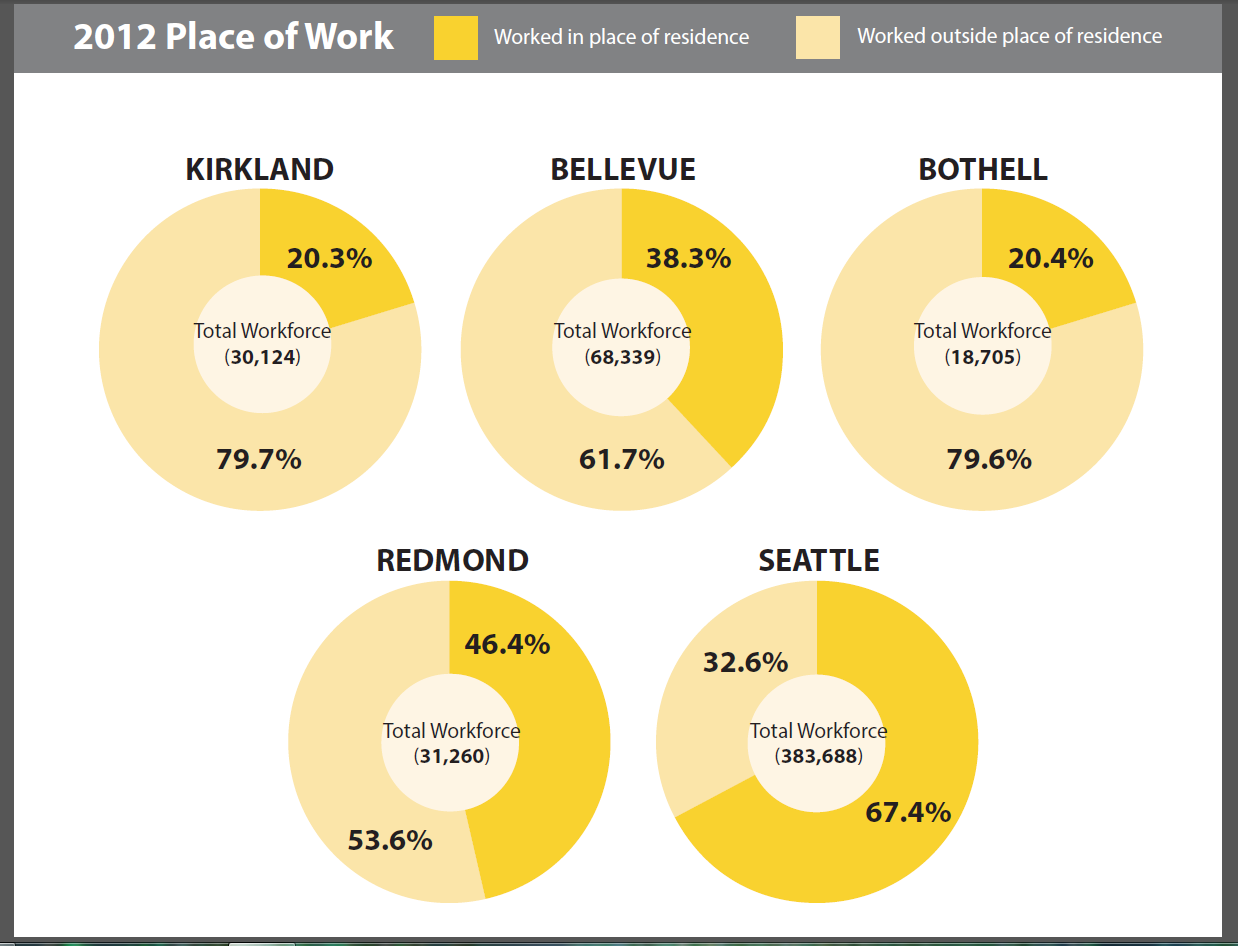
Figure I-9: 2012 Place of Work
Source: U.S. Census Bureau
Existing Land Use
There are approximately 11,400.7 gross acres or almost 18 square miles of land in Kirkland. This represents a 62.8 percent increase since 2000 due to the 2011 annexation. The developable land use base, which excludes all existing public rights-of-way, totals 9,124 net acres of land in Kirkland. The City maintains an inventory of the land use base which classifies the land according to the uses and the zones that occur on the various parcels.
Figure I-10 below describes the type of land uses in Kirkland. Fifty-four percent of the land contains existing residential uses. The Finn Hill neighborhood has the highest percentage of single-family land in acres while the Totem Lake neighborhood has the fewest acres. South Juanita has the highest percentage of multifamily land in acres while the Market neighborhood has the fewest acres. Not surprisingly, the Totem Lake neighborhood has the greatest commercial and office land in acres.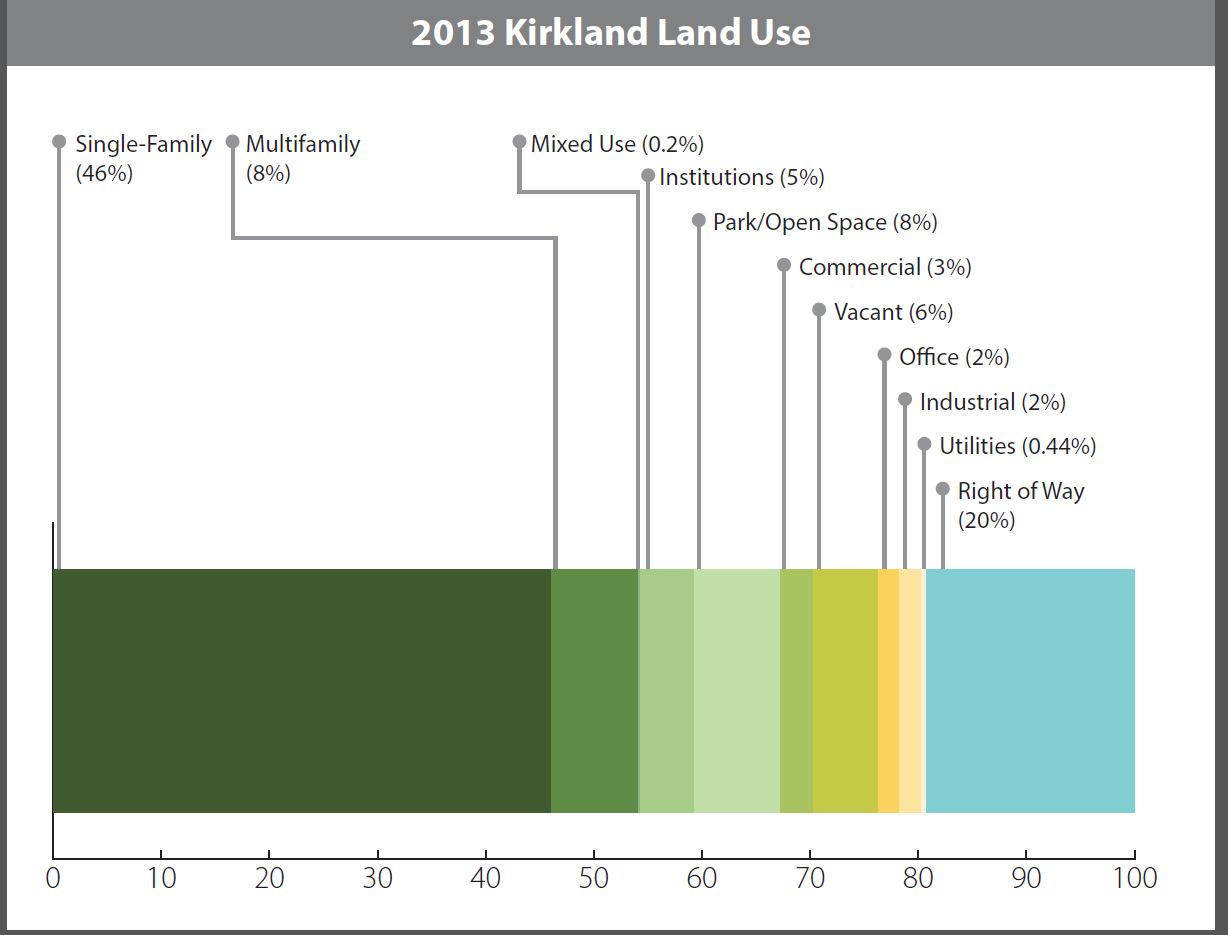
Figure I-10: 2013 Kirkland Land Use
Source: City of Kirkland – Land Use Inventory
Twelve percent of the developable land use base is developed with nonresidential uses. As of 2013, Kirkland has approximately 13,478,712 square feet of existing floor area dedicated to nonresidential uses. Of that developed total, 5,689,271 (42 percent) are office uses, 4,241,082 (31 percent) are commercial uses, and 3,548,359 (26 percent) are industrial uses. The Totem Lake neighborhood has the greatest percent of commercial and industrial uses in square footage and the Lakeview Neighborhood has the greatest percent of office uses in square footage.