


C. Land Use Map and Definitions
The Comprehensive Land Use Map (Figure LU-1) indicates where certain types of uses may be appropriate.
The Comprehensive Land Use Map identifies areas for a range of housing densities and a variety of nonresidential uses. The map contains land use designations reflecting the predominant use allowed in each area. These designations are reflected in a broad variety of zoning districts on the Kirkland Zoning Map. Within some of these land use designations are mixed-use developments. Changes to the Land Use Map and related zoning may be initiated by the City Council based on Council decisions or based on ideas presented by the Planning Commission, City staff, a neighborhood planning process, or citizen requests.
The land use categories mapped on the Comprehensive Land Use Map are defined in the Glossary (Appendix).
Table LU-2 below provides a range of residential densities described in the Comprehensive Plan with comparable zoning classifications. In many of Kirkland’s commercial and mixed use areas, the Comprehensive Plan does not specify a maximum residential density.
|
General Residential Densities |
Residential Densities as Specified in Comprehensive Plan in Dwelling Units per Net Acre (d/a) |
Comparable Zoning Classification |
|---|---|---|
|
GREENBELT/URBAN SEPARATOR |
Up to 1 d/a |
RSA – 1 |
|
LOW DENSITY |
Up to 1 d/a |
RS – 35,000, RSX – 35,000 |
|
Up to 3 d/a |
RS – 12,500, RSX – 12,500 |
|
|
4 – 5 d/a |
RS – 8,500, RSX – 8,500, RSA – 4 |
|
|
6 d/a |
RS – 7,200, RSX – 7,200, RSA – 6 |
|
|
7 d/a |
RS – 6,300 |
|
|
8 – 9 d/a |
RS – 5,000, RSX – 5,000, RSA – 8 |
|
|
MEDIUM DENSITY |
8 – 9 d/a |
RM – 5,000, RMA – 5,000 |
|
10 – 14 d/a |
RM – 3,600, RMA – 3,600 |
|
|
HIGH DENSITY |
15 – 18 d/a |
RM – 2,400, RMA – 2,400, BNA |
|
19 – 24 d/a |
RM – 1,800, RMA – 1,800, BNA |
|
|
48 d/a |
BN, MSC 2 |
|
|
More than 48 d/a |
HENC 2 |
Higher unit per acre counts may occur within each classification if developed under the City’s PUD, innovative or affordable housing programs.
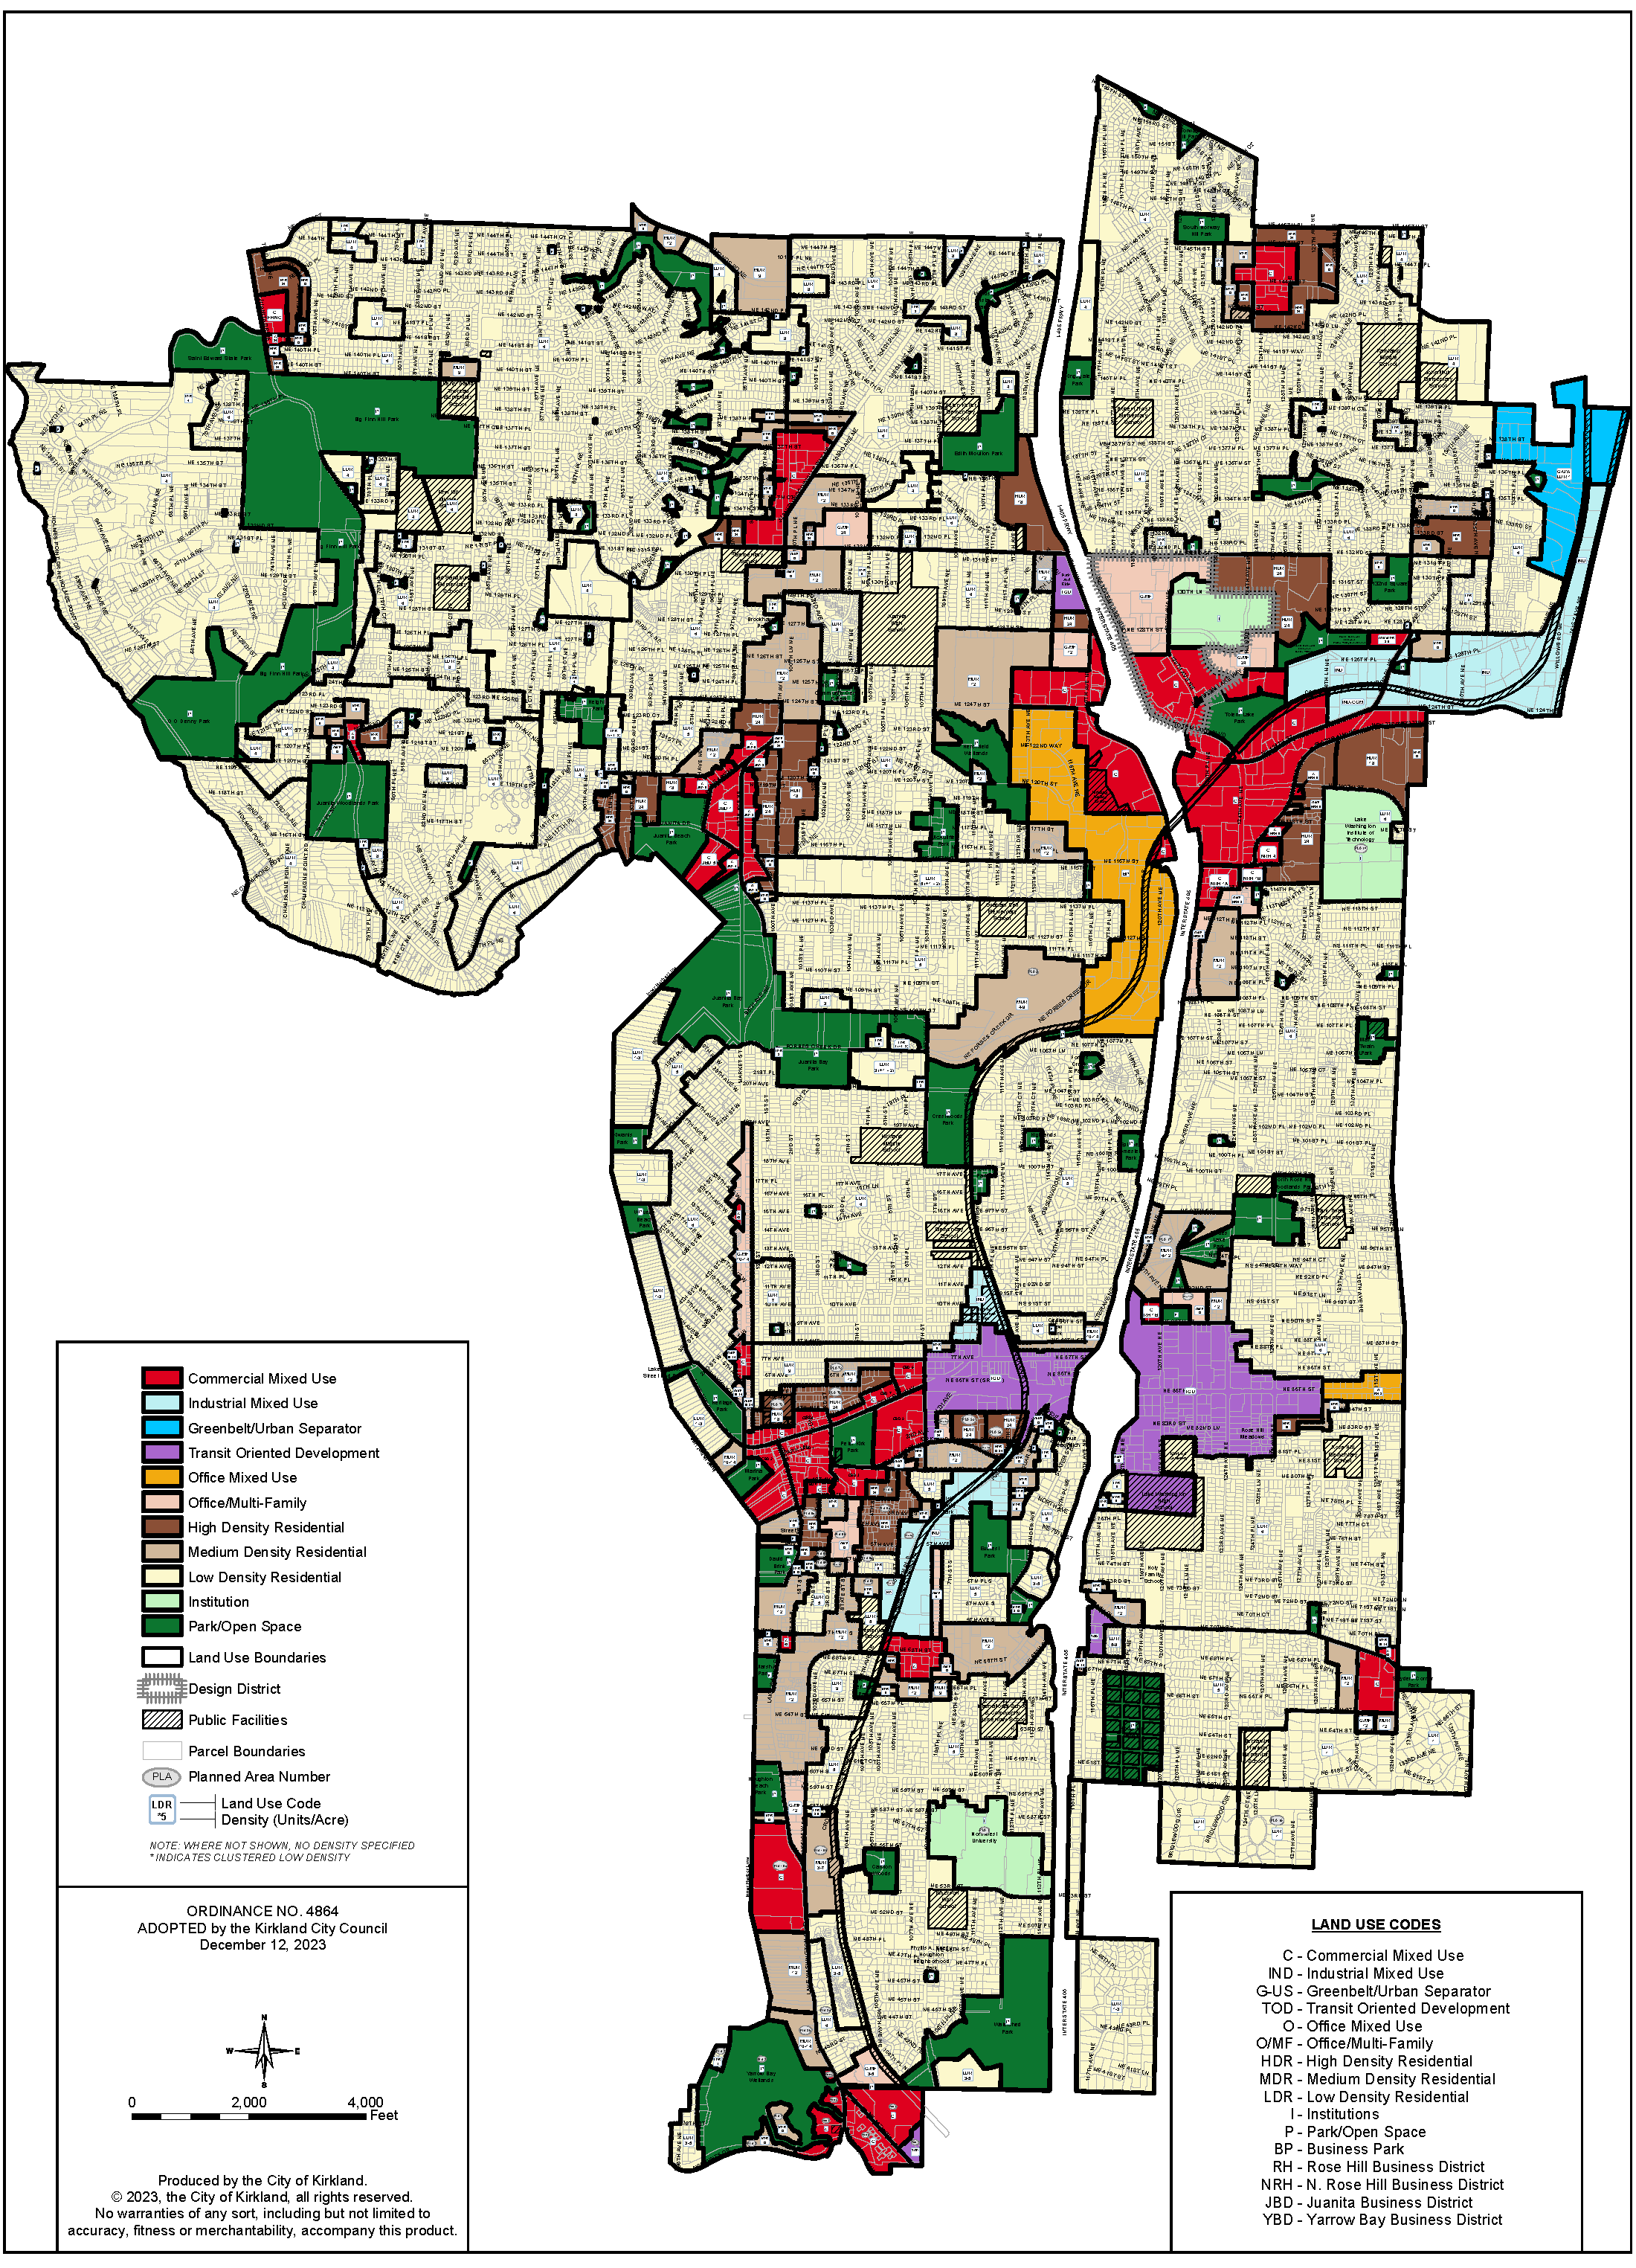
Figure LU-1: Comprehensive Land Use Map