


CHAPTER 1 – System Overview
This chapter gives an overview of Olympia’s water system, including ownership and management, customers, history, service area environment and land use, boundaries, neighboring purveyors and related policies. It also generally describes the system infrastructure: supply, storage and transmission/distribution.
Olympia is located in Thurston County, at the southern tip of Puget Sound. It is approximately 65 miles south of Seattle, 105 miles north of Portland, and 45 miles east of Aberdeen. As the state capitol as well as the county seat, its economic activity is fueled to a great extent by government activity. The adjacent cities of Lacey and Tumwater contribute to the metropolitan nature of the area.
1.1 Ownership and Management
The City of Olympia owns and operates a public water supply system that serves customers within its Water Service Area. Key facts about the Utility are shown in Table 1.1. The City does not own or manage more than one public water system and therefore is not a satellite management agency.
|
Water system name |
City of Olympia |
|
Water system identification number |
634506 |
|
Water system classification |
Group A – Community Type |
|
Type of ownership |
Local government |
|
System contact person |
Mike Vessey, Pump Stations Supervisor |
|
Service area population (2013) |
60,710 |
|
Number of metered service connections (Sept 2014) |
19,699 |
|
Capacity of distribution storage tanks |
30.88 million gallons |
|
Supply sources |
McAllister Wellfield and six supply wells |
Management and Staffing
Olympia’s public utilities are managed within the Public Works Department, which is organized into five lines of business (Water Resources, Waste Resources, Transportation, Engineering and General Services). The three water-related utilities (Drinking Water, Wastewater, and Storm and Surface Water) are managed under the leadership of the Water Resources Director.
The Drinking Water Utility encompasses Engineering and Planning, Drinking Water Operations, Pump Stations Operations and Drinking Water Quality. The Utility is supported by Public Works Engineering, Facilities and Fleet services. The Utility develops its own annual operating budget and capital facilities program.
The Utility has a total of approximately 29 FTE staff, as shown in Table 1.2.
|
Drinking Water Utility Section |
Number of Full-time Employees (FTE) |
Associated Chapter |
|---|---|---|
|
Drinking Water Operations |
||
|
Drinking Water |
16.5 FTE |
|
|
Pump Stations |
3.75 FTE |
|
|
Drinking Water Quality |
||
|
Water Quality |
3.0 FTE |
|
|
Water Conservation |
1.75 FTE |
|
|
Reclaimed Water |
0.5 FTE |
|
|
Groundwater Protection |
0.5 FTE |
|
|
Engineering and Planning |
||
|
Engineering |
1.5 FTE |
Chapters 8, 9, 10, 13 |
|
Planning |
1.0 FTE |
Chapters 1, 2, 4, 14 |
|
Administrative Support |
0.6 FTE |
N/A |
|
Total |
29.1 FTE |
|
Customers
Olympia provides retail water service within the incorporated City limits and its Urban Growth Area (UGA), with a few exceptions noted below in Section 1.3, and wholesale water to the City of Lacey and Thurston PUD No. 1.
As of 2014, the Utility had 19,699 metered customers within its service area, which includes the incorporated City limits and its Urban Growth Area (Map 1.1). The Utility provides potable water to residential, commercial and industrial customers, and reclaimed water to a few customers in downtown Olympia. See Chapter 3 for details.
Providing high quality service to customers is a priority for the Drinking Water Utility.
Customers have access to the information they need, have a role in accomplishing Utility goals, and participate in Utility decision making.
Customer service is a recurring theme in this Water System Plan. In particular, the Utility uses the objectives and strategies below to implement Goal 4.
Objective 4.A Engage with drinking water customers regularly.
Strategy 4A.1 Utilize Olympia’s Utility Advisory Committee to develop and review drinking water policies, projects, programs and rates.
Strategy 4A.2 Provide useful information to customers through the Utility bill insert that accompanies each water bill.
Strategy 4A.3 Maintain the drinking water utility’s web pages with current information that is easy to find and understand.
Objective 4.B Coordinate customer service and education with the City’s other water resource utilities and LOTT.
Strategy 4B.1 Cooperate with the Wastewater Management Utility, Storm and Surface Water Utility and LOTT in educational/promotional activities.
Levels of Service
Municipal utilities in the United States and elsewhere commonly use Level of Service (LOS) standards to evaluate whether the physical system and operations are functioning to an adequate level. LOS can be defined in terms of the customer’s experience of utility service and/or technical standards based on professional expertise of utility staff.
The Utility complies with all regulatory standards for water quality and system design and operation. In addition to these minimum standards, the LOS standards address issues of concern for customers that influence decisions on infrastructure investments.
LOS standards can help guide investments in maintenance, repair and replacement. For new assets, LOS can be used to establish design criteria and prioritize needs. Using a structured decision process that incorporates LOS can help a utility achieve desired service outcomes while minimizing life-cycle costs.
The Utility has refined its LOS standards using the following criteria:
• Specific goal or expectation identified.
• Focused on customer and community.
• Quantifiable and measurable.
• Relatively simple to understand and apply.
• Constrained by available budgets for maintenance, repair and replacement.
The Utility’s LOS standards are in these areas:
• System performance (including service interruption due to breakage, pressure and system reliability).
• Sustainability (energy efficiency).
• Customer service (response to water quality and service-related complaints).
1.2 History
Historical accounts of water service to Smithville, as Olympia was originally known, are vague. The earliest accounts describe a combined creek and groundwater source emanating from the Moxlie Creek watershed. In 1941, when peak system demands began to exceed the supply capacity in this watershed, the City purchased the McAllister Springs property at the headwaters of McAllister Creek.
McAllister Springs and Creek have great cultural and historical significance to the Nisqually Indian Tribe. The Springs are within the aboriginal territory of the Nisqually, a Salish-speaking group that lived in villages along the banks of the Nisqually River and its tributaries, including McAllister Creek. McAllister Creek was also known as Medicine Creek, in reference to its spiritual importance for the Nisqually, and was the place where the 1854 Treaty of Medicine Creek was signed.
The City developed the Springs in 1945, and constructed the pump house and pipeline in 1946 and 1947. In 1949, Olympia began pumping water from McAllister Springs, which provided the majority of Olympia’s water supply for the next 65 years. In 1995, due to concerns over the vulnerability of McAllister Springs and costly water quality treatment requirements, the City formally requested a transfer of its water rights from McAllister Springs (and nearby Abbott Springs) to the McAllister Wellfield.
In 1998, the City purchased a 20-acre site (hereafter McAllister Wellfield), along with the development rights for an additional 100 acres adjacent to the Wellfield. The agreement relating to development rights carries certain restrictions on the use of the land. To provide access, the City also purchased a 66-acre parcel of property south of the Wellfield property.
In 2008, the City entered into a Memorandum of Agreement with the Nisqually Indian Tribe to replace McAllister Springs with an up-gradient wellfield to avoid the need for ultra-violet treatment at the Springs, reduce the risk of contamination from transportation spills, and eliminate the potential effects of saltwater intrusion due to sea level rise.
In support of the water right application, the City subsequently conducted an extensive study on groundwater pumping, worked with regional partners on mitigation strategies across two watersheds, and reached two groundbreaking agreements with neighboring Tribes. Nearly 17 years later, in early January 2012, the Department of Ecology (Ecology) issued water rights for the McAllister Wellfield, marking a historic moment for the City and the Nisqually Tribe.
The Wellfield began operations in November 2014 and is now the City’s primary source of water supply, supplemented seasonally by six additional wells. (See also Chapter 4 and Chapter 8 for development of McAllister Wellfield and details on other sources.)
1.3 Service Area
This section gives an overview of the natural environment, particularly climate and impacts of climate change; land use; and system information including boundaries, neighboring purveyors, interties and service area agreements.
Environment and Land Use
The following sections describe the climate and land use of the service area. Chapter 7 describes the topography, geology and groundwater conditions, as well as land use and zoning, of the designated Drinking Water Protection Areas (DWPAs) around supply sources.
Climate
Due to its elevation and location on Puget Sound, Olympia’s climate is characterized by warm, dry summers and cool, wet winters.
Winter weather in Olympia is temperate, wet and generally overcast. Summer weather is moderate and comparatively dry. The average annual range in temperature is relatively narrow, from an average low of 39 degrees Fahrenheit (F) to an average high of 60 degrees F.
During the wet season, generally from October to May, storms usually arrive from the southwest and continue toward the Olympic Peninsula. An occasional Arctic storm from the northwest brings freezing temperatures, hail or sleet, freezing rain or snow.
The coast range and Olympic Mountains protect the area from strong Pacific storms during the fall and winter. An average annual rainfall of about 51 inches in the Olympia area can be attributed to the onshore effects of maritime disturbances originating in the Pacific Ocean.
Climate Change Trends
The warming climate is projected to cause changes in weather patterns. In general, Ecology expects western Washington to experience milder, wetter winters and hotter, drier summers. The water system will potentially be affected by changing levels of precipitation and rising sea level in Puget Sound. For details, see Ecology’s climate change website.
The University of Washington Climate Impacts Group (CIG) has measured observed effects of global climate change in the Pacific Northwest and Puget Sound, and projected potential future trends. The CIG’s findings as of 2013 are summarized below, as cited in Climate Change Impacts and Adaptation in Washington State: Technical Summaries for Decision Makers (2013) and previous CIG publications.
Rising Temperature. Since 1895, the average annual temperature in the Pacific Northwest has increased 1.3 degrees F. Significant warming has occurred in all seasons except for spring, with the largest changes having occurred during the winter months. The rate of warming is expected to accelerate; the best estimate is a rate of over three times the increase of 0.15 percent per decade observed during the 20th century. Estimates range from increases of 0.7 to 3.2 degrees by the 2020s, 1.4 to 4.6 degrees by the 2040s, and 2.9 to 8.8 degrees by the 2080s. Olympia’s water demand forecast more conservatively assumes temperature changes of 1.8 to 5.4 degrees F above historic levels by 2020 and 2.4 to 7.2 degrees higher by 2040, based on the CIG’s 2002 forecasts for the Portland (OR) Water Bureau.
Precipitation uncertainty. No significant trends toward wetter or drier conditions in Pacific Northwest precipitation have been observed since 1985. This recent finding may contradict previously reported information documenting an increase in precipitation. Natural variability in precipitation is high. Similarly, the evidence of heavier downpours is ambiguous.
Spring snowpack fluctuates widely from year to year, but has declined in the Washington Cascades since the mid-20th century. Glaciers are in decline. Snow melt and associated streamflow timing is occurring earlier in the year for many rivers and streams. These trends can be expected to continue.
Sea level rise. A 1993 City of Olympia report found that sea level is already rising in Olympia by about one foot per century due to post-ice age warming of the oceans and subsidence of the land (City of Olympia, 1993). This rate is expected to increase with rising global temperatures. However, sea level in Washington is also influenced by coastlines both rising and falling due to plate tectonics. Unlike areas to the north, Olympia’s shoreline may be lowering in elevation, thereby exacerbating the impacts of sea level rise.
In a January 2008 report, the University of Washington Climate Impact Group (CIG) recommended that for decisions with long timelines and low risk tolerance, such as coastal development and public infrastructure, policymakers should use low-probability, high-impact estimates of sea level rise.
Overall, although sea level rise scenarios and estimates for Puget Sound vary, most studies anticipate a steady increase in sea levels.
Potential Climate Change Impacts
Direct impacts on the Utility could result from projected increases in summer temperatures and saltwater intrusion from rising sea level.
Increased demand due to rising summer temperatures. Under current climate conditions, water use increases as summer temperatures rise. If summers in Olympia become hotter and drier, demand for water may increase correspondingly. The Utility believed it prudent to anticipate this potential trend in developing its 50-year demand forecast for the 2009–2014 Water System Plan.
Climate change effects are anticipated to occur gradually, allowing time for the community and water system to adapt over periods of years and decades. The Utility’s focus on water conservation should help counteract increases in demand for potable water.
Saltwater intrusion from rising sea level. Prior to development of the McAllister Wellfield, the City’s primary drinking water source at McAllister Springs was at risk of saltwater intrusion from rising sea levels. The City developed the McAllister Wellfield to provide an upgradient water supply and largely mitigate this risk. Currently the Allison Springs supply wells are the City’s only drinking water sources considered at risk of saltwater intrusion. However, despite their proximity to the Puget Sound and screening near sea level, these wells are considered to be at low risk for saltwater intrusion. Utility staff regularly monitors Allison Springs groundwater, looking for changes in conductivity and chloride concentration that may indicate an influence of salt water.
Land Use and Zoning
This section characterizes the current land use and future zoning of the Utility’s service area. See Chapter 7 for land use and zoning in designated DWPAs.
Development of residential and commercial properties in the area has slowed since the 2008 recession. In general, most residential development in Olympia has shifted to large apartment complexes of 100 units or more with densities up to about 20 units per acre. Most single family and commercial development is occurring as “infill” in already developed areas. As a result, most development is occurring on the Westside where large multi-family tracts remain available. Map 1.2 shows current zoning.
The best projection of future land use is in the designations given by Olympia’s Comprehensive Plan, as updated in 2014 (Map 1.3). The Plan is designed to accommodate 20-year projected growth as required by the Growth Management Act. Generally, the City is moving toward infilling areas already characterized by urban development, phasing urban development facilities outward from core areas, and requiring new development to be configured to allow for future infill. The Plan aims to bolster the downtown area as the city center, and create two other high density neighborhoods – one in the vicinity of the Capital Mall and another along Martin Way west of Lilly Road.
Service Area System Information
Within Olympia’s service area, water is available to all new retail customers through main extensions or by connecting to existing mains. As of 2013, the service area population was approximately 60,710, and the Utility had 19,699 metered service connections.
Water service consists of the sale of potable water to residential, commercial, industrial, and institutional customers, as well as the use of water for fire protection. The service area is divided into seven pressure zones. Water demand calculations for each pressure zone, as shown in Chapter 3, take into account population growth and development as well as uncertainties. The infrastructure improvements described in this Plan (Chapters 8-10) will ensure that the City has sufficient capacity to provide safe and reliable water service.
The City also distributes reclaimed water to a few customers in downtown Olympia, within a small reclaimed water service area that is entirely within the water service area (Chapter 6).
This section describes other system information including boundaries, neighboring purveyors, interties and service agreements. Service area policies are in Chapter 2, Section 2.2.
Service Area Boundaries
The public utility service areas for Olympia, Lacey and Tumwater are generally contiguous with the Urban Growth Area boundary.
The service area boundaryestablishes the limits of City water service responsibilities through direct connection. Olympia’s water service area generally includes the incorporated City limits and its Urban Growth Area (UGA), as shown in Map 1.1.
Over the years, the service area has been amended to include these parcels outside the UGA that are served by Olympia:
• The Evergreen State College (1969).
• Small areas around 11th Avenue Northwest and Overhulse Road Northwest in West Olympia.
• A few parcels north of 26th Avenue Northeast.
• Some locations in Lacey and Tumwater where Olympia is serving accounts that were connected prior to adoption of the Coordinated Water System Plan.
• McLane Fire District 9 facility and McLane Elementary School near the intersection of Delphi and Mud Bay Roads (2006).
The most recent extension was the 2006 amendment to the 2004 Water System Plan to support water service to the new McLane Fire District 9. Thurston County signed the required local government consistency statement and the Washington State Department of Health (DOH) approved this amendment in August 2006. The service area was also updated and approved as part of the 2006 Plan update (Appendix 1-1).
In addition, there are 21 direct service connections off the 36-inch main that lies outside Olympia’s service area. These are historic connections, which pre-date the Coordinated Water System Act of 1977. Olympia has discussed with Lacey and Thurston PUD No.1 about moving these connections off the 36-inch main and into their systems as appropriate.
Retail Water Service
Map 1.1 shows the existing/retail and future zones within Olympia’s water service area. The existing/retail zone generally includes areas where the Utility currently provides service, or where service is immediately available. The future zone includes areas within Olympia’s water service area where the City does not yet provide services.
Wholesale Customers
Thurston PUD No. 1 includes the Tanglewilde and Thompson Place subdivisions in the City of Lacey. The City operated and maintained the PUD’s water system from 1964 until June 2005, when the PUD assumed operation and maintenance responsibilities and became a wholesale customer of Olympia’s Water Utility.
Olympia also provides wholesale water service to the City of Lacey to supplement its own sources.
Olympia’s wholesale agreement with the PUD is scheduled to end in early 2015, and the agreement with the City of Lacey by the end of 2016. Thus, by 2017 Olympia will not be supplying wholesale water to either Lacey or the PUD. This planned change is reflected in Olympia’s water demand forecast, Chapter 3, and rate structure analysis, Chapter 14.
Neighboring Purveyors
Olympia’s service area is bordered to the east and south by the water service areas of Lacey and Tumwater. Map 1.1 depicts the service areas. Within the boundaries of Olympia’s service area there are approximately 16 Group A Water Systems with a total of 372 connections and 29 Group B Water Systems, serving 121 connections.
Interties
Olympia sells water wholesale to the City of Lacey through a booster pump station from the 36-inch main located west of Marvin Road, at Pacific Avenue and Mountainaire Road. There are also three other emergency interties with the Lacey system: one on Sleater-Kinney Road Southeast near McDonald’s Restaurant; one on Sleater-Kinney Road Southeast and Pacific Avenue Southeast; and another off Sleater-Kinney Road Northeast and Sixth Avenue Northeast near North Thurston High School.
Olympia has two emergency interties with the City of Tumwater: one at the intersection of Capitol Boulevard and Carlyon Avenue Southeast; the other at the intersection of Mottman Road and Crosby Boulevard Southwest.
One intertie provides wholesale water to Thurston PUD No. 1at Pacific Avenue Southeast and Seahawk Street Southeast.
For details on the emergency interties with Lacey and Tumwater see Chapter 10, Table 10.4 and the Emergency Response Plan (Chapter 12, Section 12.2 and Appendix 12-2). Map 1.4 shows the general location of these interties, which are included in the Water Facilities Inventory Form in Appendix 1-7.
Service Area Agreements
Water service areas in North Thurston County are designated in the WSP 1986 Coordinated Water System Plan (CWSP) and 1996 Area Wide Supplement. The CWSP has not been updated to reflect the 2005 agreement under which the City no longer provides retail service to the Tanglewilde and Thompson Place areas within Thurston PUD No. 1; or the 2006 agreement extending City water service to the McLane Fire District 9 facility (Appendix 1-1). Olympia also has intergovernmental agreements with the Cities of Lacey and Tumwater, Thurston PUD No. 1, and Fort Lewis (now Joint Base Lewis McChord):
• City of Lacey. Under the 2007 Intergovernmental Agreement for Sale of Water (Appendix 1-2), Olympia agrees to sell Lacey up to two million gallons per day during November through June and up to 1 million gallons per day during July through October. Olympia may temporarily interrupt or reduce delivery of water to Lacey in event of emergency or need for maintenance or repair. The original two-year agreement has been extended to expire after 2016, with no further continuation.
• City of Tumwater. Under the 2001 Mutual Aid Agreement Between the Cities of Tumwater and Olympia For the Use of Emergency Water System Interties (Appendix 1-4), each City agrees to provide potable water service to the other for use in firefighting, and for drinking water and personal hygiene. It will be activated only in the event of an emergency proclamation by the city requesting assistance.
• Thurston PUD No. 1. In 2005, Olympia signed a 20-year agreement with Thurston PUD No. 1, Intergovernmental Agreement for Sale of Water, Assignment of Water System Accounts, and Management of Water System. This terminated the 1996 agreement under which Olympia had operated the PUD system. Since then Olympia has continued providing water but the PUD operates its own system. The agreement was amended in 2007, specifying the quantity and price of water to be supplied, and committing the City to provide sufficient water for ultimate build-out of the (PUD’s) service area. In 2014, the City of Olympia and the PUD entered into a new agreement for the sale of water in anticipation of the PUD no longer needing to buy wholesale water from Olympia. This 2014 agreement (Appendix 1-5) supercedes the previous intergovernmental agreements between the PUD and City for sale of water. The PUD and City entered into a mutual aid agreement in 2015 (Appendix 1-3).
• Joint Base Lewis McChord (JBLM, formerly Fort Lewis). Under this 2005 mutual aid agreement, the US Army at JBLM and the City of Olympia agree to assist each other in fire prevention and the protection of life and property from fire and firefighting and other emergencies, including response to hazardous materials spills (Appendix 1-6). The JBLM Fire Department staff is fully trained and equipped to respond to any size of spill. (See Chapter 12, Section 12.2.)
Emergency supply agreements are authorized under Chapter 38.52 RCW, Emergency Management. Sale of water to another municipality is authorized by Chapter 29.34 RCW, RCW 35.92.170 and RCW 35.92.200.
Service Area Policies
Under RCW 43.20.260, municipal water suppliers have a duty to provide service to all new connections within their retail service area when the circumstances meet four threshold factors:
• The supplier has sufficient capacity to serve water in a safe and reliable manner.
• The service request is consistent with adopted local plans and development regulations.
• The supplier has sufficient water rights to provide service.
• The supplier can provide service in a timely and reasonable fashion.
The City of Olympia anticipates having adequate capacity to supply customers in its service area with drinking water throughout the planning period for this water system plan.
Local and regional ordinances and policies regulating Utility operations are in Chapter 2, Section 2.2.
1.4 Facilities Inventory
This section is an overview of Olympia’s water system facilities - wells, pumps, storage tanks, and transmission and distribution lines described more fully in Chapters 8-10. The Water Facilities Inventory form submitted to DOH is in Appendix 1-7.
Map 1.4 shows the location of the major water system components; elevations are shown on Figure 1.1, a profile schematic of the system.
Source of Supply
Olympia depends solely on groundwater to meet its drinking water needs. The McAllister Wellfield is the primary source of water for all City customers. From May through October, daily water use doubles and sometimes nearly triples, mostly due to outdoor water use. During these months, the City uses up to six additional wells to supplement the McAllister Wellfield.
Drinking Water Protection Areas are designated for each source. See Chapter 7 for information regarding hydrogeology, boundary delineations, and land use and zoning for each area.
The McAllister Wellfield provides approximately 69 percent of the total source capacity for the City. It is located about 10 miles east of the City off Washington Highway 510. Water from the Wellfield is pumped to the Meridian Storage Tanks, which are just over a mile to the northwest of the Wellfield. A 36-inch transmission main takes the water on a nine-mile journey, mostly beneath Pacific Avenue, into the storage tanks on Fir Street at Seventh Avenue. From there, water is pumped and piped throughout the City.
The balance of the City water is provided seasonally by up to six wells. East Olympia is served by Shana Park Well 11 (S10), Hoffman Well 3 (S08) and Indian Summer Well 20 (S12). West Olympia is served by Allison Springs Well 13 (S09) and Well 19 (S11), and Kaiser Road Well 1 (S03). Table 1.3 summarizes basic information about each source. For details, see Chapter 4 and Chapter 8.
|
Source |
Location & Approximate Area of Drinking Water Protection Area |
Percent of Current Capacity |
|---|---|---|
|
McAllister Wellfield (S16) |
North Thurston County south of Nisqually Delta |
68.8% |
|
Hoffman Well 3 (S08) Shana Park Well 11 (S10) Indian Summer Well 20 (S12) |
Southeast Olympia, Lacey urban growth area and Thurston County |
18.7% |
|
Allison Springs Well 13 (S09) and Well 19 (S11) Kaiser Well 1 (S03) |
West Olympia and Thurston County |
12.5% |
Storage
Eleven storage tanks serve seven pressure zones throughout the City, with a total capacity of 30.88 million gallons. Five tanks are steel and six are concrete. The Meridian storage tanks, located northwest of the McAllister Wellfield, provide eight million gallons of storage. (See Chapter 9 for details.)
Transmission and Distribution
The transmission and distribution system is a network of over 360 miles of pipe, ranging from ¾-inch to 36 inches in diameter and ranging in age from new to nearly 80 years old. The pipes are made of various materials, including galvanized steel, polyvinyl chloride (PVC), asbestos cement (AC), concrete, ductile iron, steel, high-density polyethylene and plastic.
Because of the topography and extent of the service area, as well as the arrangement of storage tanks and other facilities, Olympia’s water distribution system has been divided into seven pressure zones, listed in Table 1.3. Five booster pump stations pump water throughout the system. For details, see Chapter 10.
Map 1.4 shows the pressure zone boundaries. The pressure zones are designated with numbers corresponding to the overflow elevation of the reservoirs that feed a particular zone; that is, the highest water level in the reservoir as measured from mean sea level. For example, Zone 417 is served by the Hoffman Storage Tank, which has a maximum water level of 417 feet above mean sea level. For details on pressure zones, see Chapter 9 and Chapter 10.
|
Zone |
Pressure Control Facility |
Maximum HGL1 |
|---|---|---|
|
417 |
Fones Road & South Sound Booster Pump Stations/Shana Park, Hoffman and Indian Summer wells |
417 |
|
338 |
Boulevard Storage Tank /pressure-reducing valve from Zone 417 |
338 |
|
347 |
Eastside Booster Pump Station |
347 |
|
264 |
36-inch gravity line from Meridian Storage Tanks |
264 |
|
226 |
Fir Street Storage Tanks |
226 |
|
298 |
Allison Springs Wells / Percival Booster Pump Station |
298 |
|
380 |
West Bay Booster Pump Station |
380 |
View Map 1.1 Olympia Water System Service Area.
View Map 1.2 Olympia City Zoning.
View Map 1.3 Olympia Land Use.
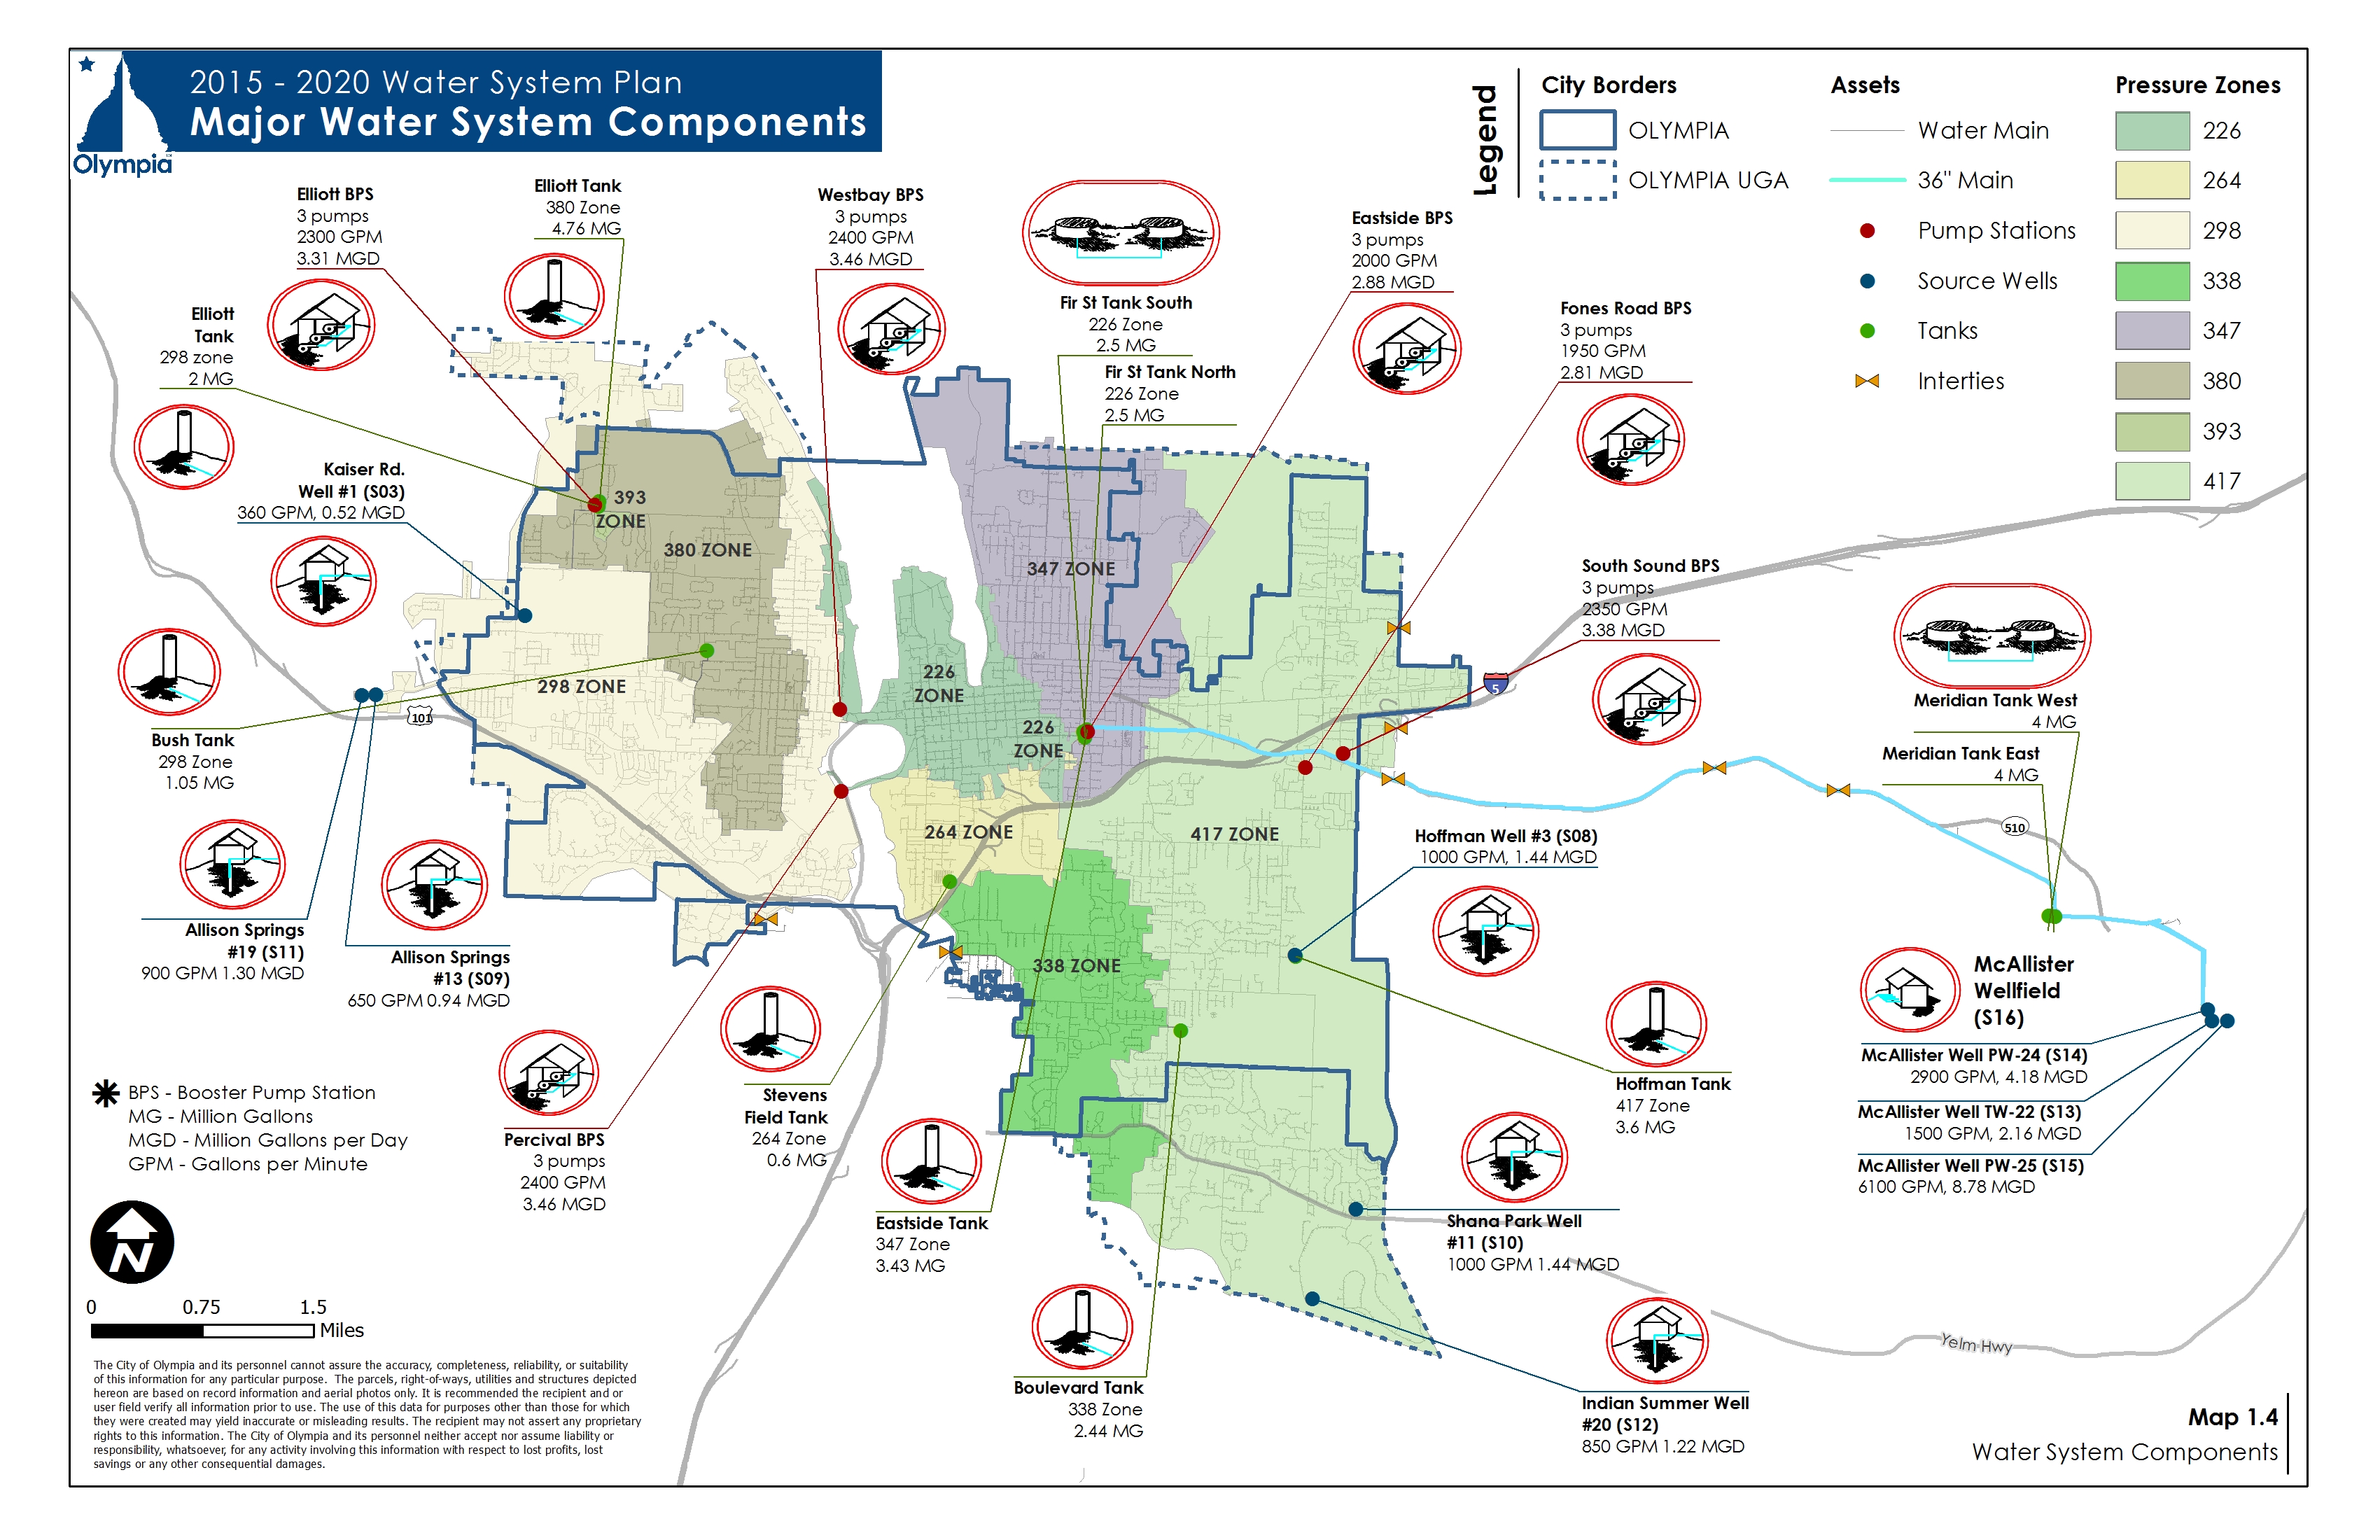
View Map 1.4 Water System Components.
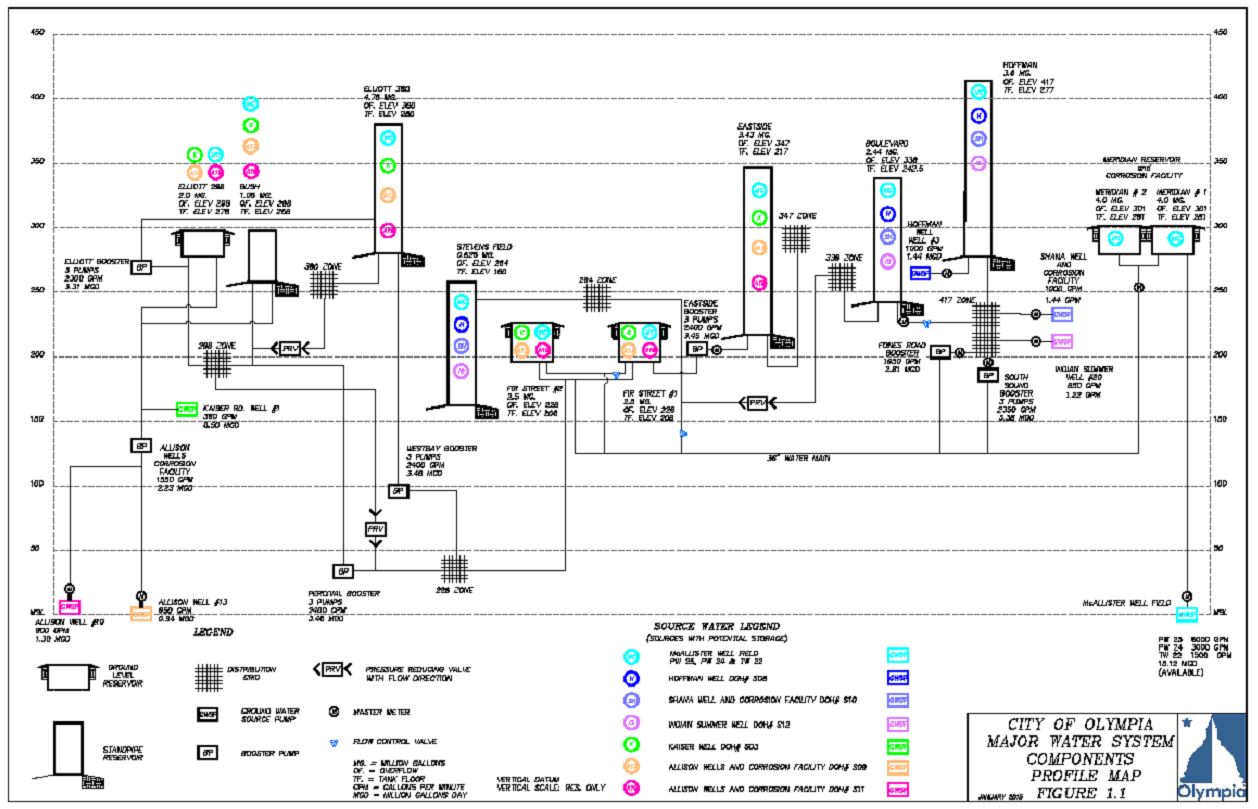
View Figure 1.1 City of Olympia Major Water System Components Profile Map.