CHAPTER 7 – Groundwater Protection Program
As described in Chapter 4, the City is securing sufficient supplies to meet water demands for at least 50 years. The Groundwater Protection Program, by working to prevent contamination of those water supplies, helps meet the Drinking Water Utility’s Goal 5:
Groundwater quality is protected to ensure clean drinking water for present and future generations and to avoid the need for expensive replacement or treatment facilities.
This goal is consistent with the City’s Comprehensive Plan Goal GU6 for the Drinking Water Utility. The Groundwater Protection Program implements Comprehensive Plan Policies PU6.1 through PU6.5.
The Program has three objectives for 2015-2020:
• Prevent contamination of groundwater through surveillance and response.
• Strengthen and exercise partnerships with citizens and state/local agencies.
• Improve program policies, procedures and tools to enhance the effectiveness of groundwater protection efforts.
Implementation strategies have been developed to achieve these objectives, with performance measures designed to meet the Utility’s groundwater protection goal (see Section 7.6)
The Groundwater Protection Program applies to Olympia’s seven Drinking Water (Wellhead) Protection Areas (DWPAs), comprised of the McAllister Wellfield (3 wells), six other drinking water wells – Shana Park, Indian Summer, Hoffman, Allison Springs (2 wells) and Kaiser – and one planned well – Briggs.
The 2015-2020 Groundwater Protection Program continues the 2009 program’s proactive and precautionary approach to preventing contamination of the City’s water sources. The foundations of the Program continue to be the DWPA delineations and the contaminant source inventories, which together enable staff to focus on the areas of greatest risk to the City’s drinking water aquifers.
7.1 Groundwater Protection Regulations
The City protects its groundwater sources by complying with the 1986 federal Safe Drinking Water Act and its amendments. This federal regulation is implemented through the Washington State Department of Health’s (DOH) Source Water Protection requirements, which are captured in Chapter 246-290 of Washington’s Administrative Code (WAC). The City implements the sanitary control area and wellhead protection requirements of WAC 246-290-135, but is no longer required to maintain a watershed control program given the replacement of McAllister Springs (DOH Source Number S01) with the McAllister Wellfield (S16) in late 2014. Past source water protection plans written for the City are dated 1995, 1997 and 2003.
Portions of Olympia’s DWPAs extend into the City of Tumwater, the City of Lacey and Thurston County jurisdictions (Section 7.2). Because Olympia can exercise groundwater protection requirements only within its own city limits, the City coordinates with neighboring jurisdictions to ensure protection of Olympia’s groundwater supplies.
Olympia’s groundwater protection ordinance was codified in 2005 in Olympia Municipal Code, Title 18 Unified Development Code, Chapter 18.32 Critical Areas, with Sections 18.32.200–240 applying to Drinking Water (Wellhead) Protection Areas. The ordinance was revised in 2009, adopting new DWPA delineations.
The City also regulates the construction of groundwater monitoring wells through the City’s Engineering Design and Development Standards (EDDS). Chapter 6-Drinking Water includes Section 6.300 Groundwater Monitoring Wells, and Drawing No. 6-27 Resource Protection–Monitoring Well Design to ensure consistent construction of wells that also meet Washington State Department of Ecology (Ecology) well construction standards (Chapter 173-160 WAC). Program staff has developed a process to deviate from the EDDS monitoring well standard as needed, with the approval of the City Engineer. Ecology has supported such deviations.
To protect groundwater within Olympia’s urban growth area, the Utility collaborates with Thurston County Health Department to implement Thurston County’s Code of Ordinances. Specifically, Title 23 Olympia Urban Growth Area Zoning and Title 24 Critical Areas (Chapter 24.10 Critical Aquifer Recharge Areas) are used to protect Olympia’s groundwater resources within County jurisdiction. Staff also coordinates with City of Tumwater and City of Lacey to protect Olympia DWPAs within their jurisdictions.
7.2 Regional Environment
This section reviews the physical environment of Olympia’s Drinking Water Utility service area as reflected in the regional topography and hydrogeology of north Thurston County.
Topography
Olympia lies within the Puget Sound lowlands basin, which was formed by glacial action and erosion and sedimentary deposition since the last ice age. The topography of the City’s water service area is generally low-lying, ranging from sea level to about 380 feet mean sea level (msl).
Because land elevation within and between neighborhoods varies appreciably, the service area is divided into pressure zones. Storage tanks and booster pumps ensure adequate water pressure regardless of location (see Chapter 1).
Most of Olympia is at the mouth of a watershed drained by the Deschutes River, which discharges into Puget Sound’s Budd Inlet (Map 7.1). Near its confluence with Budd Inlet, the river flows through Capitol Lake, an artificial lake created in 1951 by a dam on the Deschutes River. The lake separates the downtown business district from Olympia’s west side.
A portion of west Olympia drains into Green Cove Creek in the Eld Inlet watershed, and a portion of east Olympia drains into Woodard Creek in the Henderson Inlet watershed. The McAllister Wellfield (S16), the City’s primary water source, is within the Nisqually River watershed (WRIA 11). The other six wells are in the Deschutes River watershed (WRIA 13).
Hydrogeology
The most recent information on the hydrogeology of Olympia’s DWPAs is in two companion reports prepared by Golder and Associates to support the 2009 revisions to delineations of the City’s Drinking Water Protection Areas. One report is focused on the hydrogeological conditions of the City’s wellfield areas; the other report addressed the groundwater modeling which resulted in the new delineations. These reports are collectively referred to in this chapter as the Golder reports (2008a and 2008b).
This section highlights key points from these reports that are relevant to understanding Olympia’s drinking water supply aquifers and delineation of Drinking Water Protection Areas.
Geology in Olympia and the rest of Thurston County is the result of substantial glacial activity in Puget Sound. Receding glaciers left the land dotted with lakes and ponds. Materials deposited during successive glacial periods vary from fine-grained sand and clay to gravel and boulders. These materials are dispersed throughout the area in a complex series of geologic formations created by thousands of years of land, water and ice movement. Many of the formations are highly permeable, with the capacity to easily transmit 50-plus inches of annual precipitation.
Olympia’s most productive aquifers are in these glaciated areas, and are extremely vulnerable to contamination. Several relatively minor incidents of groundwater contamination have occurred in northern Thurston County over the years, and studies have documented steadily increasing levels of nitrate in the groundwater, particularly in the area around the Shana Park Well 11 (S10), due to soluble landscape and turf fertilizers and on-site septic systems.
Following is a general description of the various hydrostratigraphic units (layers) under the current interpretation as offered in the Golder reports. The units are ordered from shallower to greater depths below ground surface.
• Post-Vashon (Holocene) Alluvial and Deltaic Sediments. Along shallow valley bottoms of the main streams. Minimally significant in storing or transmitting groundwater.
• Vashon Recessional Outwash (Qgo, Qgos). Permeable sand and gravel deposits that make up the unconfined water table aquifer in large parts of the region, but may not always contain groundwater. Supports wells for mostly small-scale domestic use. Shana Park Well 11 (S10) withdraws water from this aquifer, as well as from the Vashon Advance Outwash(Qga).
• Vashon Glacial Till (Qgt). Sand, gravel and boulders encased in a silt-clay matrix. Commonly referred to as “hardpan” where laid down beneath heavy glacial mass, but less compact where formed by melting ice. Exposed in many parts of the region, notably above incised stream valleys and in upland areas. Generally acts as an extensive confining bed with occasional permeable windows.
• Vashon Advance Outwash (Qga). Fine- to coarse-grained sand and gravel, laterally extensive in the region, but exposed only along steep riverbanks and Puget Sound bluff faces. The main aquifer for most small-scale private wells; supplies several larger-yielding municipal and industrial wells. Shana Park Well 11 (S10) and Kaiser Well 1 (S03) withdraw water from this aquifer.
• Pre-Vashon Glaciolacustrine Deposits (Qpf). Laminated clayey and silty sediments, with low permeability. Confining layer between the overlying Vashon and underlying pre-Vashon aquifers.
• Pre-Vashon Gravel (Qpg). Coarse, stratified sand and gravel, laterally extensive and exposed along the bottom of the Nisqually River between the confluence with the McAllister Valley and Muck Creek. Rarely more than 50 feet thick (between 15 and 70 feet), it forms the principal (mostly confined) aquifer in the area and is tapped extensively by wells. Primary supply source for the Allison Springs Well 13 (S09) and Well 19 (S11), Hoffman Well 3 (S08) and Indian Summer Well 20 (S12).
• Undifferentiated Quaternary and Tertiary Deposits (TQu). Fine to coarse-grained unconsolidated sediments extending to bedrock. Consists of a sequence of aquifers and confining beds, tapped locally by a few water wells.
• Bedrock. Relatively impermeable sedimentary sandstone, siltstone and claystone, and some igneous bodies of andesite and basalt. Does not contribute to the regional groundwater flow system, although some private wells produce groundwater from these layers.
Two locally defined aquifer units, the Unconfined McAllister Gravel (Qmg) and Deschutes Valley Aquifer (DVA) systems supply most of Olympia’s water. The McAllister Wellfield (S16) is supplied by the deep and productive Unconfined McAllister Gravel. The planned Briggs Well will be supplied by the Deschutes Valley Aquifer system.
Groundwater Flow
This section summarizes information on groundwater flow, and regional recharge and discharge from the Golder reports (Golder 2008a and 2008b).
Regional groundwater flow occurs in the three primary regional aquifers: the Vashon Advance Outwash (Qga), the Pre-Vashon Gravel (Qpg) and the Undifferentiated Quaternary and Tertiary Deposits (TQu). Local flow occurs in the mostly perched Vashon Recessional Outwash (Qgo) unit and in the highly transmissive, unconfined McAllister Gravel aquifer (Qmg) located in the McAllister-Nisqually area. Where present, the intervening till and fine-grained lacustrine units act to hydraulically separate the aquifers, resulting in hydraulic head differences of more than 100 feet between the water table and the Undifferentiated Quaternary and Tertiary Deposits (TQu) aquifers in some areas.
Regionally, groundwater flows from the upland recharge areas in the southern part of Thurston County toward the north, where groundwater discharges to Puget Sound, the main rivers (the Nisqually and Deschutes), natural springs and seeps, numerous shallow lakes, and streams. Groundwater elevations up to 400 feet above msl occur in the area south of the towns of Rainier and Yelm. Conversely, groundwater levels are as low as a few feet above msl along the Puget Sound and less than 20 feet above msl in the upper part of the McAllister Valley.
The primary regional source of groundwater is infiltration of precipitation (or precipitation-derived) recharge. Locally, seepage from rivers, streams and lakes also provides a source of groundwater where surficial soils are sufficiently permeable to allow the vertical movement of water to the water table. Also, some relatively minor return flow of groundwater pumped by individual private wells occurs via on-site septic systems in areas that are not connected to sanitary sewer systems. Some inflow of groundwater into the area also occurs from the south of Fort Lewis.
The main discharge of groundwater occurs as subsurface outflow to Puget Sound, seepage to support the main rivers, lakes and streams, discharge at natural springs and groundwater pumping. Most of these are non-point flows and therefore are difficult to measure directly. However, records of discharge at some of the main features (such as McAllister Spring and the municipal wells) do allow local water budgets to be estimated.
Groundwater Quality
The regional groundwater quality is considered good, although a few water chemistry issues can be found in localized areas, including:
• Iron and Manganese at elevated levels.
• Nitrates, likely associated with on-site septic systems and soluble fertilizer applications.
• Chloride, particularly in deeper groundwater in aquifers in continuity with saline Puget Sound that are at risk from seawater intrusion under excessive pumping pressure. Although none of the Olympia’s wells have exhibited elevated chlorides, this risk is monitored as groundwater development increases in the region.
See Section 7.4 for potential sources of contamination in Drinking Water Protection Areas. See Chapter 11 for information on how the Utility maintains quality of water at the tap.
7.3 Drinking Water Protection Areas
Drinking Water Protection Areas (DWPAs) are drawn around Olympia’s water supply sources (groundwater wells) to represent the primary recharge areas for specific water supply aquifers (Map 7.1). These groundwater flow areas also contain designations of 0.5-year, 1-year, 5-year and 10-year time-of-travel capture zones within their boundaries.
Wells are referred to by their Olympia name (for example, Well 13) and DOH source number (for example, S09). In this chapter, information on the City’s DWPAs (and associated wells) is presented from east to west:
McAllister Wellfield DWPA (S16) around three individual wells:
• Test Well TW-22 (S13)
• Production Well PW-24 (S14)
• Production Well PW-25 (S15)
East Olympia DWPAs:
• Shana Park DWPA around Well 11 (S10)
• Indian Summer DWPA around Well 20 (S12)
• Hoffman DWPA around Well 3 (S08)
• Briggs DWPA around the planned Briggs Well
West Olympia DWPAs:
• Allison Springs DWPA around Well 13 (S09) and Well 19 (S11)
• Kaiser DWPA around Well 1 (S03)
The 2009 Water System Plan presented new delineations of the City’s DWPAs and capture zones, which were determined by computer models to mathematically simulate the inflows (recharge) and outputs (discharge) of aquifers. The 2009 plan contains extensive detail about these updated DWPAs, including hydrogeological characteristics, groundwater flow conditions, water quality, land use and zoning. That information was taken from the source susceptibility assessments (completed by City staff as required by DOH) and the Golder reports.
This section summarizes the basic characteristics of each DWPA. It focuses on activities and accomplishments made during the previous planning period, including expansion of the Utility’s network of monitoring wells, and completion of source susceptibility assessments for the wells that comprise the new McAllister Wellfield (S16).
DWPA Descriptions
Below are the general location and uses of drinking water sources in each DWPA.
McAllister Wellfield DWPA
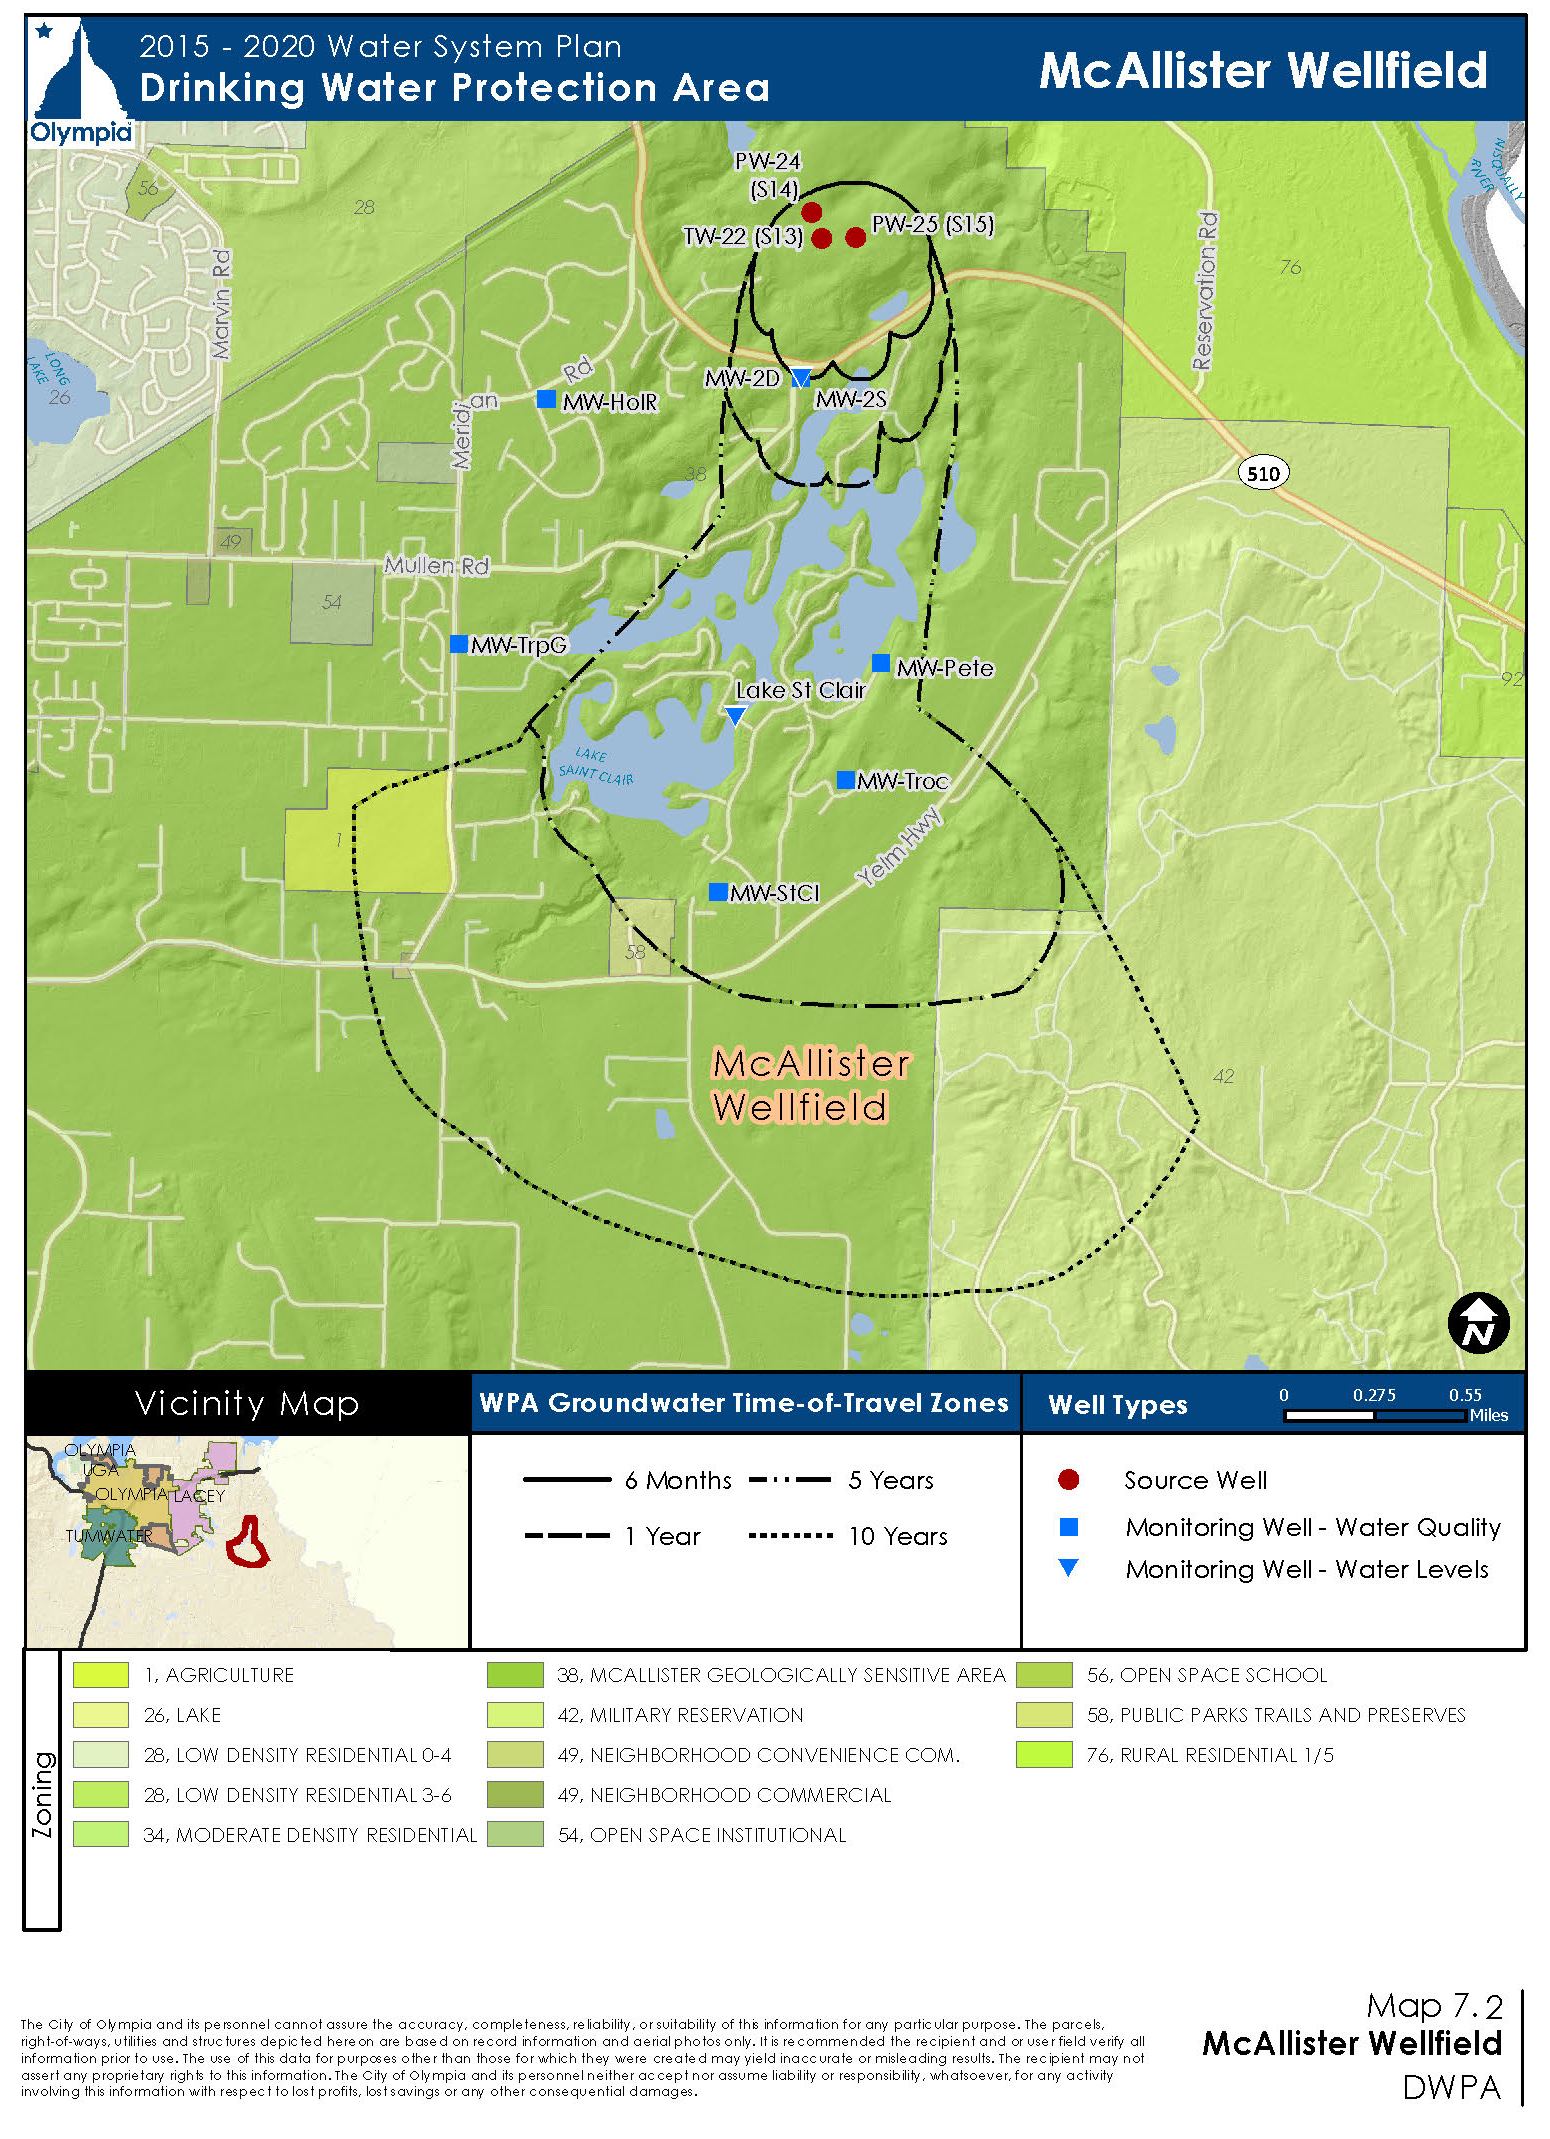
The City’s newest DWPA protects the McAllister Wellfield (S16), located in north Thurston County (Map 7.2). Beginning in late 2014, the McAllister Wellfield (S16) replaced the City’s surface water supply, McAllister Springs (S01) (Chapter 4). The Wellfield, located about one mile southeast of McAllister Springs, can supply the entire water service area and provides most of the City’s drinking water year-round. Much of the McAllister Wellfield DWPA overlaps the McAllister Springs DWPA and several monitoring wells in the McAllister Springs DWPA are used for Wellfield monitoring. The Utility plans to consider supplementing the Wellfield DWPA with additional monitoring wells during 2015-2020.
East Olympia DWPAs
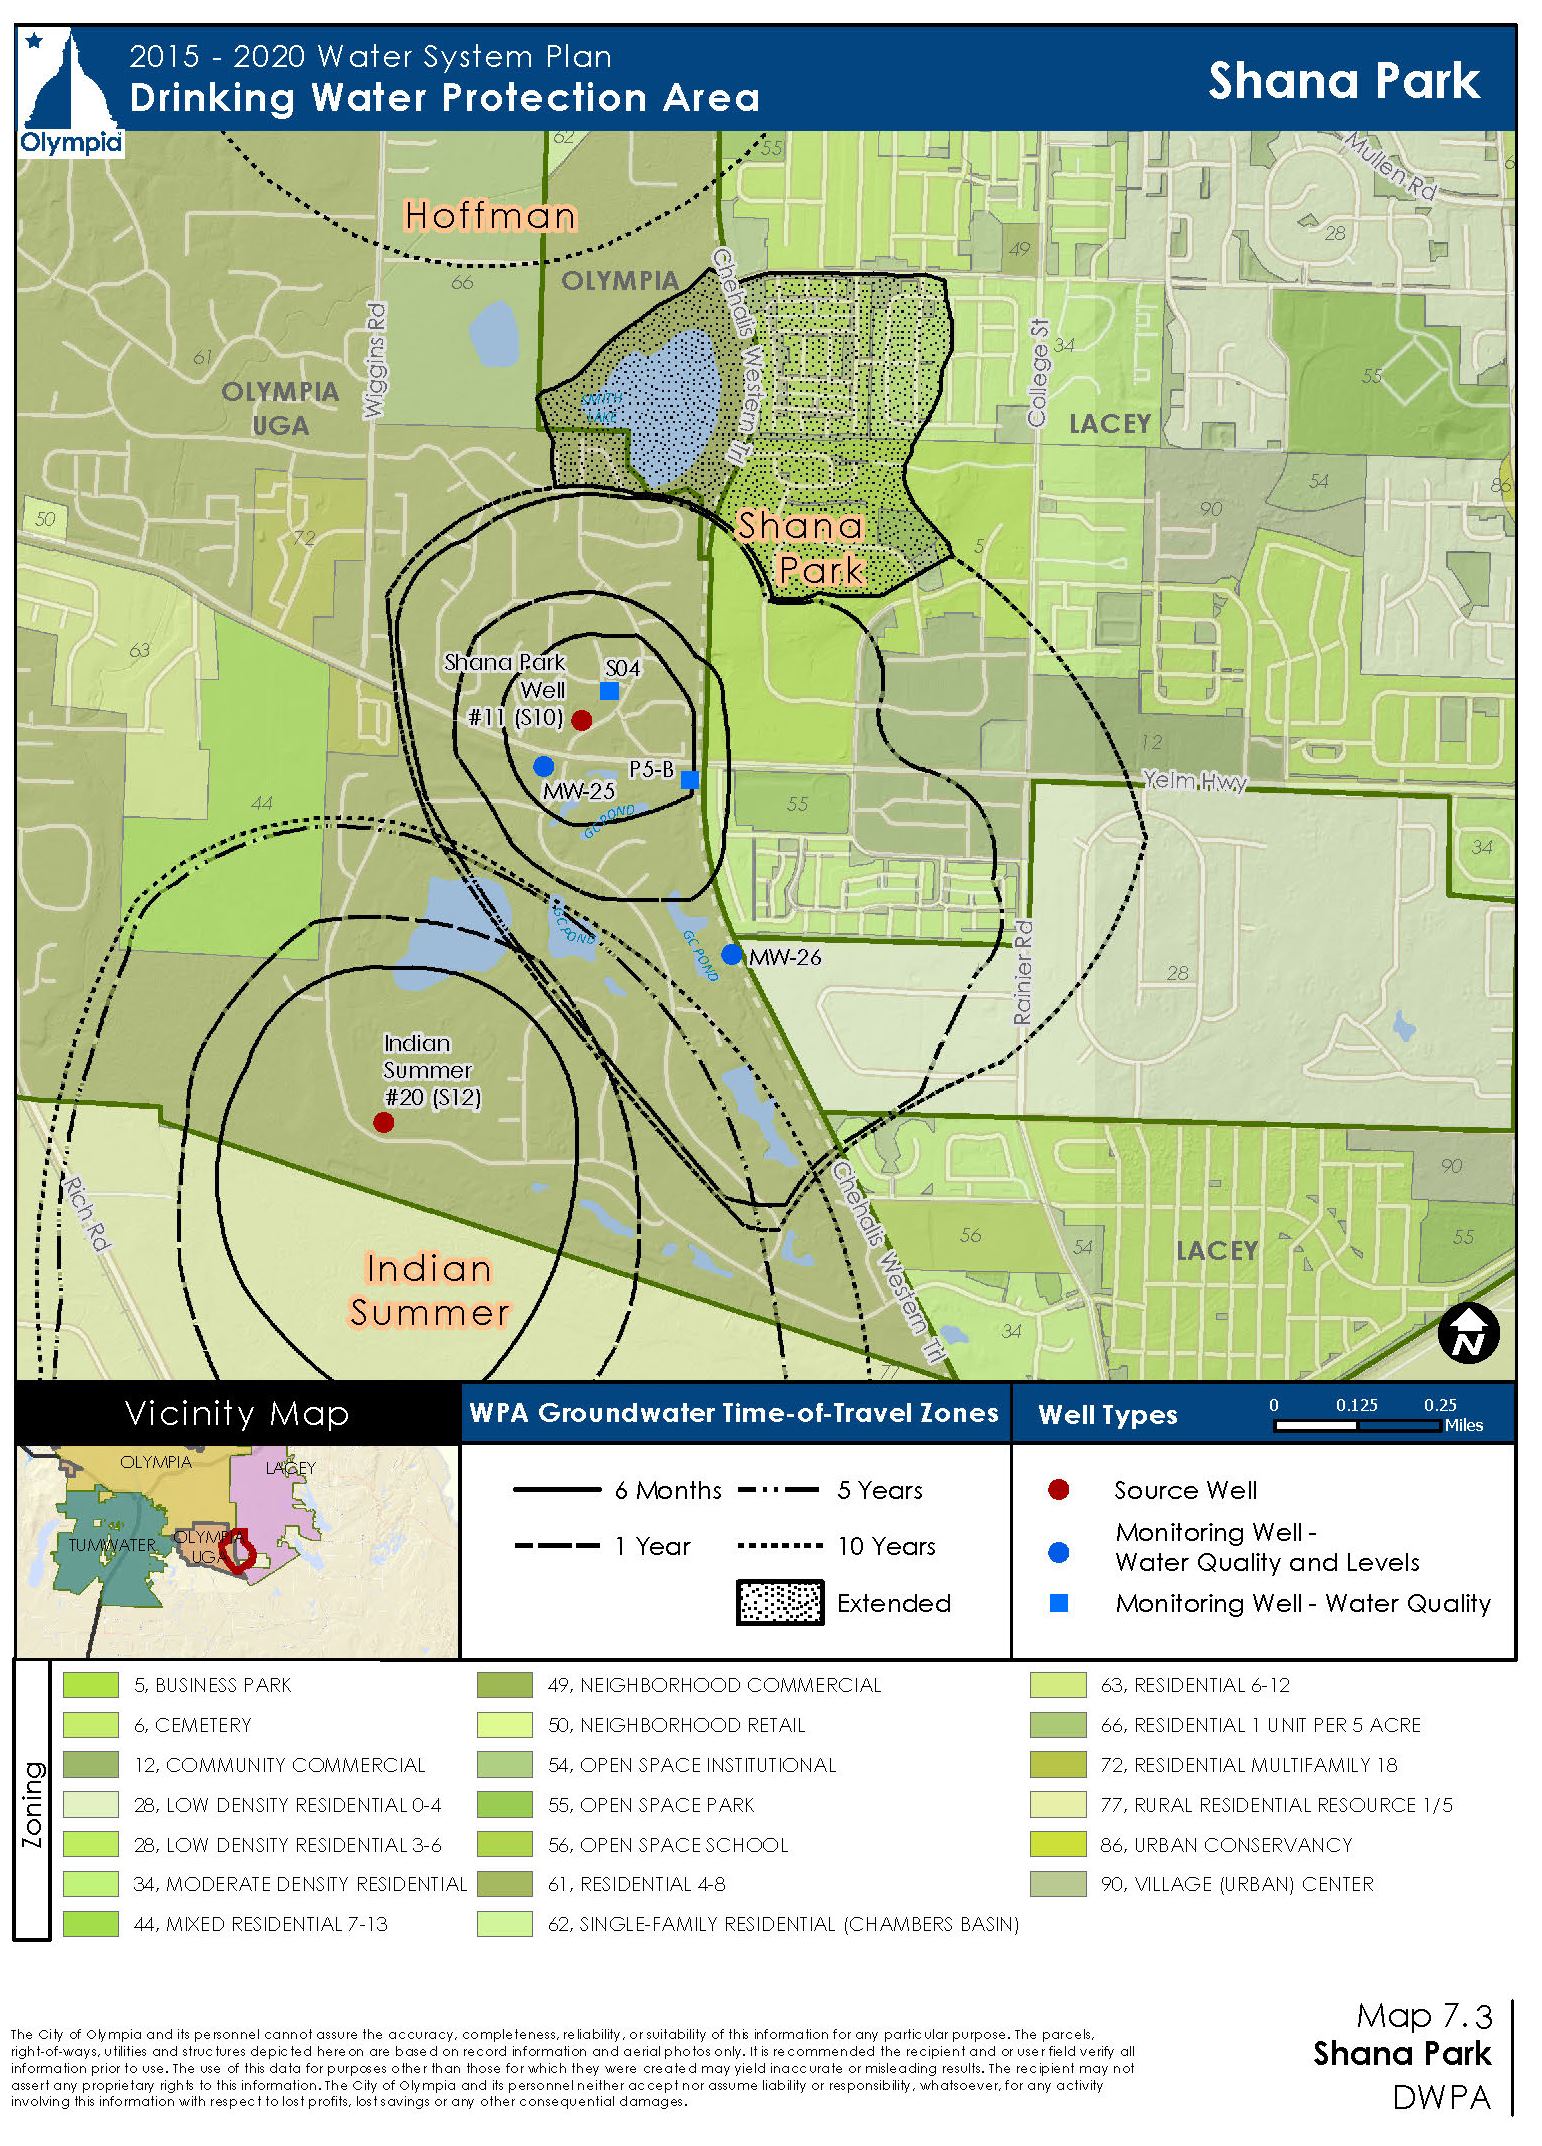
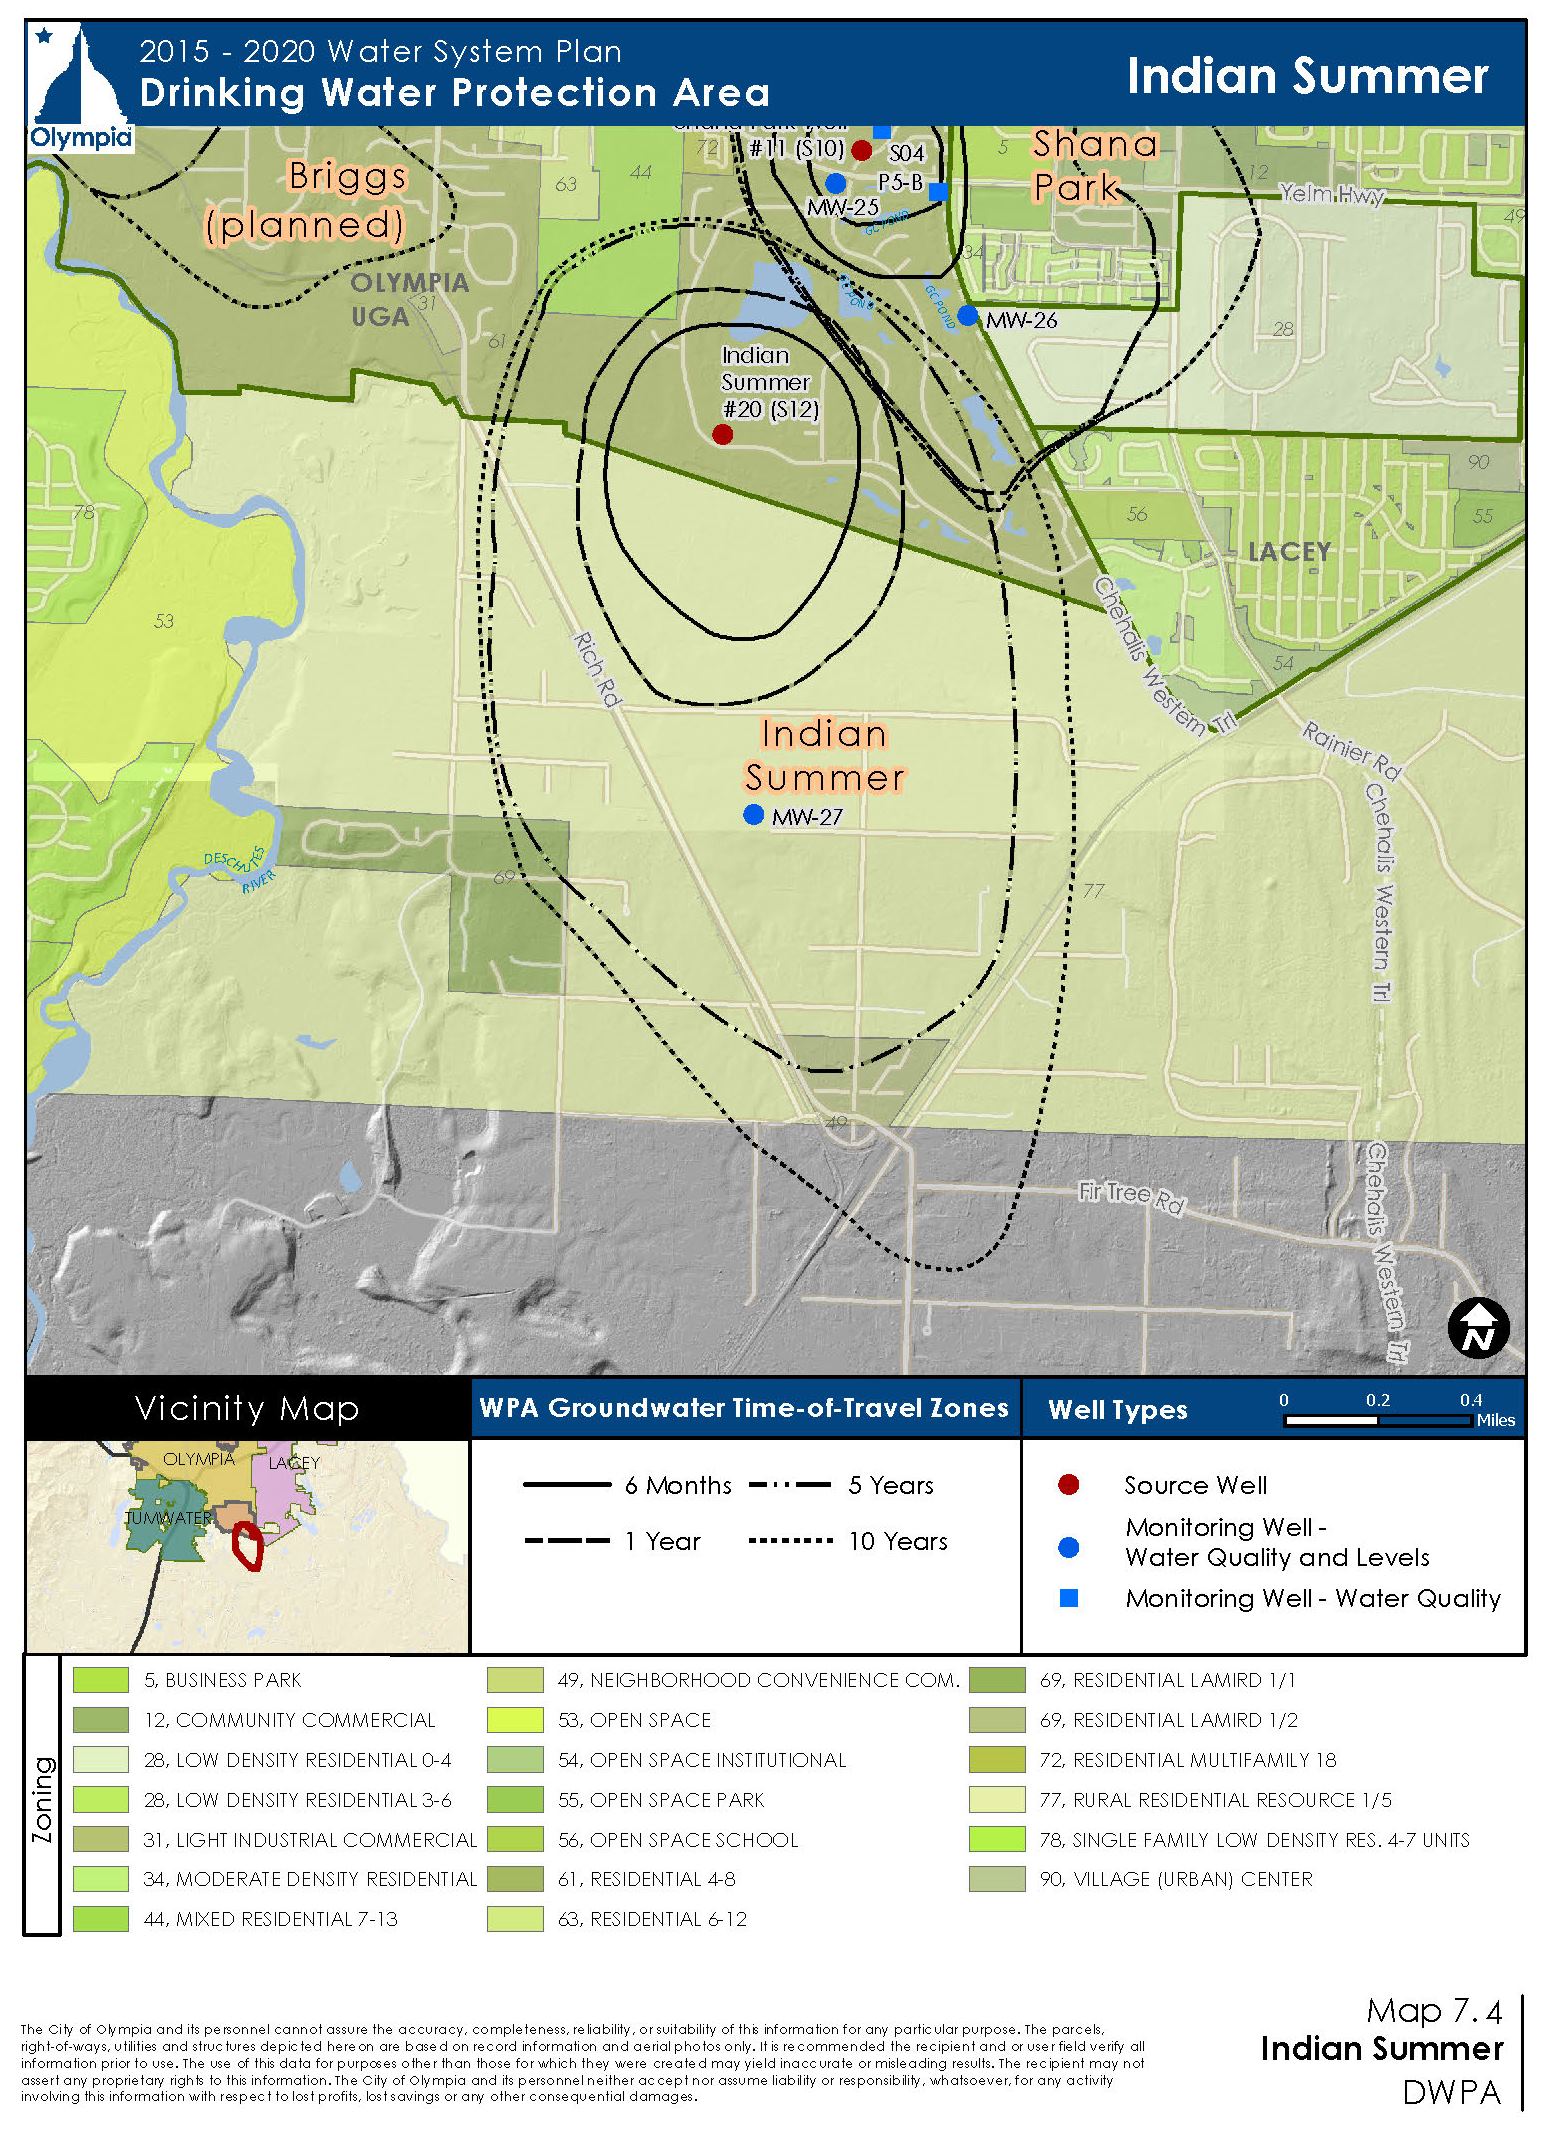
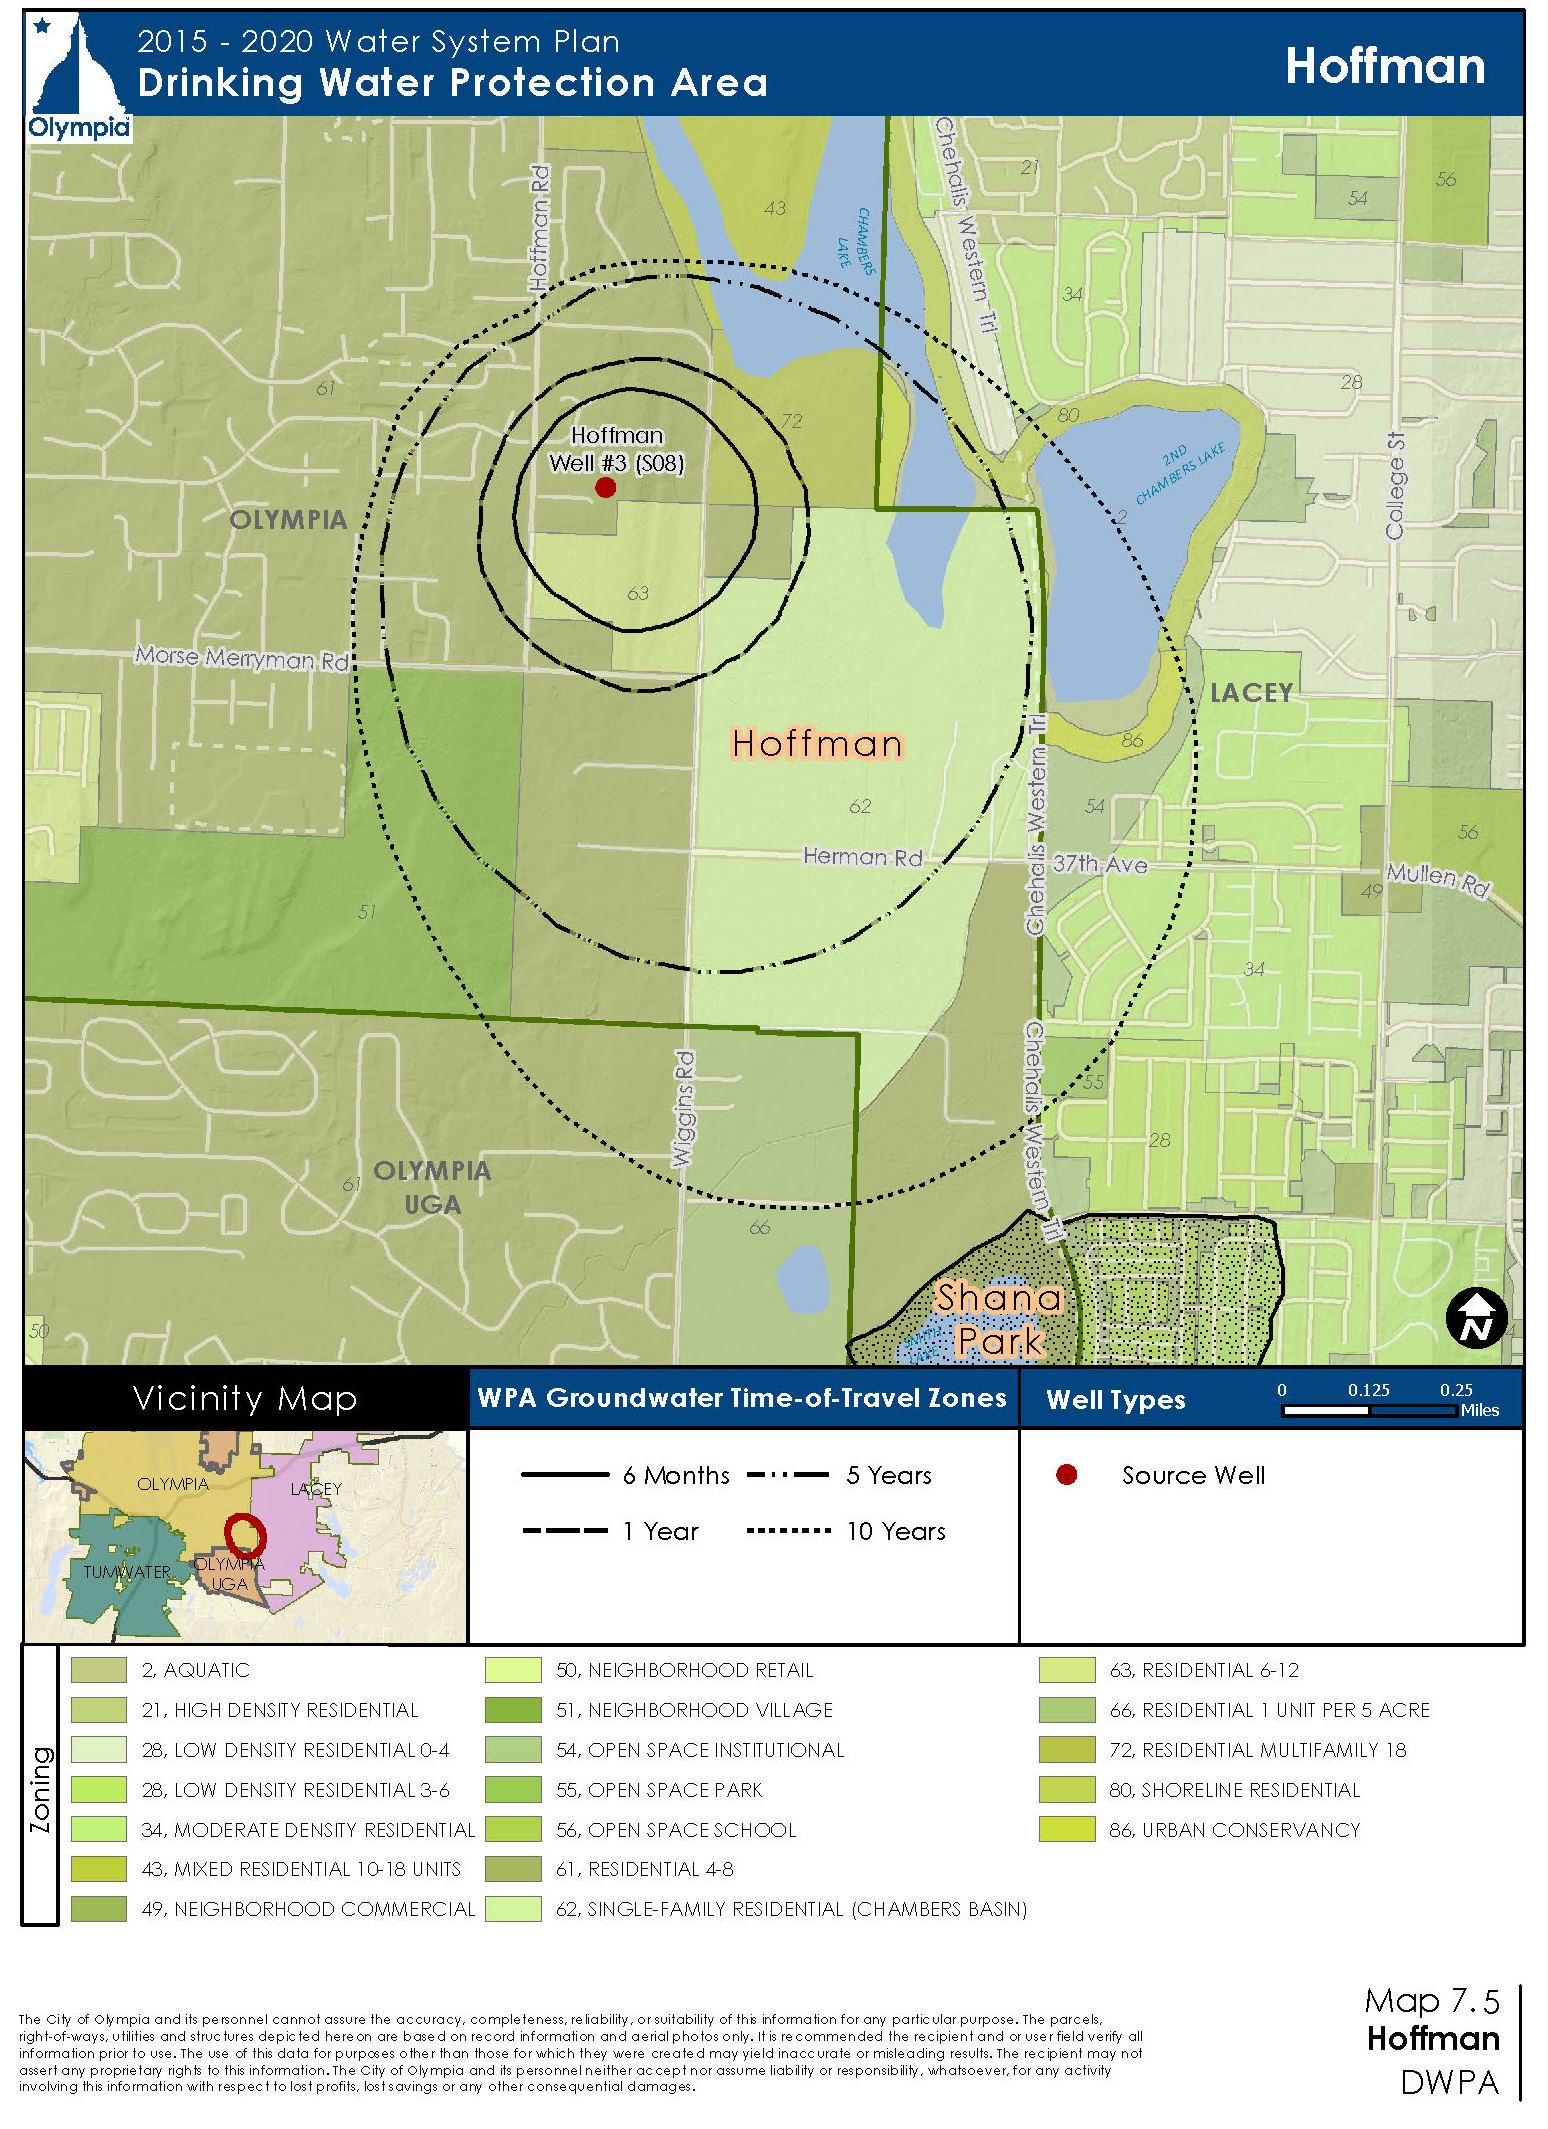
Three DWPAs in southeast Olympia protect three wells: Shana Park Well 11 (S10), Indian Summer Well 20 (S12) and Hoffman Well 3 (S08). Shana Park Well 11 (S10) (Map 7.3) supplements the City’s annual supply seasonally, primarily between May and October. The Indian Summer Well 20 (S12) (Map 7.4) came on line in late 2009 and provides additional water supply mostly during the summer. The Hoffman Well 3 (S08) (Map 7.5) is rarely used. In 2013, the City installed two new monitoring wells in the Shana Park DWPA, for a total of four monitoring wells. In 2014, the City installed one monitoring well in the Indian Summer DWPA. Monitoring wells have not been installed in the Hoffman DWPA given the well’s limited use and naturally protective aquifer system.
A DWPA also has been delineated for the planned Briggs Well (Map 7.6). Well construction has been deferred to May 2019 under a construction extension granted by Ecology. The well is planned to be on the site of the Briggs Village development (former Briggs Nursery) near Ward Lake. At the appropriate time, the City will work with the property developer to install a monitoring well.
West Olympia DWPAs
Two DWPAs protect three wells on the west side of Olympia: Allison Springs Well 13 (S09), Allison Springs Well 19 (S11) and Kaiser Well 1 (S03). The Allison Springs wells (Map 7.7) are used primarily during the summer months, and occasionally year-round. Until the status of the Kaiser Well 1 (S03) (Map 7.8) was changed to emergency usage in mid-2015, it primarily provided seasonal support during the summer months. In 2011, 2012 and 2013, three monitoring wells were installed in the Allison Springs DWPA: one by the City and two by separate developers (required for compliance with the City’s groundwater protection ordinance). A total of four monitoring wells are now located within the Allison Springs DWPA. No monitoring wells have been installed in the Kaiser DWPA given the historically limited use of the well, its location in a mostly rural area of West Olympia, and the Utility’s designation of the Kaiser Well 1 (S03) as an emergency source in mid-2015.
Hydrogeology of Olympia’s DWPAs
As stated previously, DWPA boundaries were re-delineated in 2009 for each of Olympia’s supply wells. Groundwater modeling techniques were used with peak summer pumping rates in steady-state flow field simulations for each well. Available hydrogeological data and the results of modeled sensitivity analyses were interpreted for each DWPA to simulate contaminant transport flow paths and delineate time-of-travel zones to wells. The combination of known physical data (such as from boreholes and groundwater levels) and predicted flow paths helped improve the Utility’s understanding of hydrogeological conditions of each supply well and associated DWPA.
The major hydrogeological features of Olympia’s DWPAs are summarized in Table 7.1.
|
|
Aquifer Conditions (the supply aquifer is shaded) |
Major Surface Water Features |
Groundwater Flow Directions |
General Groundwater Quality |
|||||||||||
|---|---|---|---|---|---|---|---|---|---|---|---|---|---|---|---|
|
Well Depth |
Shallow |
Intermediate |
Deep |
Lakes |
Rivers |
Seeps/Springs |
Shallow |
Intermediate |
Deep |
Shallow |
Intermediate |
Deep |
|||
|
McAllister Wellfield (S16) |
|||||||||||||||
|
Wells TW-22 (S13), PW-24 (S14), and PW-25 (S15) |
Up to 400 ft |
Semi-confined McAllister Gravel (Qmg) 1 |
Lake St. Clair |
Nisqually River, Eaton Creek, McAllister Creek |
McAllister Springs, Abbot Springs, McAllister Bluff |
N/NE - toward Nisqually River |
Excellent. Some elevated iron and manganese in area wells. Some increasing nitrates in shallower monitoring wells. |
||||||||
|
Briggs (planned) |
|||||||||||||||
|
Planned Well |
350-450 ft |
Deschutes Valley Aquifer (DVA) |
Ward Lake, Hewitt Lake |
Deschutes River |
None |
Limited water level data - assumed N/NW |
No water quality monitoring data available. |
||||||||
|
East Olympia Area |
|||||||||||||||
|
Hoffman Well 3 (S08) |
362 ft |
Unconfined (Qga) |
Confined Pre-Vashon (Qpg) |
Chambers Lake |
Chambers Creek |
None |
N/NW with mounding beneath lakes |
N/NE with north trending groundwater divide |
Limited water level data - assumed N/NW |
N/A |
N/A |
Elevated iron/man-ganese |
|||
|
Shana Park Well 11 (S10) |
90 ft |
Unconfined (Qga) |
Confined Pre-Vashon (Qpg) |
Smith Lake |
Elevated nitrate |
N/A |
N/A |
||||||||
|
Indian Summer Well 20 (S12) |
211 ft |
Unconfined (Qga) |
Confined Pre-Vashon (Qpg) |
Golf Course Lakes |
Elevated nitrate |
Elevated iron/man-ganese |
N/A |
||||||||
|
West Olympia Area |
|||||||||||||||
|
Kaiser Well 1 (S03) |
111 ft |
Confined (Qga) |
Confined Pre-Vashon (Qpg) |
Louise Lake |
Cave Creek |
None |
East to West. North-south groundwater divide in east half of study area |
Limited data – assumed W/NW |
N/A |
N/A |
N/A |
N/A |
|||
|
Allison Well 13 (S09) |
200 ft |
Confined (Qga) |
Confined Pre-Vashon (Qpg) |
Ken Lake |
Mud Bay, McLane Creek, Percival Creek |
Allison Springs |
TCE plume at former landfill (up-gradi-ent) |
Increasing nitrate trend |
N/A |
||||||
|
Allison Well 19 (S11) |
183 ft |
Confined (Qga) |
Confined Pre-Vashon (Qpg) |
Increasing nitrate trend |
N/A |
||||||||||
McAllister Wellfield DWPA
The McAllister Wellfield DWPA is shown on Map 7.2. The primary aquifer supplying the Wellfield (S16) is the highly transmissive, semi-confined McAllister Gravel unit with a thickness of at least 400 feet (Table 7.1). Hydrogeological cross-sections are available in the Golder reports on hydrogeological conditions that led to the updated DWPA delineations.
Groundwater flow from surrounding upland areas converges towards the McAllister Valley, flowing northward toward the Nisqually River and eventually into Puget Sound. Up to an estimated 70 million gallons of groundwater per day flows through the McAllister Gravel unit. Although the large volume of water moving through the aquifer provides a high dilution capacity, the aquifer supplying the Wellfield (S16) is semi-confined and is therefore at risk from potentially contaminating activities on the land surface.
As shown on Map 7.2, the Wellfield (S16) capture zones are relatively narrow in the area between the supply wells (in the northern portion of the DWPA) and Lake St. Clair (in the middle portion) due to the presence of the highly transmissive McAllister Gravel aquifer. The hydraulic gradient in this area is predicted to remain relatively flat in response to planned pumping. The capture zones widen south of Lake St. Clair as the groundwater is drawn in from the surrounding Pre-Vashon glacial and non-glacial sediments.
In general, groundwater quality in the McAllister area is excellent. The Utility performs regular groundwater quality sampling at the water supply wells, and at two City-owned and five private monitoring wells in the McAllister Wellfield DWPA. Since 1987, sampling frequency has ranged from quarterly to annually in as many as 16 monitoring wells located throughout the old McAllister Springs DWPA and the new McAllister Wellfield DWPA. The Utility has sampled for pathogenic indicators, synthetic organic compounds, volatile organic compounds and inorganic compounds including nitrates. (See Section 7.4.)
East Olympia DWPAs
The East Olympia DWPAs for Shana Park, Indian Summer and Hoffman wells are shown in Map 7.3, Map 7.4 and Map 7.5, respectively. A future Briggs Well is also in East Olympia.
Two of the three wells in the East Olympia DWPA, Indian Summer Well 20 (S12) and Hoffman Well 3 (S08), draw water from the confined Pre-Vashon sediments. The third well (Shana Park Well 11 (S10)) draws water from the shallower unconfined aquifer (Table 7.1). Flow directions in the shallow aquifer are to the north-northwest and are affected by groundwater mounding beneath Chambers Lake that provides recharge to the shallow unconfined aquifer in the vicinity of the Hoffman Well 3 (S08) (Map 7.5). Flow directions in the deeper Pre-Vashon aquifer are different, with flow to the north-northeast and a north-south trending groundwater divide. There is a downward hydraulic gradient from the shallow unconfined (Qga) aquifer to the confined Pre-Vashon aquifer (Qpg).
Hydrogeological cross-sections are shown in the Golder reports, while additional hydrogeologic description is provided in the 2009 Water System Plan. Groundwater level and water quality data in the East Olympia local area aquifers are very limited, affecting the accuracy of hydrogeological characterization that may be important for DWPA planning.
Shana Park DWPA. Shana Park Well 11 (S10) (Map 7.3) is highly susceptible to contamination from the surface because it draws water from the shallow unconfined aquifer (Table 7.1). The 2009 DWPA groundwater modeling results indicate the shallow aquifer is vulnerable to surface contamination within a radial distance of less than one mile from Well 11 (S10). Many of the modeled particles migrated to the water table in less than ten years. Because some particles migrated to nearby Smith Lake within this period as well, an Extended Capture Zone was drawn around Smith Lake to account for possible surface water drainage toward the Shana Park DWPA. The well is more than 2000 feet from Smith Lake however, so DOH does not require testing for possible designation as “groundwater under the influence of surface water”. The City plans to address the susceptibility of this source to shallow contamination through Project WS-10 Shana Park Source Contingency Plan (Chapter 13).
The Utility has collected groundwater quality samples at the Shana Park Well 11 (S10) and, since 1998, up to eight monitoring wells at frequencies ranging from quarterly to annually. Samples have been tested for pathogenic indicators, synthetic organic compounds, volatile organic compounds and inorganic compounds including nitrates. Elevated nitrate has been observed in the Shana Park Well 11 (S10) and monitoring wells, confirming that surface activities have impacted groundwater quality. Nitrogen isotope monitoring has indicated that fertilizers and on-site septic systems are the primary sources of nitrates. (See Section 7.4.)
Indian Summer DWPA. Despite being installed in the deeper (Qpg) sediments (Table 7.1), Indian Summer Well 20 (S12) (Map 7.4) has a relatively shallow water level (20 feet below ground surface) and may also be susceptible to contamination from the surface. The 2009 DWPA modeling analysis indicates none of the recharge to the water table that occurs in the five-year travel zone is withdrawn at the well, and the actual recharge occurs to the south of the five-year zone. This suggests that the well is protected against surface contamination within an up-gradient distance of at least one mile.
The Utility has also collected groundwater quality samples from the Indian Summer Well (S12) and one now-unused monitoring well (S5-3) at frequencies ranging from quarterly to annually. Samples have been tested for pathogenic indicators, synthetic organic compounds, volatile organic compounds and inorganic compounds including nitrates. Nitrate was not observed in the Indian Summer Well (S12) until 2012 and 2013, confirming that surface activities have impacted groundwater quality. The result of one nitrogen isotope sample indicates that on-site septic systems may be the primary source of nitrates. (See Section 7.4.)
Hoffman DWPA. Hoffman Well 3 (S08) (Map 7.5) pumps water from a deep, confined aquifer. The top of the well’s screened interval is at a depth of 324 feet below ground surface. A coarse outwash channel, containing no protective till unit (Table 7.1), has been identified to the south of the Hoffman Well in the Chambers Creek area. However, the water pumped at this well is derived from the deep aquifer within the 10-year time-of-travel capture zone. The primary recharge source for this well has been modeled to be four to five miles to the southeast of the DWPA, with recharge reaching the well over an estimated time frame of 50 years.
The Utility has collected groundwater quality samples from the Hoffman Well 3 (S08) on a mostly annual basis. Samples have been tested for pathogenic indicators, synthetic organic compounds, volatile organic compounds and inorganic compounds including nitrates. Iron and manganese above the secondary maximum contaminant levels are the only water quality indicators of concern in the Hoffman Well. (See Section 7.4.)
Briggs DWPA (planned). The Briggs Well (Map 7.6) is planned for construction at the Briggs Village (former Briggs Nursery) site. The depiction of hydrostratigraphy in the Briggs (planned) DWPA was significantly revised by the 2009 groundwater modeling effort. The former Briggs Nursery Well is now understood to have drawn water from the lower part of the Deschutes Valley Aquifer (DVA) sequence rather than the Pre-Vashon units that occur regionally (Table 7.1). The Briggs (planned) DWPA zones are assumed to extend to the southeast more than 1.5 miles within the lower DVA and a further 0.5 miles in the upper part of the DVA unit. The planned DWPA delineation is still preliminary because of limited hydrogeological data. Hydrogeological cross-sections are available in the Golder reports.
The estimated groundwater flow direction is to the north-northwest in both the shallow and deeper DVA materials. The 2009 groundwater model analysis indicated the particles migrated to the water table near Chambers Lake in five to ten years. Therefore, water quality at the well is not expected to be at significant risk from land practices within the five-year zone. No influence from the adjacent Ward and Hewitt Lakes is expected on the deeper aquifer materials, but there is no data to confirm this.
Since the planned Briggs Well has not yet been installed, no water quality data is yet available. Information on the old Briggs Nursery well can be found on Ecology’s Toxics Cleanup Program website.
West Olympia DWPAs
The West Olympia DWPAs for the Allison Springs and Kaiser wells are shown in Map 7.7 and Map 7.8, respectively.
Two of the three West Olympia area wells (Allison Springs Well 13 (S09) and Well 19 (S11)) draw water from the confined Pre-Vashon sediments, while the third (Kaiser Well 1 (S03)) draws water from the shallower unconfined aquifer (Table 7.1). The zones are subject to some uncertainty however, because of data gaps in this area, the main gap being a more accurate characterization of the groundwater flow direction in the deeper Pre-Vashon Gravel aquifer. The geology of this area appears complex, both vertically and horizontally, with distinct areas of till separating aquifer layers in some areas, but complete separation between upper and lower layers not likely in other areas. Hydrogeological cross-sections are available in the Golder reports.
Allison Springs DWPA. Flow directions in the deeper confined Pre-Vashon aquifer are not well defined because of limited water level data. However, bedrock exposed along the Black Hills just south of Allison Well 13 (S09) and Well 19(S11) is probably an important factor that affects groundwater flow in the vicinity of these wells (Map 7.7). A northwesterly component of groundwater flow is likely influenced by the Black Hills bedrock outcrop to the south of these supply wells. A north-northwest regional flow direction would be expected on the northeast side of the Black Hills and would transition to a westerly flow direction on the north side of the Black Hills, where the Allison Springs wells are located.
As with the other supply and monitoring wells, the Utility has collected groundwater quality samples at both Allison Springs wells and, since 2009, up to four monitoring wells, at frequencies ranging from quarterly to annually. Samples have been tested for pathogenic indicators, synthetic organic compounds, volatile organic compounds and inorganic compounds including nitrates. Nitrate has been detected at low levels in both source wells and some monitoring wells, confirming that surface activities have impacted groundwater quality (See Section 7.4).
Kaiser DWPA. Flow directions in the shallow aquifer that supplies the Kaiser Well 1 (S03), although fairly radial, generally trend to the northeast (Map 7.8). A north-south trending groundwater divide has also been identified along the eastern portion of the study area.
The Utility has collected groundwater quality samples at the Kaiser Well 1 (S03) at frequencies ranging from quarterly to annually. Samples have been tested for pathogenic indicators, synthetic organic compounds, volatile organic compounds and inorganic compounds including nitrates. Water quality monitoring does not indicate cause for concern at this well. There are no monitoring wells in the Kaiser DWPA. (See Section 7.4).Map
Land Use and Zoning in DWPAs
This section gives an overview of the assessed land use and zoning within each of Olympia’s DWPAs. The 2009 Water System Plan provides a more comprehensive depiction of assessed land use and zoning in the DWPAs, with maps and tabulations of acreages per DWPA time-of-travel capture zone.
Assessed land use refers to the designation a parcel is given for tax purposes, such as commercial, open space or residential. Zoning determines allowable uses for the parcel. Assessed land use gives a picture of current possible risks to groundwater quality, while zoning indicates potential future development and risks to groundwater quality. Assessed land use data (as of 2007) was obtained from Thurston Regional Planning Council; zoning data (also as of 2007) was obtained from Thurston GeoData Center. Assessed land use and zoning information and maps are to be updated during the 2015-2020 planning period, as part of the biennial contaminant source inventory effort.
McAllister Wellfield DWPA
The McAllister Wellfield DWPA encompasses about 2,960 acres in rural northeastern Thurston County (Map 7.1). Assessed land use is primarily residential, agriculture and parks, and government or institutional. Most of this area has a zoning designation of McAllister Geologically Sensitive Area, which allows only single-family residential development with one unit per five acres (Map 7.2).
East Olympia DWPAs
The East Olympia area includes DWPAs for Shana Park Well 11 (S10), Indian Summer Well 20 (S12), Hoffman Well 3 (S08), and the planned Briggs Well (Map 7.1).
Shana Park DWPA has a land area of about 525 acres (Map 7.3). Assessed land use in the Shana Park DWPA is predominately high, moderate and low urban residential densities, followed by parks, preserves and open space, including the Indian Summer Golf Course and Capital City Golf Course. Near the intersection of College Street and Yelm Highway in Lacey is a rapidly growing commercial area.
Zoning is urban residential in the majority of the DWPA, in both Olympia’s urban growth area and in Lacey and its urban growth area. Lacey also has large areas zoned commercial and moderate density urban residential.
Indian Summer DWPA has a land area of about 1,356 acres (Map 7.4). Assessed land use in the Indian Summer DWPA is predominately urban and rural residential low density followed by vacant land. The Indian Summer Golf Course is also located in this DWPA. Zoning is a combination of urban low densities in Olympia’s urban growth area, and rural densities of one unit per two and three acres in Thurston County.
Hoffman DWPA has a land area of about 811 acres (Map 7.5). Assessed land use is predominately residential low density followed by vacant land and natural resource land. The land area is zoned in a wide variety of residential urban densities in both Olympia and Lacey. There is also Neighborhood Village zoning, which allows for commercial and mixed residential uses, and a small area zoned Neighborhood Commercial.
Briggs (planned) DWPA has a land area of about 400 acres (Map 7.6). Low density residential development is the most common land use, followed by vacant or undeveloped land. The rest of the DWPA is used for roads, railroads and right-of ways; natural resource land; and parks, preserves and open-space. Commercial development within the one-year time-of-travel zone includes the Briggs YMCA and other commercial activities at the intersection of Henderson Boulevard and Yelm Highway. The development of the Briggs Urban Village has changed land use significantly, with a general increase in high-density residential and commercial properties.
Zoning designations within the Briggs (planned) DWPA include an Urban Village within the six-month and one-year time-of-travel zones. This designation allows for a combination of residential and commercial development. The Briggs Urban Village has been permitted and was under construction at the time of writing this Water System Plan. The remainder of the DWPA is zoned single-family residential at 4-8 units per acre.
West Olympia DWPAs
Two DWPAs are located in the West Olympia area, one for Allison Springs Well 13 (S09) and Well 19 (S11), and one for Kaiser Well 1 (S03) (Map 7.1).
Allison Springs DWPA land use has changed recently, particularly within the one-year and five-year time-of-travel zones, shifting from low-density rural residential uses to more high-density residential and commercial uses within Olympia’s city limits and urban growth area. Despite the shift to increased densities, most of the residential land is still low density (less than 3.5 dwelling units per acre), with the remaining area primarily vacant land, roads and rights-of-way (Map 7.7).
Zoning designations in the Allison Springs DWPA primarily fall into urban use categories. Within the one-year time-of-travel zone, they include: Urban Village and professional office/mixed residential, medical services, light industrial/commercial, and professional office/mixed residential. Within the five-year time-of-travel zone they include: general commercial, medical services, residential multi-family and high-density corridor zones.
Kaiser DWPA is also undergoing a shift in assessed land use from rural residential densities to urban residential densities. All of this land is zoned for residential development, and a large portion of the DWPA lies within the Green Cove Basin, which is zoned for low impact development (Map 7.8).
7.4 Contaminant Source Inventory
This section summarizes the results of the 2013-2014 contaminant source inventory with a table of risk levels in each Drinking Water Protection Area (DWPA). Comprehensive contaminant source inventories were completed in 1997, 2003 and 2008. The 2008 contaminant source inventory is in the 2009 Water System Plan, Appendix 8-4. Updates completed for the 2009-2010 and 2011-2012 biennium are summarized in letters to DOH (Appendix 7-1 and Appendix 7-2).
The 2013-2014 inventory addresses the types of contamination and the major sources of contamination in each DWPA, as well as lists resources available to Utility staff to monitor and address potential contaminating conditions and events.
The findings and the notification documents required in WAC 246-290-135 for the 2013-2014 biennium update (completed in 2015) is included in Appendix 7-3.
Sources of Contamination
Four basic types of contaminants can be found in groundwater:
• Microbial pathogens (bacteria, viruses and other microorganisms).
• Inorganic chemicals (nutrients, salts, heavy metals and others).
• Organic chemicals (pesticides, solvents, fuels and other chemicals).
• Sediments/turbidity.
The Groundwater Protection Program monitors these types of contaminants in Olympia’s DWPAs, evaluates their potential impacts on groundwater, and implements strategies to minimize the chances of these contaminants from increasing to levels that would pose a risk.
For the contaminant source inventory, Program staff focuses on contaminants regulated by DOH under the federal Safe Drinking Water Act, which includes the following 12 major sources of potential contamination:
1. Use, storage and disposal of hazardous waste.
2. Pesticides and fertilizers.
3. Transportation and utility corridors.
4. Underground storage tanks.
5. Contaminated sites.
6. Existing and abandoned solid waste landfills.
7. Stormwater runoff and infiltration.
8. On-site septic systems.
9. Agricultural land and golf courses.
10. Abandoned and poorly constructed wells.
11. Animal wastes.
12. Seawater intrusion.
Ranking Risk
Staff developed ranking criteria for high and low degrees of risk, and made assignments based on a standard risk assessment approach. This approach takes into account the presence of the risk, the extent or distribution of the risk, and the potential severity of the threat to groundwater. Risk levels are:
• High. The risk is distributed throughout the DWPA or the potential threat to groundwater is great.
• Low. Both the distribution of the risk and potential threat to groundwater are minimal.
Table 7.2 shows the risk rankings for each DWPA. These rankings, along with the results of the 2013-2014 contaminant source inventory were used to develop the 2015-2020 Groundwater Protection Program’s goals, objectives, strategies and performance measures described in Section 7.6.
|
Risk |
McAllister Wellfield (S16) |
Allison Springs Well 13 (S09) and Well 19 (S11) |
Kaiser Well 1 (S03) |
Hoffman Well 3 (S08) |
Shana Park Well 11 (S10) |
Indian Summer Well 20 (S12) |
Briggs Well, planned |
|---|---|---|---|---|---|---|---|
|
Hazardous materials (use, storage, and disposal) |
High |
High |
Low |
Low |
High |
High |
High |
|
Pesticides and fertilizers |
Low |
High |
Low |
Low |
High |
High |
High |
|
Transportation and utility corridors |
High |
High |
Low |
Low |
High |
High |
High |
|
Underground storage tanks |
Low |
High |
Low |
Low |
Low |
Low |
Low |
|
Contaminated sites |
Low |
High |
Low |
Low |
Low |
High |
High |
|
Existing and abandoned solid waste landfills |
Low |
High |
Low |
Low |
Low |
Low |
Low |
|
Stormwater runoff and infiltration |
High |
High |
Low |
Low |
High |
High |
High |
|
On-site septic systems |
High |
Low |
High |
Low |
High |
High |
High |
|
Agriculture and golf courses |
High |
Low |
Low |
Low |
High |
High |
Low |
|
Abandoned and poorly constructed wells |
High |
High |
High |
High |
High |
High |
High |
|
Animal wastes |
High |
Low |
Low |
Low |
Low |
Low |
Low |
|
Seawater intrusion |
Low |
Low |
Low |
Low |
Low |
Low |
Low |
Notification of Inventory Findings
The DOH requires utilities to conduct a notification process regarding actual and potential sources of contamination within its DWPAs. For the 2013-2014 contaminant source inventory, the Utility sent notification letters to:
• Regulatory agencies, local governments and emergency responders to inform about the locations of potential and actual groundwater contaminant sources in the DWPAs.
• Owners and operators of actual and potential contaminant sources.
The list of sites, maps of site locations, the mailing list of owners/operators, the mailing list of agencies and responders, as well as sample letters are in Appendix 7-3.
Source Susceptibility Assessments
The susceptibility assessment forms and well logs for TW-22 (S13), PW-24 (S14) and PW-25 (S15) in the McAllister Wellfield (S16), are included in Appendix 7-4.
Susceptibility assessments for the other source wells are contained in the 2009 Water System Plan (Appendix 8-2) and are on file with DOH.
Groundwater Monitoring Report
In addition to implementing DOH’s contaminant source inventory requirements (described just above and in Appendix 7-3), the Utility is vigilant in protecting our groundwater resources by evaluating water quality data and water level measurements at all active source wells and selected monitoring wells. These evaluations are intended to help staff stay apprised of any longer term variations in water quality or availability.
Staff summarize the evaluations in Groundwater Monitoring Reports, which are written as updates every one or two years. These reports are for in-house use by staff and reside on the Public Works Water Resources shared drive.
In 2011, Groundwater Protection Program staff completed the first comprehensive analysis of water level measurements and water quality sample results contained in the Utility’s water quality database and other sources, for the City’s seven source wells (at that time) and numerous monitoring wells. Most of the information for this 2011 Groundwater Report (September 2012) had been collected from 1972 through 2011; however, some water quality results dated to 1945 for McAllister Springs (S01). (See also Chapter 11, Section 11.2 for groundwater monitoring information.)
The 2011 Groundwater Report was written to bring together in one document an overview of the history of groundwater protection monitoring events and an analysis of long-term trends in water levels and water quality. Utility staff inspects all source well and monitoring well information soon after the data is collected and results are available. The initial report captured decades of groundwater protection information in one document. An update was completed in 2014 for information collected between 2011 and 2013. The Utility has scheduled subsequent updates to occur every one or two years, depending on the type and amount of activity conducted in the DWPAs as monitoring continues.
The 2011 Groundwater Report and 2014 update reference regulations that apply to the City’s water system and DWPAs. The report briefly characterizes the regional hydrogeological setting, and references past studies of water development and investigations into known and potential contamination sources and risks. It also summarizes information on water rights, water facilities, supply and monitoring wells, well logs and construction, source production and monitoring schedules.
The 2011 and 2014 reports primarily focus on an analysis of groundwater level measurements and water quality sample results, displayed in the form of tabulated counts, values, ranges and averages, and graphed trends. Water level measurements were available from both manual and pressure transducer readings. Water quality measurements included organic, inorganic, radionuclide and bacteriological sample analyses. Limited statistical analysis was performed on some nitrate sample results for selected wells. The report recommended how the Utility could improve water level monitoring and interpretation, maximize collection of representative monitoring well water quality samples, and expand the network of monitoring wells in each DWPA.
Activities, findings and recommendations included in the 2011 and 2014 Groundwater Reports are summarized below. Some of the recommendations are also included as Performance Measures in Section 7.6.
Recent Activities
Activities that were new or recent when the Groundwater Reports were written include:
• Development of the McAllister Wellfield (S16) water supply wells and associated facilities.
• Approval by Ecology to extend construction of the planned Briggs Well through May 2019.
• Installation of five monitoring wells in the Shana Park, Indian Summer and Allison Springs DWPAs with approved deviations from the City’s monitoring well standards.
• Creation of a database to manage groundwater level data and enable improved analysis of groundwater levels. Application of the new groundwater level database enabled improved evaluation and interpretation of localized and some regional groundwater levels.
• Collection of water quality samples for compliance with federal monitoring requirements (UCMR3) pertaining to the City’s source wells.
• Further characterization of the City’s former West Olympia Landfill under the US Environmental Protection Agency (USEPA) Targeted Brownfields Assessment Program.
Findings and Recommendations
Key findings highlighted in the Groundwater Monitoring Reports include:
• Nitrate continues to persist in the Shana Park Well 11 (S10), averaging about 3 milligrams per liter (mg/L).
• Detectable nitrate (just above 2 mg/L) was reported for the first time in the Indian Summer Well 20 (S12) in 2012 and again in 2013. (Subsequent samples in 2014 and 2015 reported nitrate as not detected.)
• New monitoring wells in the Allison Springs DWPA provided evidence that nitrate may be present throughout the DWPA at levels up to about 1.2 mg/L.
Key recommendations include:
• Develop Standard Operating Procedures to improve groundwater level data collection records, based on application of the groundwater level management database.
• Collect additional nitrogen-isotope samples to better understand the potential source(s) of nitrate in the Shana Park and Indian Summer DWPAs, depending on detection of nitrates in new monitoring wells in the Shana Park DWPA.
• Install additional monitoring wells and conduct more frequent nitrate monitoring in the McAllister Wellfield DWPA and East and West Olympia DWPAs.
• Amend the City’s Groundwater Protection Ordinance, OMC 18.32, to clarify the requirements for developers required to install monitoring wells, particularly with respect to well equipment.
• Expand the use of GIS technology to display hydrogeological information, conduct the contaminant source inventory, and to improve presentation of data and interpretations.
7.5 Contingency Planning
Contingency planning is integral to managing the City’s Drinking Water Protection Areas to ensure customers have an adequate supply of potable water in case contamination results in the temporary or permanent loss of the McAllister Wellfield or other supply wells (WAC 246-290-135(3)(c)(vi) and (vii)). Through the Utility’s emergency response planning efforts (Chapter 12, Section 12.2), staff is prepared to address immediate or short-term threats to groundwater (such as a transportation spill) and longer-term threats (such as the loss of a well due to contamination or natural disaster). The Utility’s Emergency Response Plan contains the Vulnerability Assessment, Spill Response Plan and Contingency Plan required by DOH for groundwater protection and general emergency preparedness (Appendix 12-2).
The Vulnerability Assessment, a key element in emergency planning, identifies contamination from hazardous material spills and flood- or earthquake-caused turbidity as the highest risks to the City’s water sources
Because of these risks, the City has coordinated with local emergency response agencies to help address any immediate or short-term threats by implementing the Spill Response Plan. The Utility developed a Contingency Plan to respond to contamination events that require the management of a longer-term water supply emergency. Regardless of the degree of threat or impact, the Utility can also implement its Water Shortage Response Plan with established procedures for curtailment if necessary (Appendix 5-2).
The components of a Contingency Plan include information and necessary analyses already conducted for effective water system operations.
For example, the plan draws on information about the water system’s maximum capacity in relation to source, distribution system, and water rights limits, assuming the loss of major supply wells. It references existing interties with neighboring water systems and identifies future potential sources of drinking water. The plan also applies water quality assurances and control methods already in place prior to using a source of supply (Chapters 1, 3-4 and 8-11).
The City has recently implemented DOH guidance to achieve long-term replacement of the City’s principal source of supply by replacing McAllister Springs (S01) with the less vulnerable McAllister Wellfield (S16). The City has secured a portion of the Brewery water rights for possible additional future supply. The City also plans to evaluate further the development of the Briggs well during this planning period (Chapter 4).
While contingency planning addresses longer-term impacts to water supply sources, it includes procedures for emergency incident and spill response, immediate or short-term threats. Thus, the Utility is by default prepared to quickly and effectively manage spills and other immediate hazards, which is especially important should any occur within our DWPAs. Chapter 12, Section 12.2 further describes actions and resources the Utility is prepared to exercise in cases of immediate emergencies that may occur within a DWPA.
A critical component of emergency response in the DWPAs is effective coordination with neighboring jurisdictions and regional response partners, given that portions of the City’s DWPAs are outside city limits. The City has implemented DOH source water protection requirements by providing partner emergency responders (Chapter 12, Table 12.3) with maps of the DWPA boundaries, contaminant source inventory findings (Appendix 7-3), the results of source water susceptibility assessments (Appendix 7-4) and contingency planning information.
7.6 2015-2020 Groundwater Protection Program
The Groundwater Protection Program is designed to help achieve the Drinking Water Utility’s Goal 5.
Groundwater quality is protected to ensure clean drinking water for present and future generations and to avoid the need for expensive replacement or treatment facilities.
During 2015-2020, the program will continue compliance with source water protection requirements and to maintain past program successes, while striving to expand program effectiveness. Staff will focus program resources on these objectives:
• Prevent contamination of groundwater through surveillance and response.
• Strengthen and exercise partnerships with citizens and state/local agencies.
• Improve program policies, procedures and tools to enhance the effectiveness of groundwater protection efforts.
These objectives are derived from groundwater monitoring plans and reports, contaminant source inventories, and the vulnerability assessment and emergency response plans that are the foundations of the Utility’s contingency planning and emergency preparedness.
For each objective, this section lists a number of strategies and performance measures. Resources will be focused on addressing the highest contamination risks determined from contaminant source inventories (Table 7.2). Also essential are activities that do not directly address specific contaminant risks such as groundwater monitoring and building community awareness. Many of the planned activities are continued from the 2009 Water System Plan, which may be referenced for additional detail. Unless a particular timeframe is indicated below, staff intends to accomplish the performance measures during 2015-2020.
Objective 5.A Prevent contamination of groundwater through surveillance and response.
Strategy 5A.1 Continue to monitor groundwater quality to understand risks to groundwater, detect contamination and evaluate pollution reduction efforts.
Strategy 5A.2 Continue to improve spill prevention actions and implement spill response procedures.
Performance Measures
1. Continue to implement the groundwater monitoring plan, focusing on contamination from nitrate (fertilizers, septic systems and animal waste), stormwater infiltration facilities, pesticide use and hazardous materials spills.
2. Continue to update the Groundwater Report by the end of the first quarter of the year following the evaluation period.
3. Update the biennial contaminant source inventory as required by DOH in 2017 (for the 2015-2016 period) and in 2019 (for the 2017-2018 period).
4. Continue to support the City’s Executive Office in efforts to further characterize contamination associated with the former West Olympia Landfill site.
5. Expand the use of the City’s geographic information system (GIS) to support presentation and interpretation of water quality and hydrogeological information, and to conduct the biennial contaminant source inventory.
6. Develop an inventory and database of existing wells on City property and within all DWPA one-year time-of-travel zones, and determine whether to use or decommission each one. Consider also evaluating all historically used monitoring wells associated with the McAllister Springs DWPA (including monitoring wells located outside the DWPA) and determine the final disposition of monitoring wells not planned for use in monitoring the McAllister Wellfield DWPA.
7. Maintain groundwater models for all DWPAs and consider further evaluating aquifer vulnerability through the use of USEPA’s DRASTIC rating system.
8. Participate in the Local Emergency Planning Committee (LEPC); regularly communicate and coordinate with first responders in DWPAs; and participate in tabletop exercises involving contamination of the water supply.
9. Support efforts to better understand risk to water supplies from railway and road transportation corridors by staying apprised of Thurston County’s Commodity Flow Study, Washington State Department of Transportation highway management and construction activity, and the City’s Westside Transportation Access Study.
Objective 5.B Strengthen and exercise partnerships with citizens and state/local agencies
Strategy 5B.1 Raise awareness about the need to protect groundwater and change human behaviors that place groundwater at risk.
Strategy 5B.2 Collaborate on groundwater protection with state, county and neighboring city agencies.
Performance Measures
1. Collaborate with the City Storm and Surface Water, Wastewater and Waste ReSources Utilities to develop and implement social marketing, education and outreach programs for residents and businesses within DWPAs to communicate proper use, storage and disposal of hazardous materials.
2. Implement a community-based social marketing outreach program with residents and yard care professionals to implement Best Management Practices; include estimating the effect on nitrogen loading to shallow aquifers.
3. Explore the feasibility of offering free or low-cost routine inspections for on-site septic systems located within DWPA one-year time-of-travel zones (for example, inspections of 30 systems per year).
4. Collaborate with Thurston County Environmental Health on technical assistance visits to businesses, review of water quality monitoring and new development within DWPAs in county jurisdiction, cleanups of contaminated sites, numerical groundwater model updates and uses, and social marketing outreach efforts. Support county WasteMobile events, on-site septic system workshops, research and monitoring activities, and implementation of the county’s Local Hazardous Waste Management Plan.
5. Coordinate with the Cities of Lacey, Tumwater and Yelm to protect portions of Olympia’s DWPAs in those cities, and to ensure McAllister Wellfield (S16) mitigation requirements are met.
6. Stay apprised of WRIA 11 (Nisqually) Technical Subcommittee and Stewardship Coalition activities, and the WRIA 13 (Budd/Deschutes) TMDL Technical Subcommittee activities.
7. Coordinate with neighboring jurisdictions on groundwater quality and water level data-sharing efforts to develop a broader understanding of regional water resource conditions.
Objective 5.C Improve program policies, procedures and tools to enhance the effectiveness of groundwater protection efforts.
Strategy 5C.1 Continue to clarify City policies and simplify the development review process.
Strategy 5C.2 Streamline program processes and procedures.
Strategy 5C.3 Ensure that groundwater protection-related capital projects and major equipment are included in the Utility’s Asset Management Program.
Performance Measures
1. Continue to review development applications submitted to Olympia’s Community Planning and Development (CP&D) Department, including technical review of hydrogeological reports when required under the City’s Critical Areas Ordinance.
2. Assess allowing the option of a lysimeter to monitor stormwater infiltration or other groundwater contamination risks or monitoring needs in Drinking Water Protection Areas, and amend OMC 18.32.225.B as needed.
3. Continue to coordinate with the Storm and Surface Water Utility on reviewing pollution prevention and source control plans, and implementing and updating the Stormwater Drainage Manual as needed.
4. Consider modifying the Stormwater Maintenance Agreement requirements to specify ownership and long-term maintenance of monitoring wells and equipment installed by developers per OMC 18.32.225.B.
5. Request Thurston County and the City of Lacey to require enhanced treatment at stormwater infiltration facilities located in DWPAs that lie within their jurisdictions.
6. Continue to support the Wastewater Utility’s efforts to connect properties in DWPAs to public sewer if they are using on-site septic systems and are within the established regulatory distance to connect with the sanitary sewer line.
7. Update the Utility’s land acquisition and management strategy, specifically to incorporate transfer of development rights and easement agreements on priority parcels.
8. Evaluate the feasibility of streamlining the contaminant source inventory process with automating technologies such as GIS mapping and linkages between existing databases used by the Utility’s Water Quality Program, the City’s CP&D and Administrative Services Departments, as well as the Department of Ecology and Thurston County.
9. Review the Utility’s Contingency Plan for accuracy in addressing long-term loss of water sources at greatest risk of contamination; for example, contamination of the Allison Springs wells from a transportation spill or loss of the Shana Park Well 11 (S10) from nitrate contamination.
10. Explore the feasibility of evaluating the McAllister Wellfield (S16) for participation in USEPA’s Sole Source Aquifer Protection Program.
11. Work with City and Thurston County planning staff to revise and update land use and zoning regulations as needed to protect regional groundwater resources.
12. Develop a life-cycle schedule for monitoring well equipment (Hydrolab®), dedicated submersible pumps and water level pressure transducer data loggers, and develop an operating budget to cover expenses.
13. Consider the following additional activities in this planning period or beyond:
• Require a bond to be posted by businesses/facilities that handle hazardous materials to cover the cost of spill response or remediation, prior to operation in DWPA.
• Charge additional fees from businesses/facilities with hazardous materials or landscaped areas (fertilizer use) to offset the potential cost of aquifer cleanup.
• Review building codes for requirements that protect groundwater, such as septic system design, and operation and maintenance.
• Explore “zoning overlays”, or establish special districts that add regulations to controls already in place to help address grandfathered, potentially contaminating sources in DWPAs.
• Ban the sale and use of leachable nitrate products in City limits.
14. Consider the following in developing Levels of Service for groundwater protection:
• Ways to measure the cost of service for protecting groundwater.
• Comparing costs to mitigate risk with the costs of the risk itself, and the number of times it occurs.
• The costs and benefits of monitored or shared risk (insurance).
• The costs of monitoring wells versus source replacement.
• The cost to rehabilitate existing systems.
• Developing a financial strategy for land acquisition.
• Managing and sustaining prioritized land.
• Identifying the long-term groundwater protection needs of the City.
• Incorporating groundwater protection tools into Asset Management Goals.
7.7 Implementation and Staffing
Program staff emphasizes implementing state and local groundwater protection regulations; utilizing monitoring wells for groundwater quality and water levels; identifying and addressing contaminant source risks; and engaging regional partnerships for protection and response. Program staff also attempt to identify and influence human behaviors that put drinking water at risk. Managing the Groundwater Protection Program includes:
• Conducting groundwater protection activities.
• Responding to inquiries related to groundwater protection.
• Designing and implementing projects to promote the protection of groundwater.
• Generating technical reports and planning documents.
• Supporting other City utilities and departments on groundwater protection-related work.
• Managing the program budget.
Most of the activities identified for the Groundwater Protection Program are ongoing efforts that will continue throughout the next six years. Two exceptions are the Groundwater Report, updated approximately every year, and the contaminant source inventory, updated every two years.
The Program’s activities will be conducted at the current staffing level of about 0.5 FTE Senior Program Specialist. (Groundwater Protection Program staffing is shared with the Reclaimed Water Program to equal 1.0 FTE.) Consulting contracts and support from other City resources, primarily in the Public Works and Community Planning & Development Departments, will be sought and exercised as needed. Staffing levels need to be re-evaluated for future effectiveness given that many of the activities identified in the 2009 Water System Plan were carried over into this planning period. Staffing needs for the Groundwater Protection Program will be revisited during this planning period.
For the 2015-2020 planning period, the Capital Improvement Program (Chapter 13) includes allocations for the Groundwater Protection Program to install and equip sentinel groundwater monitoring wells, conduct groundwater modeling, and refine time-of-travel zones. After 2020, funds are planned for property easements, appraisals and possible acquisitions. Funds for these activities will be allocated as other priorities and resources allow.
View Map 7.1 Drinking Water Protection Areas.
View Map 7.2 McAllister Wellfield DWPA.
View Map 7.4 Indian Summer DWPA.
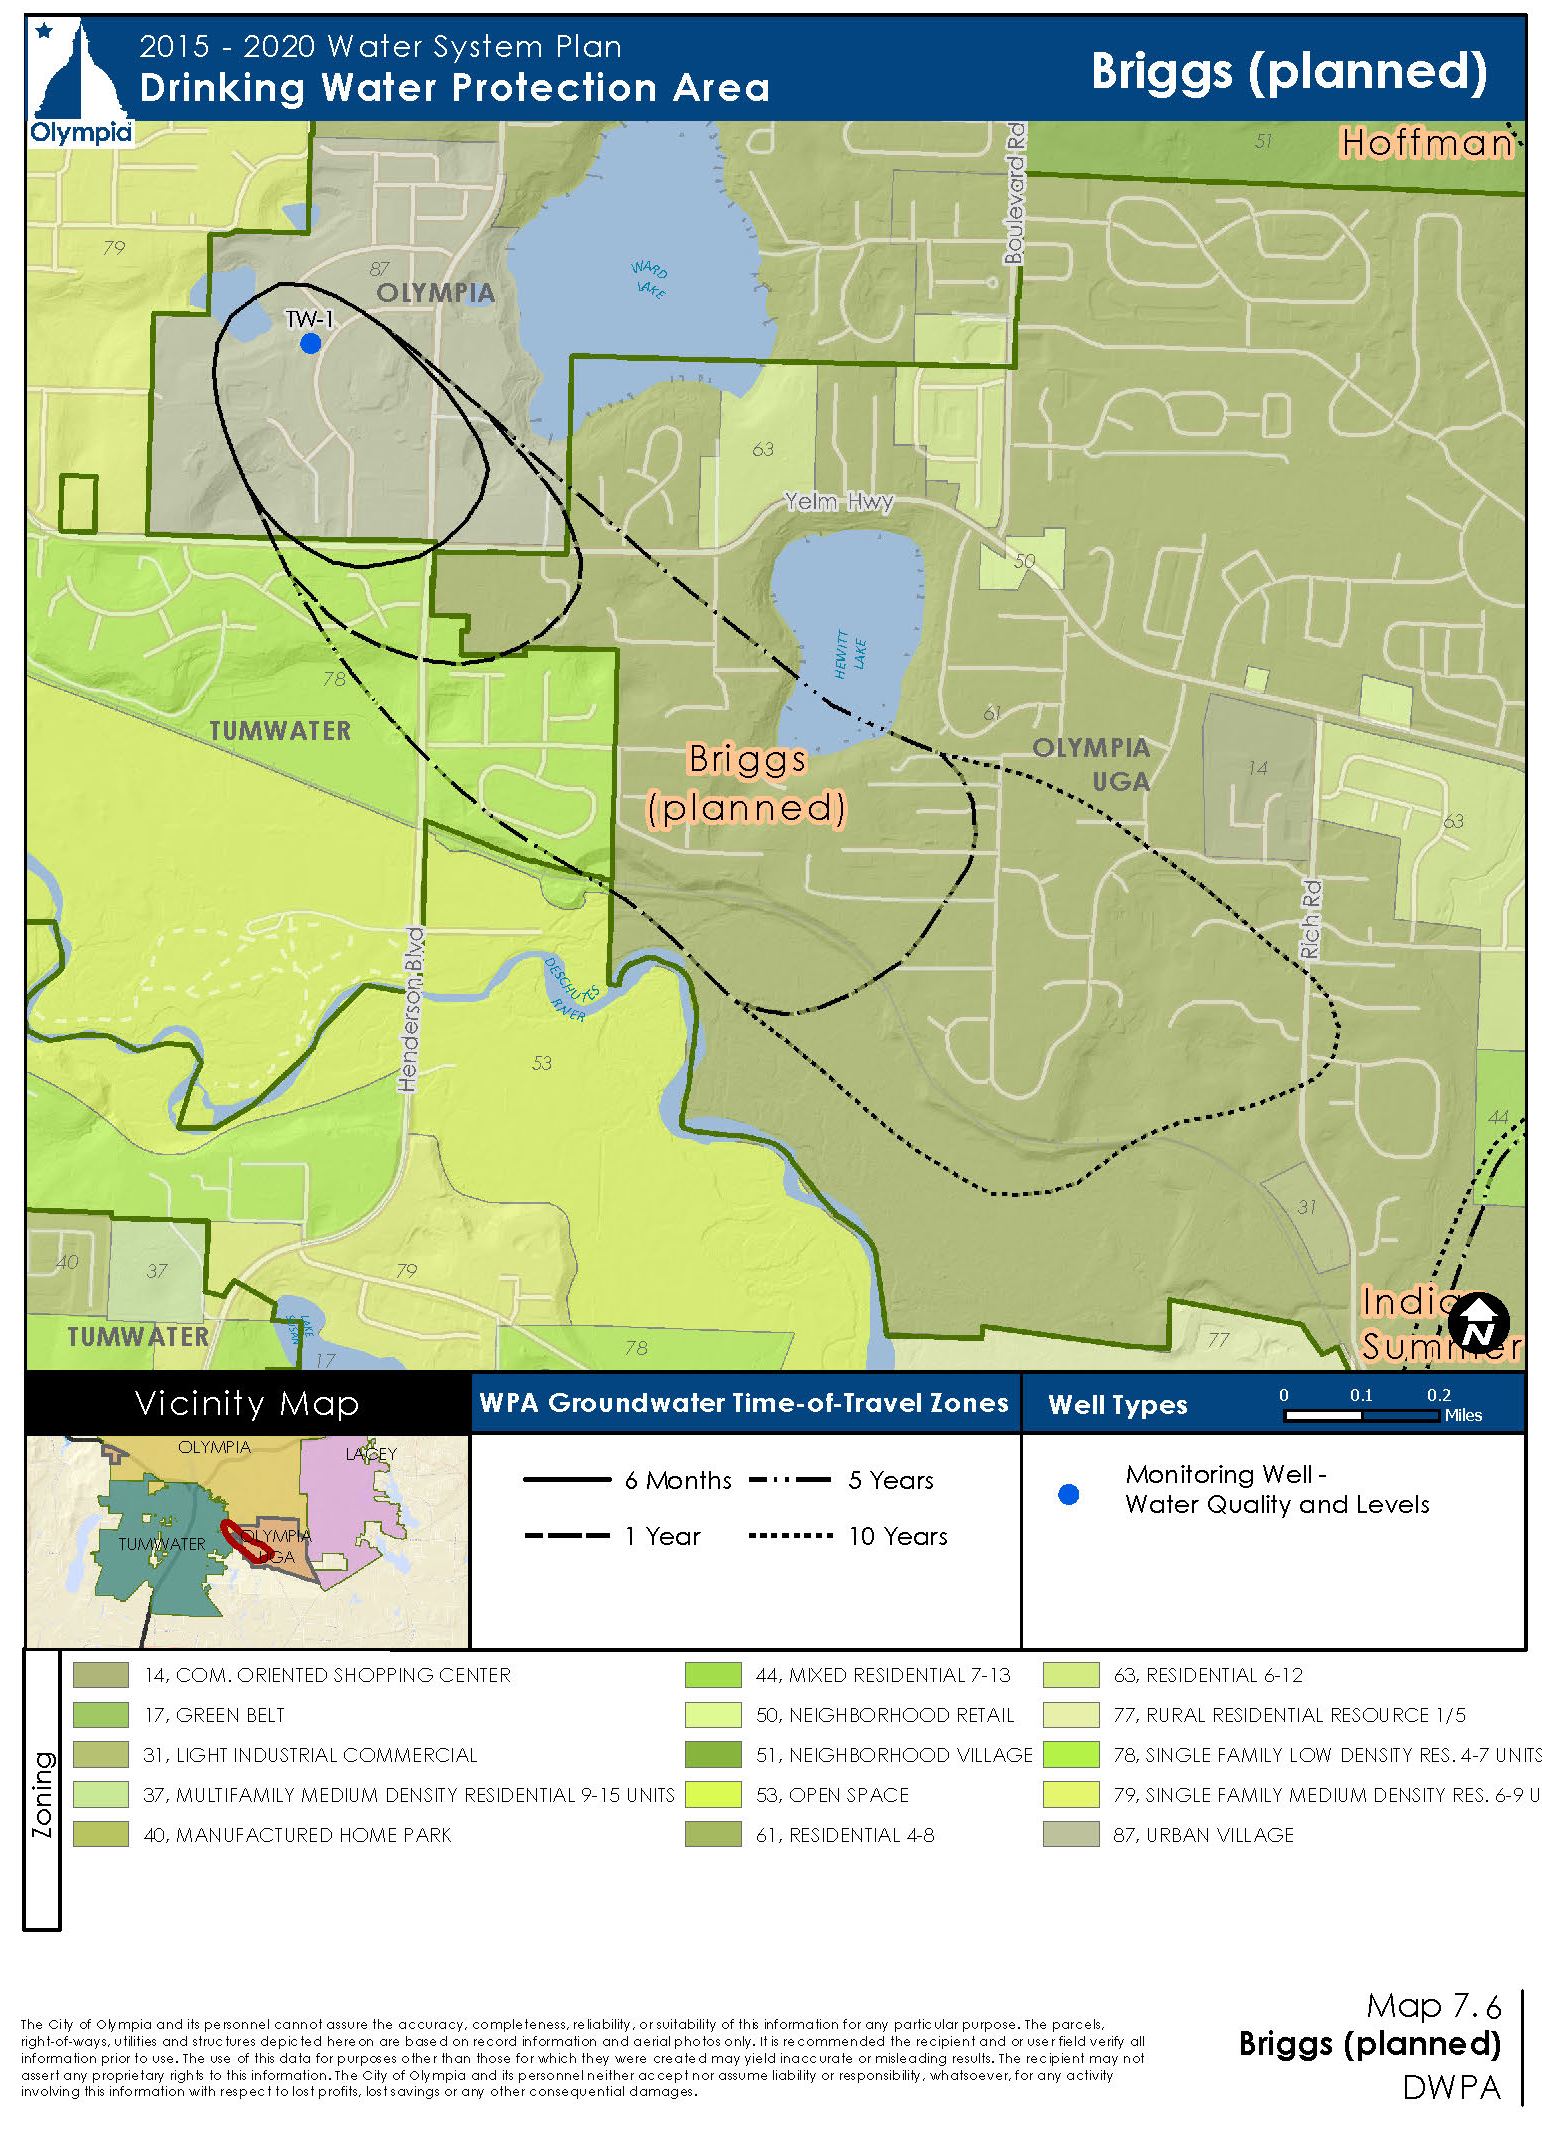
View Map 7.6 Briggs (planned) DWPA.